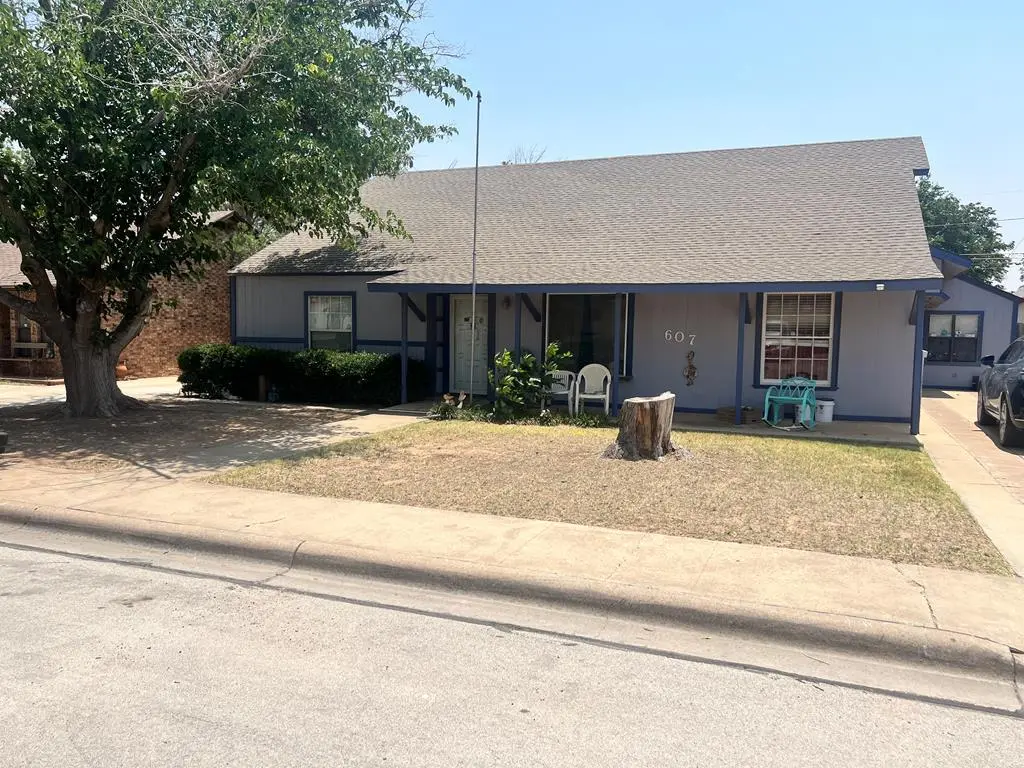
607 Nobles Ave · Midland, TX
Flood risk 1/10 · Minimal
- FEMA flood zone
- X
- Chance of flooding over 30 yrs
- 0.0%
- Est. flood insurance / yr
- $507 – $1,088
Fire risk 3/10 · Minor
- Est. fire insurance / yr
- $1,222 – $2,270
Heat risk 6/10 · Moderate
- Hot days now (above 102°F)
- 7 days/yr
- Hot days in 30 yrs
- 22 days/yr
Wind risk 2/10 · Minimal
- Chance of severe wind over 30 yrs
- 3.0%
Air-quality risk 1/10 · Minimal
- Unhealthy air days now
- 0 days/yr
- Unhealthy air days in 30 yrs
- 0 days/yr
Risk factors via First Street. Map © Google.
Why this score? — see what drove the C+ grade
The composite is a weighted blend of 9 inputs, each scored 0–100. Each bar is that input's sub-score; the figure is the points it added to the 100-point composite (weight × sub-score).
- Cash flow +26.6/30.0
- DSCR +9.1/10.0
- ARV discount +7.5/15.0
- 1% rule +6.7/10.0
- Livability +4.0/5.0
- Schools +3.2/10.0
- Rent growth +2.7/5.0
- Condition / age +2.5/5.0
- Appreciation +0.0/10.0
$249,000
🖨 Deal sheet (PDF) 📄 Offer letter ✓ Due diligence
Listing remarks
Fix & Hold or Fllip I 5BDR Potential with Income Producing Apartment I Endless opportunities with this property! Apartment is metered separately. Four bedroom 2 baths, 2 living areas in the main house. Sequestered primary bedroom with its own study. 2 Living Areas! Also, full apartment in back with living area, kitchen, bedroom and bath. This would make a great investment. AS IS sale.
Key facts
- Separate metering
- 7,797 sq ft lot
- Built 1950
Tags
Property features AI
Finance
- Other: Located in the Crestlawn subdivision
- Financial info: Annual tax listed
Exterior
- Utilities: Public water; Public sewer
- Home design: Single-family residence; Single-story
- Construction: Brick veneer and vinyl siding
- Exterior features: Composition roof; Lot approximately 0.179 acres
Interior
- Kitchen: Gas range; Gas water heater
- Flooring: Carpet; Tile
- Bathrooms: 2 full bathrooms
- Heating & cooling: Central heating; Central air; Ceiling fans
- Interior features: Built-in bookcases; Wood-burning fireplace in den
Neighborhood map
What this means for you Summary
Snapshot
- This is a 4-bed/2.0-bath single-family listed at $249k.
Deal economics
- At list price, monthly cash flow is $664 ($8k/yr) — positive.
- The deal already cash-flows at list — no discount required.
- Meets the 1% rule at list price ($3k rent vs $249k).
- Recommended offer: $242k (3.0% below list) — sets the bar for market timing.
- Cap rate 9.5% vs local median 4.7% in Midland — top-decile yield for the area; either an underpriced asset or a hidden risk that comps aren't pricing in. Stress-test before assuming the spread holds.
Location & tenants
- Location reads 79/100 on livability (#57 in TX, #2,192 nationally) — a middle-class / working-renter tenant base. Strengths: employment A+, housing A+, health & safety A+; Watch: crime C-, commute D+, amenities D.
- Midland ISD (urban): math 34% / reading 36% proficiency, ranked #477 of 826 in TX (top 58%) — families likely to look elsewhere, expect single-tenant / working-renter base with shorter leases.
- Zoned schools: Sam Houston Collegiate Preparatory El (math 37% / reading 42%, grade F, #1,545 of 4,322 statewide, top 38%, 469 students, 64% FRL, charter); San Jacinto J H (math 26% / reading 35%, grade F, #1,036 of 1,662 statewide, top 63%, 829 students, 54% FRL); Midland H S (math 37% / reading 7%, grade F, #1,366 of 1,632 statewide, top 84%, 2,492 students, 44% FRL) — zoned schools at 54% FRL track the district average.
- Market conditions: Rents flat; 114 active listings in the ZIP; 10 comparable units currently listed for rent nearby; rentals lingering (median 45d on market — plan ~5-8 weeks vacancy on turnover, expect pricing pressure); 70% of comp listings sitting > 30 days — soft ceiling on asking rent; 1,504 units permitted in Midland County in 2024 (0 in 5+ unit buildings).
- At $2,902/mo this rent would consume 61% of the median local household income ($57k/yr) (locally 938% of renters already pay >50% of income on rent) — very limited rent-growth headroom before tenants either downsize or default.
Forward outlook
- Local home prices are declining (-3.0%/yr); year-one equity from $2k of loan paydown is wiped out by about $7k of value loss. Plan a longer hold.
- Midland County population projected at +83% by 2050 — long-run rental-demand tailwind backs the buy-and-hold thesis.
Negotiation context
- It's been on market 31 days — a 3% lower offer ($242k) is reasonable based on typical stale-listing flexibility.
Risks & watch-outs
- Watch-outs: built in 1950 — expect roof / HVAC / electrical / plumbing capex.
- Climate carrying-cost: extreme-heat days projected 7→22/yr by 2055 (HVAC capex compounding) — expect insurance premiums to compound above CPI over the hold.
Questions for the listing agent
- It's been on market 31 days. Have you received any prior offers? Is the seller open to a 3% concession, seller financing, or rate buy-down credit?
- Built in 1950 — when were the roof, HVAC, electrical panel, plumbing, and water heater last replaced?
- Is there a deadline driving the sale (1031 exchange, divorce, estate, relocation)? That informs how much negotiation room exists.
- What's the average days-on-market for RENTAL listings here right now (not sales)? A rising rental-DOM trend means longer vacancies and softer asking-rent achievability than the comps imply.
- What's the recent tenant-quality profile in this submarket — average credit score on applications, eviction rate, late-payment / NSF rate, and stable-employment percentage? A property-management company in the area should have these aggregated.
- How much new for-sale + rental construction is in the pipeline within 1–3 miles? Heavy new supply typically softens prices + rents 12–24 months out; constrained supply supports both.
Investment metrics
- 1% rule
- 1.17% ✓
- Cap rate
- 9.49%
- Cash-on-cash
- 11.42%
- DSCR
- 1.51
- GRM
- 7.2
CMA / ARV
No comps found within radius.
Projected returns pro-forma
-3.0% appreciation · 0.74% rent growth · sell at horizon
- IRR
- -1.8%
- Equity multiple
- 0.93×
- Total profit
- $-4,549
- Equity at exit
- $37,127
- IRR
- 5.4%
- Equity multiple
- 1.36×
- Total profit
- $25,104
- Equity at exit
- $21,529
Cash invested: $69,720 (down + closing). Projections, not guarantees.
Landlord ↔ Tenant lean methodology
- Overall (STATE)
- 87 Strongly Landlord-Friendly
- State Texas
- 87 Strongly Landlord-Friendly · R+5
- County
- — inherits STATE
- City
- — inherits STATE
ZIP-level market 79701
- Rents YoY
- 0.7%
- Active inventory
- 114
- Price-to-rent
- 7.2×
Monthly cashflow live
- Estimated rent
- $2,902 high interval (Pro) →
- Mortgage (P&I)
- −$1,306
- Tax from tax record
- −$219 /mo · $2,629/yr
- Insurance
- −$104
- HOA
- −$0
- Vacancy / Maint / Mgmt
- −$609
- Net cashflow
- $664
Break-even live
Sensitivity live
| Price | -10% $805 | -5% $734 | +0% $664 | +5% $593 | +10% $523 |
|---|---|---|---|---|---|
| Rent | -10% $434 | -5% $549 | +0% $664 | +5% $778 | +10% $893 |
| Rate | -1.0pp $789 | -0.5pp $727 | base $664 | +0.5pp $599 | +1.0pp $533 |
UW: 25.0% down · 7.5% · 30yr · 1.5% tax · 5.0% vac · 8.0% maint · 8.0% mgmt
Financing live
Cash to close
- Down payment
- $62,250
- Closing costs
- $7,470
- Reserves months
- —
- Total cash needed
- —
Loan-product check · same deal, 3 products live
Conventional
25% down · 7.5% · 30yr
- Down + closing
- —
- Monthly P&I
- —
- Monthly cashflow
- —
- DSCR
- —
- Eligible?
- —
Personal DTI + credit; lowest rate.
DSCR
20% down · 8.5% · 30yr
- Down + closing
- —
- Monthly P&I
- —
- Monthly cashflow
- —
- DSCR
- —
- Eligible?
- —
No personal income docs; deal must DSCR.
Hard money
10% down · 12.0% · 12mo
- Down + closing
- —
- Monthly P&I
- —
- Monthly cashflow
- —
- DSCR
- —
- Eligible?
- —
Short-term bridge; refi at stabilization.
Rent comps 10 comps
| Address | Beds | Baths | Sqft | Rent | $/sqft | DOM | Units | Dist |
|---|---|---|---|---|---|---|---|---|
| 1305 Lawson Ave Midland, TX | 3.0 | 2.0 | 2065 | $2,450 | $1.19 | 45d | 1 | 0.63mi |
| 1509 Bedford Dr Midland, TX | 4.0 | 2.0 | 3733 | $4,500 | $1.21 | 45d | 1 | 0.70mi |
| 1500 N Terrell St Midland, TX | 3.0 | 2.0 | 2027 | $2,600 | $1.28 | 15d | 1 | 0.77mi |
| 806 Neely Ave Midland, TX | 3.0 | 3.5 | 2767 | $3,900 | $1.41 | 45d | 1 | 0.84mi |
| 1902 N I St Midland, TX | 3.0 | 2.5 | 2178 | $2,400 | $1.10 | 45d | 1 | 0.90mi |
| 1603 N L St Midland, TX | 4.0 | 3.0 | 2230 | $3,200 | $1.43 | 45d | 1 | 0.96mi |
| 2800 N Pecos St Unit B Midland, TX | 3.0 | 2.5 | 2148 | $2,100 | $0.98 | 22d | 1 | 1.03mi |
| 2800 N Pecos St Midland, TX | 3.0 | 3.0 | 2148 | $2,100 | $0.98 | 22d | 1 | 1.03mi |
| 1413 Ventura Ave Midland, TX | 3.0 | 2.0 | 2400 | $2,895 | $1.21 | 45d | 1 | 1.11mi |
| 2204 Boyd Ave Midland, TX | 3.0 | 2.0 | 2068 | $3,000 | $1.45 | 45d | 1 | 1.16mi |
Listing history 20 events
-
2026-06-22remarks 390-char remark
-
2026-06-22days on market $249,000 Active 31 DOM
-
2026-06-19days on market $249,000 Active 29 DOM
-
2026-06-18days on market $249,000 Active 28 DOM
-
2026-06-17days on market $249,000 Active 27 DOM
-
2026-06-16days on market $249,000 Active 26 DOM
-
2026-06-15days on market $249,000 Active 25 DOM
-
2026-06-14days on market $249,000 Active 23 DOM
-
2026-06-13days on market $249,000 Active 22 DOM
-
2026-06-10days on market $249,000 Active 20 DOM
-
2026-06-09days on market $249,000 Active 19 DOM
-
2026-06-08days on market $249,000 Active 18 DOM
-
2026-06-07days on market $249,000 Active 17 DOM
-
2026-06-03days on market $249,000 Active 13 DOM
-
2026-06-02days on market $249,000 Active 12 DOM
-
2026-06-01days on market $249,000 Active 11 DOM
-
2026-05-31days on market $249,000 Active 10 DOM
-
2026-05-30days on market $249,000 Active 9 DOM
-
2026-05-21$249,000 Active
-
1958-08-29soldstatus
ⓘ Source: listings_history table (triggers on properties + properties_extension) + one-shot
backfill from property_details.listing_events for pre-trigger history.
Tax reassessment forecast TX · Resets to sale price
- Current annual tax
- $2,629 · $219/mo
- Projected year-2 tax
- $4,557 · $380/mo
- Expected delta
- +$1,927/yr (+$161/mo · 73.3%)
ⓘ Screening estimate from a state-policy table — verify with the county assessor before closing.
Climate risk First Street
- Flood 1/10 Low FEMA zone X · 0% chance over 30 yrs
- Wildfire 3/10 Moderate
- Heat 6/10 Major 7 d/yr ≥102°F today · 22 d/yr by 30 yrs out
- Wind 2/10 Low 3% chance of damaging wind over 30 yrs
- Air quality 1/10 Low 0 unhealthy d/yr today · 0 by 30 yrs out
Nearby sold comps map
Loading sold comps map…
Walkable amenities ~0.75 mi
Loading nearby amenities…
Taxation est. · year 1
- Rental income
- $34,819
- − Mortgage interest
- −$13,948
- − Property taxes
- −$2,629
- − Insurance
- −$1,245
- − Repairs & maintenance
- −$2,786
- − Management
- −$2,786
- − Depreciation
- −$7,244
- Taxable income
- $4,182
- Est. tax owed @ 24.0%
- −$1,004
- After-tax cash flow
- $6,959/yr
For passive investors: Depreciation is non-cash, so a rental often shows a tax loss while cash-flowing — sheltering income. Rental losses are passive: they offset passive income freely, and up to $25,000/yr can offset ordinary (W-2) income if you actively participate and your MAGI is under $100k (phasing out to $0 by $150k); unused losses carry forward. On sale, claimed depreciation is recaptured at up to 25%, and gains may owe capital-gains tax (a 1031 exchange can defer both). Figures are a year-1 estimate at your 24.0% rate — not tax advice; consult a CPA.
Schools (NCES district)
- District
- Midland ISD
- NCES district ID
- 4830570
- Math proficiency
- 34% ▼ -7.00%
- Reading proficiency
- 36% ▬ 0.00%
- Median HH income
- $63,457
- Composite
- 31.63/100
- National rank
- #5938
- State rank
- #477 of 826 in TX
Livability — Midland
- Score
- 79/100
- State rank
- #57
- US rank
- #2192
Category grades
Schools grade is shown separately in the Schools card above.
Census & demographics
- Census place
- Midland, TX
- County
- Midland County · 168,494 people
- City population
- 168,494
- Metro
- Midland, TX
- Population (ZIP)
- 27,131
- Household income
- $57,346
- Rent vs Own
- Severe rent burden
- 938.0
Population outlook (Midland County) Hauer SSP2
- Today (2025)
- 220,895 people
- By 2030
- 253,667 · +14.8%
- By 2040
- 325,498 · +47.4%
- By 2050
- 404,168 · +83.0%
- By 2075
- 609,802 · +176.1%
- By 2100
- 760,172 · +244.1%
Race, ethnicity, and origin ACS 2023
- Neighborhood character
- Diverse neighborhood (Simpson 0.55)
- Race & ethnicity
- Hispanic / Latino 61% Two or more races 28% White 27% Black 10%
- Hispanic origin (detail)
- Mexican 57%
- Common ancestry
- Lithuanian 1% Slovak 1% Ukrainian 1%
- Foreign-born
- 17% · Canada
- Languages at home
- 55% English-only · Spanish 44%
Political lean MEDSL · Midland
- 2024 margin
- Solid R (+60.5) · D 19.3% · R 79.8%
- 2008→2024 swing
- -3.3pp toward R · 2008: -57.3pp · 2024: -60.5pp
- All cycles
- 2024: R+60.5 2020: R+56.6 2016: R+55.2 2012: R+61.5 2008: R+57.3
Not yet ingested
- Civics
- —
Market trends
- HPI YoY
- ▼ -227.32%
- Current HPI
- 234.6111
- Rent YoY
- ▲ 0.74%
- Metro
- Midland, TX
- State GDP YoY
- ▲ 3.95%
- F500 in state
- 110
Industry mix (Fortune 500 HQ in TX)
| Industry | F500 HQs | Revenue |
|---|---|---|
| Energy | 16 | $1,198B |
|
||
| Technology | 5 | $198B |
|
||
| Engineering / Construction | 4 | $72B |
|
||
| Energy Services | 3 | $60B |
|
||
| Utilities | 3 | $41B |
|
||
| Healthcare | 2 | $330B |
|
||
Price history
2 events — show timeline
- 2026-05-21 Listed $249,000 PBBOR
- 1958-08-29 Sold (Public Records) — Public Records
Property tax history
+2.0%/yrLatest (2025): $2,629 · -3.4% YoY. Source: county tax records.
Cash-flow waterfall
monthlySold comps — $/sqft
last 12 mo · ≤1 miLoading sold comps…