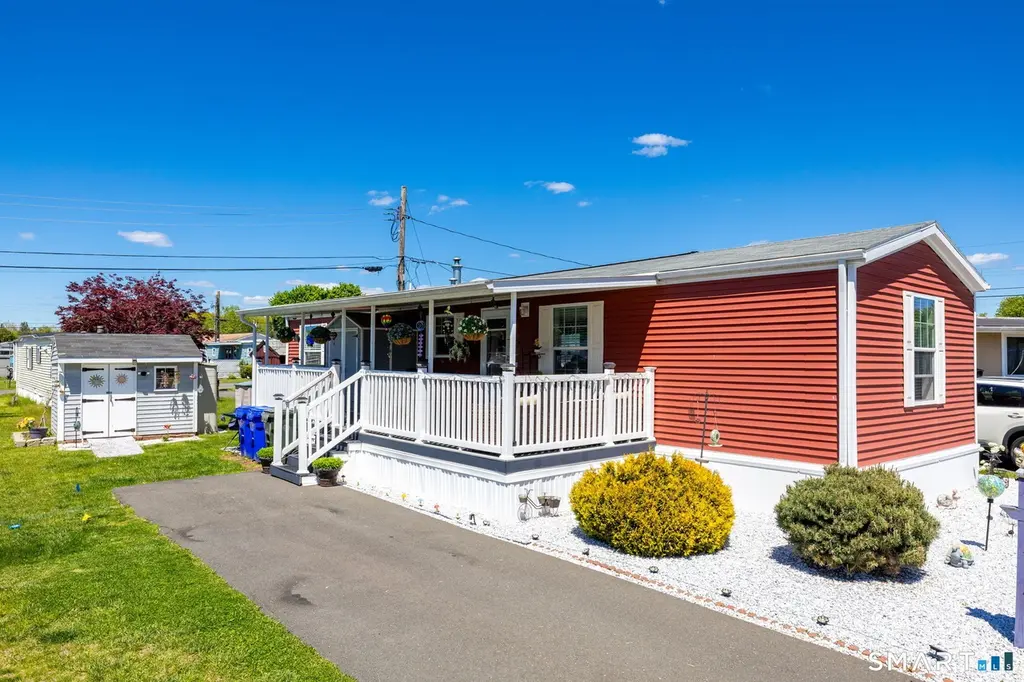
4 Apache Rd · East Hartford, CT
Flood risk No data
- FEMA flood zone
- —
- Chance of flooding over 30 yrs
- —
- Est. flood insurance / yr
- —
Fire risk No data
- Est. fire insurance / yr
- —
Heat risk No data
- Hot days now (above threshold)
- —
- Hot days in 30 yrs
- —
Wind risk No data
- Chance of severe wind over 30 yrs
- —
Air-quality risk No data
- Unhealthy air days now
- —
- Unhealthy air days in 30 yrs
- —
Risk factors via First Street. Map © Google.
Why this score? — see what drove the C grade
The composite is a weighted blend of 9 inputs, each scored 0–100. Each bar is that input's sub-score; the figure is the points it added to the 100-point composite (weight × sub-score).
- Cash flow +23.0/30.0
- 1% rule +10.0/10.0
- ARV discount +7.5/15.0
- DSCR +7.4/10.0
- Livability +3.7/5.0
- Rent growth +2.5/5.0
- Condition / age +2.5/5.0
- Schools +2.1/10.0
- Appreciation +0.0/10.0
$104,999
🖨 Deal sheet 📄 Offer letter ✓ Due diligence
Listing remarks
Step into this beautifully remodeled 2-bedroom, 1.5-bath manufactured home located in the desirable Rivermead Pointe community in East Hartford. Built in 2016 and extensively updated in 2025, this move-in ready home offers modern finishes, open-concept living, and low-maintenance comfort throughout. The stunning updated kitchen features white shaker-style cabinetry, elegant butcher block countertops, sleek black hardware, farmhouse sink, and updated fixtures throughout. The open flow between the kitchen and living area creates the perfect space for entertaining or everyday living. Additional 2025 updates include luxury vinyl plank flooring, freshly renovated full and half bathrooms, fresh p
Key facts
- Built 2016
- Listed 12 days
Property features AI
Finance
- Financial info: Property listed as single family for sale; Property on leased land; Professionally managed on-site
- HOA & community: Homeowners association with monthly fee; HOA includes clubhouse, front desk receptionist, grounds maintenance, trash pickup, snow removal, property management, and road maintenance; Association amenities include a clubhouse; HOA fee reported monthly
Exterior
- Utilities: Public water connected; Public sewer connected; In-ground fuel tank
- Home design: Single-family home on leased land; Prefab construction
- Construction: Asphalt shingle roof; Block and concrete foundation; Prefab construction
- Exterior features: Covered deck; Level lot; Vinyl siding; Red exterior color
Interior
- Kitchen: Electric cooktop; Microwave; Refrigerator
- Bedrooms: 2 bedrooms
- Bathrooms: 1 full bathroom; 1 half bathroom
- Heating & cooling: Hot air heating; Propane-fueled heating
- Interior features: Central air conditioning; No basement
- Laundry & utility: Washer and electric dryer located on the main level; 40-gallon hot water tank
Neighborhood map
What this means for you Summary
Snapshot
- This is a 2-bed/1.0-bath manufactured listed at $105k.
Deal economics
- At list price, monthly cash flow is $187 ($2k/yr) — positive.
- The deal already cash-flows at list — no discount required.
- Meets the 1% rule at list price ($2k rent vs $105k).
- Cap rate 8.4% vs local median 4.2% in East Hartford — top-decile yield for the area; either an underpriced asset or a hidden risk that comps aren't pricing in. Stress-test before assuming the spread holds.
Location & tenants
- Location reads 73/100 on livability (#76 in CT) — a middle-class / working-renter tenant base. Strengths: housing A+, crime A, commute A-; Watch: amenities F, health & safety F.
- East Hartford School District (urban): math 17% / reading 30% proficiency, ranked #140 of 153 in CT (top 92%) — low school quality limits family demand, transient renter base, plan for 1-2y turnover.
- Zoned schools: Dr. Thomas S. O'Connell School (math 28% / reading 42%, grade F, #337 of 553 statewide, top 61%, 525 students, 63% FRL); East Hartford High School (math 11% / reading 33%, grade F, #156 of 194 statewide, top 82%, 1,698 students, 63% FRL).
- Market conditions: 100 active listings in the ZIP; 4 comparable units currently listed for rent nearby; rentals leasing fast (median 3d on market — plan ~1-2 weeks tenant-placement turnaround); solid renter incomes; 1,867 units permitted in Capitol Planning Region in 2024 (1,399 in 5+ unit buildings).
- This rent runs 32% of the median local income ($80k/yr) — at the standard rent-burdened threshold; future hikes will face affordability resistance.
Forward outlook
- Local home prices are declining (-3.0%/yr); year-one equity from $726 of loan paydown is wiped out by about $3k of value loss. Plan a longer hold.
Negotiation context
- Only 12 days on market — expect competitive offers; lowballing is unlikely to land.
- Current owner paid $55k; list at $105k implies a 91% gain — meaningful room to come down on a strong offer.
Risks & watch-outs
- Watch-outs: HOA is 37% of rent.
Questions for the listing agent
- What does the HOA fee cover, when was the last increase, and are there any pending special assessments or reserve-fund shortfalls?
- Is there a deadline driving the sale (1031 exchange, divorce, estate, relocation)? That informs how much negotiation room exists.
- Schools are D-rated, which usually means shorter tenancies and higher turnover. Who's the typical renter profile here, and what's been the actual vacancy rate?
- What's the average days-on-market for RENTAL listings here right now (not sales)? A rising rental-DOM trend means longer vacancies and softer asking-rent achievability than the comps imply.
- What's the recent tenant-quality profile in this submarket — average credit score on applications, eviction rate, late-payment / NSF rate, and stable-employment percentage? A property-management company in the area should have these aggregated.
- How much new for-sale + rental construction is in the pipeline within 1–3 miles? Heavy new supply typically softens prices + rents 12–24 months out; constrained supply supports both.
Investment metrics
- 1% rule
- 2.02% ✓
- Cap rate
- 8.43%
- Cash-on-cash
- 7.64%
- DSCR
- 1.34
- GRM
- 4.1
CMA / ARV
- ARV (median comp)
- $56,825
- List price
- $104,999
- Delta
- 84.78%
- Verdict
- OVERPRICED
- Comps
- 20 within 1.0 mi
Projected returns pro-forma
-3.0% appreciation · 3.0% rent growth · sell at horizon
- IRR
- -4.2%
- Equity multiple
- 0.84×
- Total profit
- $-4,594
- Equity at exit
- $15,656
- IRR
- 6.0%
- Equity multiple
- 1.46×
- Total profit
- $13,382
- Equity at exit
- $9,078
Cash invested: $29,400 (down + closing). Projections, not guarantees.
Landlord ↔ Tenant lean methodology
- Overall (STATE)
- 27 Tenant-Leaning
- State Connecticut
- 27 Tenant-Leaning · D+7
- County
- — inherits STATE
- City
- — inherits STATE
ZIP-level market 06118
- Home prices YoY
- -33.7%
- Active inventory
- 100
- Price-to-rent
- 4.1×
Monthly cashflow live
- Estimated rent
- $2,121 medium interval (Pro) →
- Mortgage (P&I)
- −$551
- Tax from tax record
- −$118 /mo · $1,414/yr
- Insurance
- −$44
- HOA
- −$776
- Vacancy / Maint / Mgmt
- −$445
- Net cashflow
- $187
Break-even live
UW: 25.0% down · 7.5% · 30yr · 1.5% tax · 5.0% vac · 8.0% maint · 8.0% mgmt
Financing live
Cash to close
- Down payment
- $26,250
- Closing costs
- $3,150
- Reserves months
- —
- Total cash needed
- —
Loan-product check · same deal, 3 products live
Conventional
25% down · 7.5% · 30yr
- Down + closing
- —
- Monthly P&I
- —
- Monthly cashflow
- —
- DSCR
- —
- Eligible?
- —
Personal DTI + credit; lowest rate.
DSCR
20% down · 8.5% · 30yr
- Down + closing
- —
- Monthly P&I
- —
- Monthly cashflow
- —
- DSCR
- —
- Eligible?
- —
No personal income docs; deal must DSCR.
Hard money
10% down · 12.0% · 12mo
- Down + closing
- —
- Monthly P&I
- —
- Monthly cashflow
- —
- DSCR
- —
- Eligible?
- —
Short-term bridge; refi at stabilization.
Rent comps 4 comps
| Address | Beds | Baths | Sqft | Rent | $/sqft | DOM | Units | Dist |
|---|---|---|---|---|---|---|---|---|
| 92 Main St East Hartford, CT | 2.0 | 1.0 | 1100 | $2,200 | $2.00 | 2d | 1 | 0.65mi |
| 210 Handel Rd East Hartford, CT | 3.0 | 1.5 | 912 | $2,400 | $2.63 | 1d | 1 | 1.01mi |
| 10 Glastonbury Blvd Glastonbury, CT | 1.0–3.0 | 1.0–3.0 | 1083 | $3,372 | $3.11 | 1d | 4 | 1.28mi |
| 49 Brewster Rd Unit C Glastonbury, CT | 1.0 | 1.0 | 670 | $1,600 | $2.39 | 3d | 1 | 1.33mi |
HOA detail
- Monthly dues
- $776 · $9,312/yr
Listing history 4 events
-
2026-05-15$104,999 Active 1222-char remark
-
2026-05-14historical $104,999 1222-char remark
-
2016-05-19soldstatus $55,000
-
2013-09-06soldstatus $67,000
ⓘ Source: listings_history table (triggers on properties + properties_extension) + one-shot
backfill from property_details.listing_events for pre-trigger history.
Tax reassessment forecast CT · Partial reset (capped growth)
- Current annual tax
- $1,414 · $118/mo
- Projected year-2 tax
- $1,830 · $153/mo
- Expected delta
- +$416/yr (+$35/mo · 29.5%)
ⓘ Screening estimate from a state-policy table — verify with the county assessor before closing.
Nearby sold comps map
Loading sold comps map…
Walkable amenities ~0.75 mi
Loading nearby amenities…
Taxation est. · year 1
- Rental income
- $25,449
- − Mortgage interest
- −$5,882
- − Property taxes
- −$1,414
- − Insurance
- −$525
- − Repairs & maintenance
- −$2,036
- − Management
- −$2,036
- − HOA
- −$9,312
- − Depreciation
- −$3,055
- Taxable income
- $1,190
- Est. tax owed @ 24.0%
- −$286
- After-tax cash flow
- $1,960/yr
For passive investors: Depreciation is non-cash, so a rental often shows a tax loss while cash-flowing — sheltering income. Rental losses are passive: they offset passive income freely, and up to $25,000/yr can offset ordinary (W-2) income if you actively participate and your MAGI is under $100k (phasing out to $0 by $150k); unused losses carry forward. On sale, claimed depreciation is recaptured at up to 25%, and gains may owe capital-gains tax (a 1031 exchange can defer both). Figures are a year-1 estimate at your 24.0% rate — not tax advice; consult a CPA.
Schools (NCES district)
- District
- East Hartford School District
- NCES district ID
- 0901260
- Math proficiency
- 17% ▼ -5.00%
- Reading proficiency
- 30% ▼ -7.00%
- Median HH income
- $49,691
- Composite
- 20.74/100
- National rank
- #8519
- State rank
- #140 of 153 in CT
Livability — East Hartford
- Score
- 73/100
- State rank
- #76
- US rank
- #5527
Category grades
Schools grade is shown separately in the Schools card above.
Census & demographics
- Census place
- East Hartford, CT
- County
- Hartford County · 754,208 people
- City population
- 50,918
- Metro
- Hartford-East Hartford-Middletown, CT
- Population (ZIP)
- 27,419
- Household income
- $79,740
- Rent vs Own
- Severe rent burden
- 820.0
Population outlook (Capitol County) Hauer SSP2
- By 2040
- 1,063,519
Race, ethnicity, and origin ACS 2023
- Neighborhood character
- Diverse neighborhood (Simpson 0.69)
- Race & ethnicity
- White 40% Hispanic / Latino 33% Black 20% Two or more races 14% Asian 4%
- Hispanic origin (detail)
- Puerto Rican 22% Dominican 3%
- Common ancestry
- Romanian 4% Lithuanian 4% Scotch-Irish 2%
- Foreign-born
- 17% · Canada, Vietnam, Jamaica
- Languages at home
- 65% English-only · Spanish 23% Other Indo-European 3% Russian/Polish/Slavic 2%
Political lean MEDSL · Capitol
- 2024 margin
- Strong D (+21.9) · D 60.1% · R 38.2% · Other 1.7%
- All cycles
- 2024: D+21.9
Not yet ingested
- Civics
- —
Market trends
- HPI YoY
- ▼ -127.16%
- Current HPI
- 250.5647
- Rent YoY
- —
- Metro
- Hartford-East Hartford-Middletown, CT
- State GDP YoY
- ▲ 1.06%
- F500 in state
- 38
Industry mix (Fortune 500 HQ in CT)
| Industry | F500 HQs | Revenue |
|---|---|---|
| Industrial Machinery | 4 | $38B |
|
||
| Insurance | 3 | $71B |
|
||
| Financial Services | 2 | $25B |
|
||
| Transportation / Logistics | 2 | $18B |
|
||
| Healthcare | 1 | $247B |
|
||
| Telecommunications | 1 | $55B |
|
||
Price history
+56.7% since first listed5 events — show timeline
- 2026-05-26 Pending — Smart MLS
- 2026-05-15 Listed $104,999 Smart MLS
- 2026-05-14 Coming Soon $104,999 Smart MLS
- 2016-05-19 Sold (Public Records) $55,000 Public Records
- 2013-09-06 Sold (Public Records) $67,000 Public Records
Property tax history
+2.5%/yrLatest (2025): $1,414 · +4.3% YoY. Source: county tax records.
Cash-flow waterfall
monthlySold comps — $/sqft
last 12 mo · ≤1 miLoading sold comps…