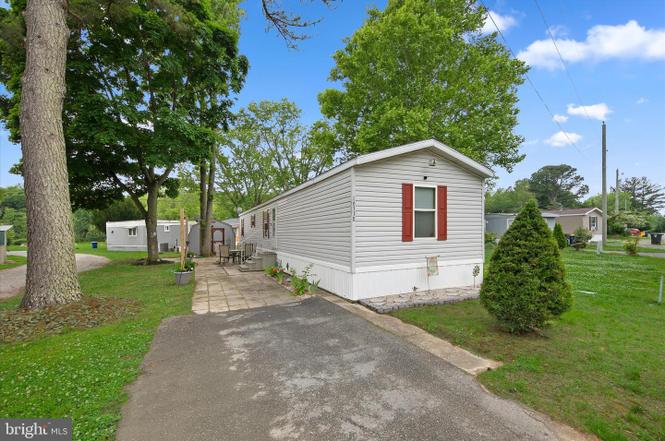
16338 W Grandview St · Lewes, DE
Flood risk 3/10 · Minor
- FEMA flood zone
- X (unshaded)
- Chance of flooding over 30 yrs
- 0.12%
- Est. flood insurance / yr
- $473 – $860
Fire risk 3/10 · Minor
- Est. fire insurance / yr
- $476 – $884
Heat risk 8/10 · Major
- Hot days now (above 101°F)
- 7 days/yr
- Hot days in 30 yrs
- 18 days/yr
Wind risk 8/10 · Major
- Chance of severe wind over 30 yrs
- 80.0%
Air-quality risk 2/10 · Minimal
- Unhealthy air days now
- 1 days/yr
- Unhealthy air days in 30 yrs
- 1 days/yr
Risk factors via First Street. Map © Google.
Why this score? — see what drove the B+ grade
The composite is a weighted blend of 9 inputs, each scored 0–100. Each bar is that input's sub-score; the figure is the points it added to the 100-point composite (weight × sub-score).
- Cash flow +30.0/30.0
- ARV discount +15.0/15.0
- 1% rule +10.0/10.0
- DSCR +10.0/10.0
- Schools +4.2/10.0
- Livability +3.4/5.0
- Rent growth +2.7/5.0
- Condition / age +2.2/5.0
- Appreciation +0.0/10.0
$90,000
🖨 Deal sheet (PDF) 📄 Offer letter ✓ Due diligence
Listing remarks
Location is the highlight of this 3-bedroom, 1.5-bath home! Located along the Lewes-Georgetown Trail (great for biking, walking, strolling and running) and just minutes from Historic Downtown Lewes and the beach, you'll love having restaurants, shopping, and outdoor recreation practically at your doorstep. The home features vaulted ceilings, plank flooring throughout most of the home, vinyl flooring in the kitchen, gas cooking, a French-door refrigerator, a patio, and a storage shed. Recent community improvements, including city water, city sewer, and city trash service, have helped transform this well-located neighborhood. Grab breakfast from the nearby Roll 'n Egg food truck, hop on the b
Key facts
- Outdoor recreation
- Storage shed
- City water
Tags
Property features AI
Finance
- Financial info: Lease not considered
- HOA & community: Ground rent paid annually; Land lease $706 per month (approximately 1 year remaining)
Exterior
- Parking: Driveway parking; 2 driveway spaces (total 2 garage/parking spaces)
- Utilities: Public water; Public sewer; 100 amp electric service; Internet: Satellite, Cable, Broadband, Fiber Optic
- Home design: Manufactured home; Land lease ownership; Property in very good condition; Built (year source: assessor)
- Construction: Vinyl siding; Batts and blown-in insulation; Asphalt roof; Pillar/post/pier foundation; Building not winterized
- Exterior features: Patio(s); Shed; Not in a federal flood zone; Municipal trash service not provided
Interior
- Bedrooms: 3 bedrooms on the main level
- Bathrooms: 1 full bathroom on the main level; 1 half bathroom on the main level
- Heating & cooling: Forced air heating; Propane (leased) heating fuel; Central air conditioning; Electric hot water
- Interior features: Cathedral ceilings; Thresholds less than 5/8"
- Laundry & utility: Laundry on the main floor
Neighborhood map
What this means for you Summary
Snapshot
- This is a 3-bed/1.5-bath single-family listed at $90k. Condition is rated fair.
Deal economics
- At list price, monthly cash flow is $1k ($17k/yr) — positive.
- The deal already cash-flows at list — no discount required.
- Meets the 1% rule at list price ($3k rent vs $90k).
- Cap rate 24.7% vs local median 1.7% in Lewes — top-decile yield for the area; either an underpriced asset or a hidden risk that comps aren't pricing in. Stress-test before assuming the spread holds.
Location & tenants
- Location reads 67/100 on livability (#40 in DE) — a middle-class / working-renter tenant base. Strengths: crime A+, employment A+, health & safety A+; Watch: commute F, cost of living F.
- Cape Henlopen School District (town): math 42% / reading 55% proficiency, ranked #5 of 26 in DE (top 19%) — families likely to look elsewhere, expect single-tenant / working-renter base with shorter leases.
- Zoned schools: Cape Henlopen High School (math 26% / reading 51%, grade F, #14 of 40 statewide, top 33%, 1,813 students, 0% FRL) — zoned schools average 0% FRL vs 41% district-wide (41 pts lower); this property's tenant base skews higher-income than the district average.
- Market conditions: Rents flat; 818 active listings in the ZIP; 4 comparable units currently listed for rent nearby; rentals lingering (median 45d on market — plan ~5-8 weeks vacancy on turnover, expect pricing pressure); 75% of comp listings sitting > 30 days — soft ceiling on asking rent; solid renter incomes; 4,354 units permitted in Sussex County in 2024 (344 in 5+ unit buildings).
- This rent runs 31% of the median local income ($97k/yr) — at the standard rent-burdened threshold; future hikes will face affordability resistance.
Forward outlook
- Local home prices are declining (-3.0%/yr); year-one equity from $622 of loan paydown is wiped out by about $3k of value loss. Plan a longer hold.
- Sussex County population projected at +25% by 2050 — long-run rental-demand tailwind backs the buy-and-hold thesis.
- At projected returns (-3.0% appreciation + 0.8% rent growth), your $25k cash investment doubles in ~2 years — after that, you're playing with house money.
Negotiation context
- Only 3 days on market — expect competitive offers; lowballing is unlikely to land.
Risks & watch-outs
- Climate carrying-cost: severe wind risk, 80% chance of damaging wind over 30y; extreme-heat days projected 7→18/yr by 2055 (HVAC capex compounding) — expect insurance premiums to compound above CPI over the hold.
Questions for the listing agent
- Have any recent inspections been done? Can we get a copy of the seller's disclosures and any deferred-maintenance estimates?
- Is there a deadline driving the sale (1031 exchange, divorce, estate, relocation)? That informs how much negotiation room exists.
- Schools are B-rated — typically a magnet for longer-tenancy family renters. What's the average tenant stay here, and is there a school-zone premium baked into asking?
- What's the average days-on-market for RENTAL listings here right now (not sales)? A rising rental-DOM trend means longer vacancies and softer asking-rent achievability than the comps imply.
- What's the recent tenant-quality profile in this submarket — average credit score on applications, eviction rate, late-payment / NSF rate, and stable-employment percentage? A property-management company in the area should have these aggregated.
- How much new for-sale + rental construction is in the pipeline within 1–3 miles? Heavy new supply typically softens prices + rents 12–24 months out; constrained supply supports both.
Investment metrics
- 1% rule
- 2.82% ✓
- Cap rate
- 24.74%
- Cash-on-cash
- 65.88%
- DSCR
- 3.93
- GRM
- 3.0
CMA / ARV
- ARV (on-the-fly)
- $119,560
- Comps found
- 2
Show comp detail 2 sales within ~0.75 mi
| Address | Dist | Beds/Ba | Sqft | Sold | Price | $/sf | Match |
|---|---|---|---|---|---|---|---|
| 34017 Pinewood Rd | 0.71mi | 2/2.0 (-1) | 980 (0%) | 3mo | $120,000 | $122 | 57 |
| 17132 Holly Rd | 0.74mi | 3/2.0 | 952 (-3%) | 10mo | $82,000 | $86 | 50 |
Match score weights: distance 35% · size 25% · config 20% · recency 20%. Top-matched comps best support the ARV.
Projected returns pro-forma
-3.0% appreciation · 0.77% rent growth · sell at horizon
- IRR
- 62.6%
- Equity multiple
- 3.70×
- Total profit
- $67,994
- Equity at exit
- $13,419
- IRR
- 66.3%
- Equity multiple
- 6.99×
- Total profit
- $150,958
- Equity at exit
- $7,782
Cash invested: $25,200 (down + closing). Projections, not guarantees.
Landlord ↔ Tenant lean methodology
- Overall (STATE)
- 70 Landlord-Friendly
- State Delaware
- 70 Landlord-Friendly · D+7
- County
- — inherits STATE
- City
- — inherits STATE
ZIP-level market 19958
- Rents YoY
- 0.8%
- Active inventory
- 818
- Price-to-rent
- 3.0×
Monthly cashflow live
- Estimated rent
- $2,538 medium interval (Pro) →
- Mortgage (P&I)
- −$472
- Tax est. 1.5%
- −$112 /mo · $1,350/yr
- Insurance
- −$38
- HOA
- −$0
- Vacancy / Maint / Mgmt
- −$533
- Net cashflow
- $1,383
Break-even live
Sensitivity live
| Price | -10% $1,446 | -5% $1,415 | +0% $1,383 | +5% $1,352 | +10% $1,321 |
|---|---|---|---|---|---|
| Rent | -10% $1,183 | -5% $1,283 | +0% $1,383 | +5% $1,484 | +10% $1,584 |
| Rate | -1.0pp $1,429 | -0.5pp $1,406 | base $1,383 | +0.5pp $1,360 | +1.0pp $1,336 |
UW: 25.0% down · 7.5% · 30yr · 1.5% tax · 5.0% vac · 8.0% maint · 8.0% mgmt
Financing live
Cash to close
- Down payment
- $22,500
- Closing costs
- $2,700
- Reserves months
- —
- Total cash needed
- —
Loan-product check · same deal, 3 products live
Conventional
25% down · 7.5% · 30yr
- Down + closing
- —
- Monthly P&I
- —
- Monthly cashflow
- —
- DSCR
- —
- Eligible?
- —
Personal DTI + credit; lowest rate.
DSCR
20% down · 8.5% · 30yr
- Down + closing
- —
- Monthly P&I
- —
- Monthly cashflow
- —
- DSCR
- —
- Eligible?
- —
No personal income docs; deal must DSCR.
Hard money
10% down · 12.0% · 12mo
- Down + closing
- —
- Monthly P&I
- —
- Monthly cashflow
- —
- DSCR
- —
- Eligible?
- —
Short-term bridge; refi at stabilization.
Rent comps 4 comps
| Address | Beds | Baths | Sqft | Rent | $/sqft | DOM | Units | Dist |
|---|---|---|---|---|---|---|---|---|
| 10150 Rockland St Lewes, DE | 1.0–3.0 | 1.5–2.5 | 1217 | $3,850 | $3.16 | 44d | 1 | 0.91mi |
| 17054 N Brandt St #1206 Lewes, DE | 2.0 | 2.0 | 1052 | $1,900 | $1.81 | 44d | 1 | 0.99mi |
| 17059 S Brandt St #3206 Lewes, DE | 2.0 | 2.0 | 1052 | $1,850 | $1.76 | 22d | 1 | 0.99mi |
| 36916 Crooked Hammock Way Lewes, DE | 2.0–3.0 | 2.0 | 1172 | $2,250 | $1.92 | 44d | 1 | 1.34mi |
Listing history 4 events
-
2026-06-18days on market $90,000 Active 3 DOM
-
2026-06-17days on market $90,000 Active 2 DOM
-
2026-06-16remarks 699-char remark
-
2026-06-16$90,000 Active 1 DOM
ⓘ Source: listings_history table (triggers on properties + properties_extension) + one-shot
backfill from property_details.listing_events for pre-trigger history.
Climate risk First Street
- Flood 3/10 Moderate FEMA zone X (unshaded) · 12% chance over 30 yrs
- Wildfire 3/10 Moderate
- Heat 8/10 Severe 7 d/yr ≥101°F today · 18 d/yr by 30 yrs out
- Wind 8/10 Severe 80% chance of damaging wind over 30 yrs
- Air quality 2/10 Low 1 unhealthy d/yr today · 1 by 30 yrs out
Nearby sold comps map
Loading sold comps map…
Walkable amenities ~0.75 mi
Loading nearby amenities…
Taxation est. · year 1
- Rental income
- $30,462
- − Mortgage interest
- −$5,041
- − Property taxes
- −$1,350
- − Insurance
- −$450
- − Repairs & maintenance
- −$2,437
- − Management
- −$2,437
- − Depreciation
- −$2,618
- Taxable income
- $16,128
- Est. tax owed @ 24.0%
- −$3,871
- After-tax cash flow
- $12,730/yr
For passive investors: Depreciation is non-cash, so a rental often shows a tax loss while cash-flowing — sheltering income. Rental losses are passive: they offset passive income freely, and up to $25,000/yr can offset ordinary (W-2) income if you actively participate and your MAGI is under $100k (phasing out to $0 by $150k); unused losses carry forward. On sale, claimed depreciation is recaptured at up to 25%, and gains may owe capital-gains tax (a 1031 exchange can defer both). Figures are a year-1 estimate at your 24.0% rate — not tax advice; consult a CPA.
Condition & rehab AI · 12 photos
This 3-bedroom home requires moderate repairs and maintenance to improve its condition and value. Painting the exterior siding and interior walls, along with landscaping, would significantly enhance its curb appeal and overall value.
Repairs flagged
- Minor exterior siding — Some discoloration
- Minor interior walls — Some discoloration
Value-add opportunities
- Resale paint exterior siding — Enhances curb appeal
- Resale paint interior walls — Enhances interior appearance
- Both landscaping — Improves curb appeal and enhances property value
Renovation cost estimate screening
| Repair item | Severity | Est. cost |
|---|---|---|
| exterior siding · Some discoloration | Minor | $500–3,000 |
| interior walls · Some discoloration | Minor | $500–3,000 |
| Total estimated repair cost · 2 items | $1,000–6,000 |
Value-add ROI direction
- Resale paint exterior siding — Enhances curb appeal ↑
- Resale paint interior walls — Enhances interior appearance ↑
- Both landscaping — Improves curb appeal and enhances property value ↑
ⓘ Cost ranges are severity-bucket heuristics (US national rule-of-thumb). Get contractor quotes + a written scope before underwriting a rehab budget.
Schools (NCES district)
- District
- Cape Henlopen School District
- NCES district ID
- 1000170
- Math proficiency
- 42% ▼ -14.00%
- Reading proficiency
- 55% ▼ -10.00%
- Median HH income
- $60,196
- Composite
- 42.47/100
- National rank
- #3214
- State rank
- #5 of 26 in DE
Livability — Lewes
- Score
- 67/100
- State rank
- #40
- US rank
- #11077
Category grades
Schools grade is shown separately in the Schools card above.
Census & demographics
- County
- Sussex County · 82,708 people
- Metro
- Salisbury, MD-DE
- Population (ZIP)
- 31,938
- Household income
- $97,197
- Rent vs Own
- Severe rent burden
- 545.0
Population outlook (Sussex County) Hauer SSP2
- Today (2025)
- 248,853 people
- By 2030
- 264,464 · +6.3%
- By 2040
- 290,980 · +16.9%
- By 2050
- 311,259 · +25.1%
- By 2075
- 352,488 · +41.6%
- By 2100
- 367,406 · +47.6%
Race, ethnicity, and origin ACS 2023
- Neighborhood character
- Predominantly White (88%)
- Race & ethnicity
- White 88% Two or more races 6% Hispanic / Latino 4% Black 2% Asian 2%
- Common ancestry
- Romanian 6% Slovak 3% Italian 2%
- Foreign-born
- 6% · Canada
- Languages at home
- 93% English-only · Spanish 3% Other Indo-European 1% Russian/Polish/Slavic 1%
Political lean MEDSL · Sussex
- 2024 margin
- R (+11.0) · D 43.9% · R 54.9% · Other 1.2%
- 2008→2024 swing
- -2.4pp toward R · 2008: -8.6pp · 2024: -11.0pp
- All cycles
- 2024: R+11.0 2020: R+11.2 2016: R+22.0 2012: R+13.0 2008: R+8.6
Not yet ingested
- Civics
- —
Market trends
- HPI YoY
- ▼ -204.07%
- Current HPI
- 299.0736
- Rent YoY
- ▲ 0.77%
- Metro
- Salisbury, MD-DE
- State GDP YoY
- —
- F500 in state
- 0
Price history
1 event — show timeline
- 2026-06-15 Listed $90,000 BRIGHT MLS
Cash-flow waterfall
monthlySold comps — $/sqft
last 12 mo · ≤1 miLoading sold comps…