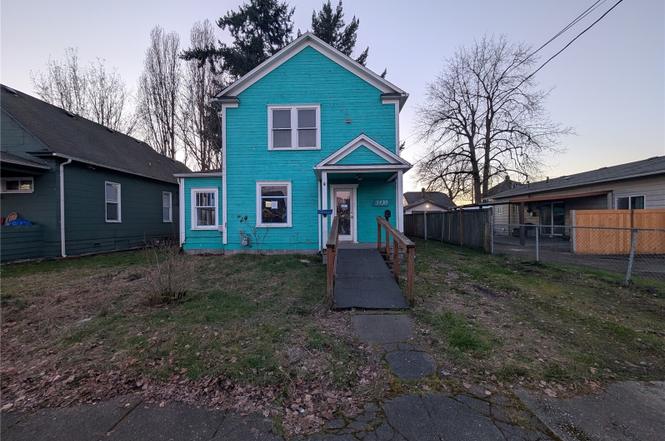
5430 S Birmingham St · Tacoma, WA
Flood risk 1/10 · Minimal
- FEMA flood zone
- X (unshaded)
- Chance of flooding over 30 yrs
- 0.0%
- Est. flood insurance / yr
- $507 – $1,088
Fire risk 1/10 · Minimal
- Est. fire insurance / yr
- $604 – $1,122
Heat risk 3/10 · Minor
- Hot days now (above 86°F)
- 7 days/yr
- Hot days in 30 yrs
- 14 days/yr
Wind risk 1/10 · Minimal
- Chance of severe wind over 30 yrs
- —
Air-quality risk 7/10 · Major
- Unhealthy air days now
- 11 days/yr
- Unhealthy air days in 30 yrs
- 12 days/yr
Risk factors via First Street. Map © Google.
Why this score? — see what drove the C- grade
The composite is a weighted blend of 9 inputs, each scored 0–100. Each bar is that input's sub-score; the figure is the points it added to the 100-point composite (weight × sub-score).
- ARV discount +15.0/15.0
- Cash flow +14.2/30.0
- DSCR +4.3/10.0
- 1% rule +4.2/10.0
- Schools +4.2/10.0
- Livability +3.9/5.0
- Rent growth +3.8/5.0
- Condition / age +2.5/5.0
- Appreciation +0.0/10.0
$231,000
🖨 Deal sheet (PDF) 📄 Offer letter ✓ Due diligence
Listing remarks
Great opportunity in a convenient location close to schools, shopping, and easy freeway access. This 3-bedroom, 2-bath home with a detached garage offers a variety of possibilities for buyers with vision. Situated on a parcel that may offer strong long-term value, the property presents options for renovation, restoration, or other future plans such as redevelopment, subject to buyer verification. Features include classic architectural details and vintage character that may appeal to those looking to preserve its charm. Property is sold as-is. Due to condition, cash, hard money or FHA Rehab type financing is recommended.
Key facts
- Vintage character
- Convenient location
- Detached garage
Tags
Neighborhood map
What this means for you Summary
Snapshot
- This is a 3-bed/1.0-bath single-family listed at $231k.
Deal economics
- At list price, monthly cash flow is $39 ($469/yr) — positive.
- The deal already cash-flows at list — no discount required.
- To meet the 1% rule (rent ≥ 1% of price), the offer needs to be $213k (7.7% below list).
- Recommended offer: $213k (7.7% below list) — sets the bar for 1% rule.
- Cap rate 6.5% vs local median 2.9% in Tacoma — top-decile yield for the area; either an underpriced asset or a hidden risk that comps aren't pricing in. Stress-test before assuming the spread holds.
Location & tenants
- Location reads 78/100 on livability (#127 in WA, #2,535 nationally) — a middle-class / working-renter tenant base. Strengths: amenities A+, commute A+, housing A+; Watch: cost of living D, crime F.
- Tacoma School District (urban): math 40% / reading 53% proficiency, ranked #169 of 291 in WA (top 58%) — families likely to look elsewhere, expect single-tenant / working-renter base with shorter leases.
- Zoned schools: Edison Elementary School (389 students, 72% FRL); Gray Middle School (521 students, 78% FRL); Foss High School (587 students, 71% FRL) — zoned schools average 73% FRL vs 53% district-wide (21 pts higher); higher-poverty schools than district average — tighter screening recommended.
- Market conditions: Rents rising fast (+5.1%/yr); 107 active listings in the ZIP; 40 comparable units currently listed for rent nearby; rentals at typical pace (median 15d on market — plan ~3-4 weeks tenant-placement turnaround); 3,209 units permitted in Pierce County in 2024 (1,269 in 5+ unit buildings).
- This rent runs 35% of the median local income ($73k/yr) — at the standard rent-burdened threshold; future hikes will face affordability resistance.
Forward outlook
- Local home prices are declining (-3.0%/yr); year-one equity from $2k of loan paydown is wiped out by about $7k of value loss. Plan a longer hold.
- Pierce County population projected at +26% by 2050 — long-run rental-demand tailwind backs the buy-and-hold thesis.
Negotiation context
- Only 13 days on market — expect competitive offers; lowballing is unlikely to land.
Risks & watch-outs
- Watch-outs: built in 1908 — expect roof / HVAC / electrical / plumbing capex.
Questions for the listing agent
- Built in 1908 — when were the roof, HVAC, electrical panel, plumbing, and water heater last replaced?
- Is there a deadline driving the sale (1031 exchange, divorce, estate, relocation)? That informs how much negotiation room exists.
- Schools are B-rated — typically a magnet for longer-tenancy family renters. What's the average tenant stay here, and is there a school-zone premium baked into asking?
- Crime grade is F in this area — have there been break-ins, vandalism, or insurance claims at this property in the last 3 years? What carrier currently insures it and at what premium?
- What's the average days-on-market for RENTAL listings here right now (not sales)? A rising rental-DOM trend means longer vacancies and softer asking-rent achievability than the comps imply.
- What's the recent tenant-quality profile in this submarket — average credit score on applications, eviction rate, late-payment / NSF rate, and stable-employment percentage? A property-management company in the area should have these aggregated.
- How much new for-sale + rental construction is in the pipeline within 1–3 miles? Heavy new supply typically softens prices + rents 12–24 months out; constrained supply supports both.
Investment metrics
- 1% rule
- 0.92% ✗
- Cap rate
- 6.50%
- Cash-on-cash
- 0.73%
- DSCR
- 1.03
- GRM
- 9.0
CMA / ARV
- ARV (on-the-fly)
- $454,060
- Comps found
- 12
Show comp detail 12 sales within ~0.75 mi
| Address | Dist | Beds/Ba | Sqft | Sold | Price | $/sf | Match |
|---|---|---|---|---|---|---|---|
| 5430 S Birmingham St | 0.00mi | 3/1.0 | 1,460 (0%) | 1mo | $240,000 | $164 | 100 |
| 5417 S Cedar St | 0.21mi | 3/1.0 | 1,353 (-7%) | 2mo | $430,000 | $318 | 76 |
| 5631 S Puget Sound Ave | 0.15mi | 3/2.5 | 1,508 (+3%) | 8mo | $465,000 | $308 | 75 |
| 5312 S Prospect St | 0.51mi | 3/2.0 | 1,464 (+0%) | 6mo | $445,000 | $304 | 67 |
| 6214 S Warner St | 0.44mi | 2/1.5 (-1) | 1,412 (-3%) | 1mo | $470,000 | $333 | 66 |
| 6621 S Montgomery St | 0.72mi | 3/1.0 | 1,461 (+0%) | 4mo | $420,000 | $287 | 62 |
| 6423 S Montgomery St | 0.60mi | 3/1.5 | 1,337 (-8%) | 3mo | $430,000 | $322 | 53 |
| 6035 S Fife St | 0.60mi | 3/2.0 | 1,362 (-7%) | 6mo | $390,000 | $286 | 52 |
| 5351 S Trafton St | 0.68mi | 3/2.0 | 1,344 (-8%) | 4mo | $485,000 | $361 | 48 |
| 6215 S Fife St | 0.65mi | 4/2.0 (+1) | 1,368 (-6%) | 4mo | $460,000 | $336 | 47 |
| 4912 S Prospect St | 0.62mi | 3/1.5 | 1,658 (+14%) | 2mo | $350,000 | $211 | 44 |
| 4814 S Fife | 0.61mi | 2/2.0 (-1) | 1,282 (-12%) | 4mo | $399,000 | $311 | 39 |
Match score weights: distance 35% · size 25% · config 20% · recency 20%. Top-matched comps best support the ARV.
Projected returns pro-forma
-3.0% appreciation · 5.08% rent growth · sell at horizon
- IRR
- -12.7%
- Equity multiple
- 0.53×
- Total profit
- $-30,324
- Equity at exit
- $34,443
- IRR
- -0.7%
- Equity multiple
- 0.95×
- Total profit
- $-3,442
- Equity at exit
- $19,973
Cash invested: $64,680 (down + closing). Projections, not guarantees.
Landlord ↔ Tenant lean methodology
- Overall (STATE)
- 28 Tenant-Leaning
- State Washington
- 28 Tenant-Leaning · D+8
- County
- — inherits STATE
- City
- — inherits STATE
ZIP-level market 98409
- Rents YoY
- 5.1%
- Active inventory
- 107
- Price-to-rent
- 9.0×
Monthly cashflow live
- Estimated rent
- $2,132 high interval (Pro) →
- Mortgage (P&I)
- −$1,211
- Tax from tax record
- −$338 /mo · $4,052/yr
- Insurance
- −$96
- HOA
- −$0
- Vacancy / Maint / Mgmt
- −$448
- Net cashflow
- $39
Break-even live
Sensitivity live
| Price | -10% $170 | -5% $104 | +0% $39 | +5% $-26 | +10% $-92 |
|---|---|---|---|---|---|
| Rent | -10% $-129 | -5% $-45 | +0% $39 | +5% $123 | +10% $208 |
| Rate | -1.0pp $155 | -0.5pp $98 | base $39 | +0.5pp $-21 | +1.0pp $-82 |
UW: 25.0% down · 7.5% · 30yr · 1.5% tax · 5.0% vac · 8.0% maint · 8.0% mgmt
Financing live
Cash to close
- Down payment
- $57,750
- Closing costs
- $6,930
- Reserves months
- —
- Total cash needed
- —
Loan-product check · same deal, 3 products live
Conventional
25% down · 7.5% · 30yr
- Down + closing
- —
- Monthly P&I
- —
- Monthly cashflow
- —
- DSCR
- —
- Eligible?
- —
Personal DTI + credit; lowest rate.
DSCR
20% down · 8.5% · 30yr
- Down + closing
- —
- Monthly P&I
- —
- Monthly cashflow
- —
- DSCR
- —
- Eligible?
- —
No personal income docs; deal must DSCR.
Hard money
10% down · 12.0% · 12mo
- Down + closing
- —
- Monthly P&I
- —
- Monthly cashflow
- —
- DSCR
- —
- Eligible?
- —
Short-term bridge; refi at stabilization.
Rent comps 40 comps
| Address | Beds | Baths | Sqft | Rent | $/sqft | DOM | Units | Dist |
|---|---|---|---|---|---|---|---|---|
| 4802 S Pine St Tacoma, WA | 2.0 | 1.0–2.0 | 789 | $1,825 | $2.31 | 1d | 8 | 0.50mi |
| 4720 S Pine St Tacoma, WA | 1.0–2.0 | 1.0–2.0 | 829 | $1,805 | $2.18 | 1d | 17 | 0.52mi |
| 4707 S Puget Sound Ave Unit C Tacoma, WA | 2.0 | 1.0 | 1020 | $1,695 | $1.66 | 1d | 1 | 0.52mi |
| 4538 S Warner St Unit A Tacoma, WA | 3.0 | 2.0 | 1181 | $2,185 | $1.85 | 5d | 1 | 0.58mi |
| 3215 S 47th St Tacoma, WA | 1.0–2.0 | 1.0–2.0 | 748 | $1,750 | $2.34 | 1d | 12 | 0.59mi |
| 4536 S Puget Sound Ave Unit A Tacoma, WA | 3.0 | 2.0 | 1234 | $1,895 | $1.54 | 19d | 1 | 0.59mi |
| 3105 S 47th St Tacoma, WA | 2.0 | 1.0 | 751 | $1,715 | $2.28 | 1d | 17 | 0.62mi |
| 5228 S Mason Ave Tacoma, WA | 3.0 | 2.0 | 1001 | $1,881 | $1.88 | 14d | 3 | 0.69mi |
| 4318 S Puget Sound Ave Tacoma, WA | 2.0 | 2.5 | 1150 | $2,250 | $1.96 | 26d | 1 | 0.76mi |
| 4318 S Puget Sound Ave Tacoma, WA | 2.0 | 2.5 | 1190 | $2,189 | $1.84 | 14d | 1 | 0.76mi |
| 4318 S Puget Sound Ave Tacoma, WA | 2.0 | 2.5 | 1190 | $2,200 | $1.85 | 16d | 1 | 0.76mi |
| 4318 S Puget Sound Ave Unit 6B Tacoma, WA | 2.0 | 2.5 | 1150 | $2,189 | $1.90 | 16d | 1 | 0.76mi |
| 2901 S 45th St Tacoma, WA | 2.0–4.0 | 2.5–3.0 | 1374 | $2,895 | $2.11 | 1d | 5 | 0.77mi |
| 4031 S 66th St Tacoma, WA | 3.0 | 2.0 | 1550 | $3,000 | $1.94 | 26d | 1 | 0.80mi |
| 3307 S 43rd St Tacoma, WA | 3.0 | 2.5 | 1372 | $2,850 | $2.08 | 26d | 1 | 0.82mi |
| 6815 S Warner St Tacoma, WA | 3.0 | 1.0 | 1034 | $2,400 | $2.32 | 4d | 1 | 0.83mi |
| 4275 S Pine St Tacoma, WA | 2.0 | 1.0–2.0 | 895 | $2,095 | $2.34 | 0d | 5 | 0.85mi |
| 6601 S Tyler St Unit 13 Tacoma, WA | 2.0 | 1.0 | 880 | $1,300 | $1.48 | 25d | 1 | 0.87mi |
| 5801 S Gove St Tacoma, WA | 3.0 | 2.0 | 1400 | $2,500 | $1.79 | 26d | 1 | 0.88mi |
| 4026 S Pine St Unit 3 Tacoma, WA | 2.0 | 2.5 | 1035 | $1,750 | $1.69 | 9d | 1 | 0.93mi |
| 1770 S 52nd St Tacoma, WA | 2.0 | 2.0 | 1138 | $2,400 | $2.11 | 25d | 1 | 0.96mi |
| 7025 S Puget Sound Ave Tacoma, WA | 3.0 | 1.5 | 1200 | $2,600 | $2.17 | 26d | 1 | 0.97mi |
| 4827 S 56th St #3 Tacoma, WA | 2.0 | 1.5 | 1400 | $1,950 | $1.39 | 9d | 1 | 0.97mi |
| 2424 S 41st St Tacoma, WA | 3.0 | 1.0–3.0 | 928 | $3,100 | $3.34 | 22d | 1 | 1.06mi |
| 6830 Tacoma Mall Blvd Tacoma, WA | 2.0 | 1.0 | 980 | $1,560 | $1.59 | 1d | 2 | 1.07mi |
| 2424 S 41st St Tacoma, WA | 2.0 | 1.0–2.0 | 928 | $2,055 | $2.21 | 1d | 22 | 1.07mi |
| 6841 S Wapato St Tacoma, WA | 3.0 | 2.0 | 1190 | $2,550 | $2.14 | 21d | 1 | 1.08mi |
| 5209 S Orchard St Tacoma, WA | 2.0 | 1.0 | 1500 | $1,800 | $1.20 | 26d | 1 | 1.11mi |
| 5020 S 58th St Apt B Tacoma, WA | 2.0 | 1.0 | 900 | $1,545 | $1.72 | 23d | 1 | 1.11mi |
| 5032 S 58th St Unit D Tacoma, WA | 2.0 | 1.0 | 900 | $1,450 | $1.61 | 9d | 1 | 1.12mi |
| 5031 S Orchard St Unit A Tacoma, WA | 2.0 | 1.0 | 1000 | $1,495 | $1.50 | 26d | 1 | 1.12mi |
| 5205 S Orchard St Unit A University Place, WA | 2.0 | 1.0 | 900 | $1,700 | $1.89 | 26d | 1 | 1.13mi |
| 5701 S Orchard St Tacoma, WA | 1.0–3.0 | 1.0–2.0 | 842 | $1,881 | $2.23 | 9d | 10 | 1.13mi |
| 6217 S Huson St Unit B Tacoma, WA | 2.0 | 1.0 | 940 | $1,695 | $1.80 | 9d | 1 | 1.13mi |
| 4332 S 41st St Tacoma, WA | 1.0–2.0 | 1.0–2.0 | 1025 | $2,080 | $2.03 | 1d | 13 | 1.14mi |
| 5001 S Orchard St Unit C University Place, WA | 2.0 | 1.0 | 912 | $1,495 | $1.64 | 13d | 1 | 1.17mi |
| 3903 S Tyler St Unit 307 Tacoma, WA | 2.0 | 2.0 | 915 | $1,595 | $1.74 | 1d | 1 | 1.19mi |
| 3926 S Tyler St Tacoma, WA | 2.0 | 1.0 | 926 | $1,400 | $1.51 | 26d | 1 | 1.19mi |
| 7245 S Prospect St Tacoma, WA | 3.0 | 1.5 | 1488 | $3,150 | $2.12 | 26d | 1 | 1.27mi |
| 6021 S Orchard St Tacoma, WA | 1.0–3.0 | 1.0–2.0 | 999 | $3,566 | $3.57 | 0d | 90 | 1.28mi |
Listing history 2 events
-
2026-03-12status Pending
-
2026-02-27$231,000 Active
ⓘ Source: listings_history table (triggers on properties + properties_extension) + one-shot
backfill from property_details.listing_events for pre-trigger history.
Tax reassessment forecast WA · Resets to sale price
- Current annual tax
- $4,052 · $338/mo
- Projected year-2 tax
- $4,052 · $338/mo
- Expected delta
- $0/yr ($0/mo · 0.0%)
ⓘ Screening estimate from a state-policy table — verify with the county assessor before closing.
Climate risk First Street
- Flood 1/10 Low FEMA zone X (unshaded) · 0% chance over 30 yrs
- Wildfire 1/10 Low
- Heat 3/10 Moderate 7 d/yr ≥86°F today · 14 d/yr by 30 yrs out
- Wind 1/10 Low
- Air quality 7/10 Severe 11 unhealthy d/yr today · 12 by 30 yrs out
Nearby sold comps map
Loading sold comps map…
Walkable amenities ~0.75 mi
Loading nearby amenities…
Taxation est. · year 1
- Rental income
- $25,587
- − Mortgage interest
- −$12,940
- − Property taxes
- −$4,052
- − Insurance
- −$1,155
- − Repairs & maintenance
- −$2,047
- − Management
- −$2,047
- − Depreciation
- −$6,720
- Taxable loss
- −$3,374
- Est. tax savings @ 24.0%
- +$810
- After-tax cash flow
- $1,279/yr
For passive investors: Depreciation is non-cash, so a rental often shows a tax loss while cash-flowing — sheltering income. Rental losses are passive: they offset passive income freely, and up to $25,000/yr can offset ordinary (W-2) income if you actively participate and your MAGI is under $100k (phasing out to $0 by $150k); unused losses carry forward. On sale, claimed depreciation is recaptured at up to 25%, and gains may owe capital-gains tax (a 1031 exchange can defer both). Figures are a year-1 estimate at your 24.0% rate — not tax advice; consult a CPA.
Schools (NCES district)
- District
- Tacoma School District
- NCES district ID
- 5308700
- Math proficiency
- 40% ▬ 0.00%
- Reading proficiency
- 53% ▲ 1.00%
- Median HH income
- $52,467
- Composite
- 42.25/100
- National rank
- #6987
- State rank
- #169 of 291 in WA
Livability — Tacoma
- Score
- 78/100
- State rank
- #127
- US rank
- #2535
Category grades
Schools grade is shown separately in the Schools card above.
Census & demographics
- Census place
- Tacoma, WA
- County
- Pierce County · 788,257 people
- City population
- 212,935
- Metro
- Seattle-Tacoma-Bellevue, WA
- Population (ZIP)
- 27,843
- Household income
- $73,348
- Rent vs Own
- Severe rent burden
- 2070.0
Population outlook (Pierce County) Hauer SSP2
- Today (2025)
- 956,648 people
- By 2030
- 1,010,862 · +5.7%
- By 2040
- 1,113,170 · +16.4%
- By 2050
- 1,206,524 · +26.1%
- By 2075
- 1,436,425 · +50.2%
- By 2100
- 1,563,654 · +63.5%
Race, ethnicity, and origin ACS 2023
- Neighborhood character
- Highly diverse neighborhood (Simpson 0.71)
- Race & ethnicity
- White 48% Hispanic / Latino 16% Two or more races 15% Black 15% Asian 9% Native American 1% Pacific Islander 1%
- Hispanic origin (detail)
- Mexican 11% Puerto Rican 1%
- Common ancestry
- Portuguese 3% Slovak 2% Italian 2%
- Foreign-born
- 12% · Canada, South Korea, Vietnam
- Languages at home
- 81% English-only · Spanish 9% Korean 3% Tagalog/Filipino 2%
Political lean MEDSL · Pierce
- 2024 margin
- D (+10.8) · D 53.9% · R 43.1% · Other 3.0%
- 2008→2024 swing
- -1.4pp toward R · 2008: 12.2pp · 2024: 10.8pp
- All cycles
- 2024: D+10.8 2020: D+11.2 2016: D+7.5 2012: D+11.0 2008: D+12.2
Not yet ingested
- Civics
- —
Market trends
- HPI YoY
- ▼ -614.20%
- Current HPI
- 355.8056
- Rent YoY
- ▲ 5.08%
- Metro
- Seattle-Tacoma-Bellevue, WA
- State GDP YoY
- ▲ 4.65%
- F500 in state
- 22
Industry mix (Fortune 500 HQ in WA)
| Industry | F500 HQs | Revenue |
|---|---|---|
| Retail | 2 | $269B |
|
||
| Technology / Retail | 1 | $638B |
|
||
| Technology | 1 | $245B |
|
||
| Telecommunications | 1 | $38B |
|
||
| Food / Beverage | 1 | $36B |
|
||
| Automotive / Trucks | 1 | $34B |
|
||
Price history
2 events — show timeline
- 2026-03-12 Pending — NWMLS as Distributed by MLS Grid
- 2026-02-27 Listed $231,000 NWMLS as Distributed by MLS Grid
Property tax history
+13.7%/yrLatest (2026): $4,052 · +894.3% YoY. Source: county tax records.
Cash-flow waterfall
monthlySold comps — $/sqft
last 12 mo · ≤1 miLoading sold comps…