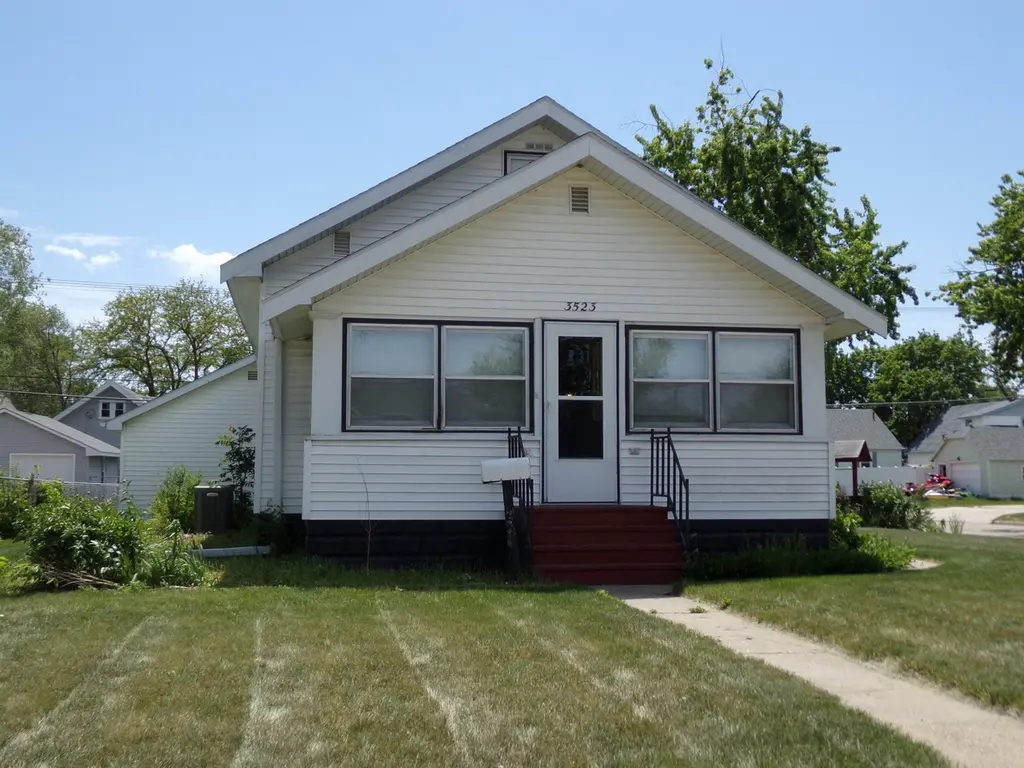
3523 18th St · Columbus, NE
Flood risk 1/10 · Minimal
- FEMA flood zone
- X
- Chance of flooding over 30 yrs
- 0.0%
- Est. flood insurance / yr
- $473 – $860
Fire risk 1/10 · Minimal
- Est. fire insurance / yr
- $1,161 – $2,155
Heat risk 3/10 · Minor
- Hot days now (above 103°F)
- 7 days/yr
- Hot days in 30 yrs
- 16 days/yr
Wind risk 2/10 · Minimal
- Chance of severe wind over 30 yrs
- —
Air-quality risk 1/10 · Minimal
- Unhealthy air days now
- 0 days/yr
- Unhealthy air days in 30 yrs
- 0 days/yr
Risk factors via First Street. Map © Google.
Why this score? — see what drove the C- grade
The composite is a weighted blend of 9 inputs, each scored 0–100. Each bar is that input's sub-score; the figure is the points it added to the 100-point composite (weight × sub-score).
- Cash flow +17.8/30.0
- ARV discount +10.5/15.0
- DSCR +5.6/10.0
- 1% rule +4.6/10.0
- Livability +4.0/5.0
- Schools +3.5/10.0
- Rent growth +2.5/5.0
- Condition / age +2.5/5.0
- Appreciation +0.0/10.0
$180,000
🖨 Deal sheet 📄 Offer letter ✓ Due diligence
Listing remarks
Nice little bungalow ready to be updated to the style you wish. This home features 3 bedrooms 1 bath on a corner lot. It also has an attached 2 car garage and an additional 1 car garage. This home is being sold "AS IS" but it will be cleaned out of the personal belongings.
Key facts
- 5,368 sq ft lot
- 3 garage spots
- Built 1930
Property features AI
Exterior
- Parking: Attached garage with alley access; 3 garage spaces
- Security: Smoke detector(s)
- Utilities: Public water; Public sewer; Electricity available; Natural gas available; Cable available; Phone available
- Home design: Single-family residence; Residential property; R1 zoning
- Construction: Frame construction with vinyl siding; Composition roof; Has basement
- Exterior features: Porch; Paved road access; Publicly maintained road
Interior
- Kitchen: Electric range; Refrigerator; Electric water heater
- Bedrooms: 2 bedrooms on the main level
- Heating & cooling: Forced air heating; Natural gas heating
- Interior features: Storm windows; Window coverings; Partial, partially finished basement; Smoke detector(s)
- Laundry & utility: Laundry in basement
Neighborhood map
What this means for you Summary
Snapshot
- This is a 2-bed/1.0-bath single-family listed at $180k.
Deal economics
- At list price, monthly cash flow is $149 ($2k/yr) — positive.
- The deal already cash-flows at list — no discount required.
- To meet the 1% rule (rent ≥ 1% of price), the offer needs to be $172k (4.3% below list).
- Recommended offer: $172k (4.3% below list) — sets the bar for 1% rule.
- Cap rate 7.3% vs local median 3.3% in Columbus — top-decile yield for the area; either an underpriced asset or a hidden risk that comps aren't pricing in. Stress-test before assuming the spread holds.
Location & tenants
- Location reads 80/100 on livability (#20 in NE, #1,633 nationally) — a professional / high-income tenant draw. Strengths: crime A+, cost of living A+, housing A+; Watch: amenities D-, commute F.
- Columbus Public Schools (town): math 39% / reading 43% proficiency, ranked #93 of 111 in NE (top 84%) — families likely to look elsewhere, expect single-tenant / working-renter base with shorter leases.
- Zoned schools: West Park Elementary (math 27% / reading 42%, grade F, #390 of 502 statewide, top 80%, 262 students, 50% FRL).
- Market conditions: 301 active listings in the ZIP; 7 comparable units currently listed for rent nearby; rentals lingering (median 44d on market — plan ~5-8 weeks vacancy on turnover, expect pricing pressure); 100% of comp listings sitting > 30 days — soft ceiling on asking rent; 98 units permitted in Platte County in 2024 (17 in 5+ unit buildings).
Forward outlook
- Local home prices are declining (-3.0%/yr); year-one equity from $1k of loan paydown is wiped out by about $5k of value loss. Plan a longer hold.
- Platte County population projected at +13% by 2050 — modest demand growth; plan on rents tracking national, not racing it.
Negotiation context
- Only 6 days on market — expect competitive offers; lowballing is unlikely to land.
Risks & watch-outs
- Watch-outs: built in 1930 — expect roof / HVAC / electrical / plumbing capex.
Questions for the listing agent
- Built in 1930 — when were the roof, HVAC, electrical panel, plumbing, and water heater last replaced?
- Is there a deadline driving the sale (1031 exchange, divorce, estate, relocation)? That informs how much negotiation room exists.
- What's the average days-on-market for RENTAL listings here right now (not sales)? A rising rental-DOM trend means longer vacancies and softer asking-rent achievability than the comps imply.
- What's the recent tenant-quality profile in this submarket — average credit score on applications, eviction rate, late-payment / NSF rate, and stable-employment percentage? A property-management company in the area should have these aggregated.
- How much new for-sale + rental construction is in the pipeline within 1–3 miles? Heavy new supply typically softens prices + rents 12–24 months out; constrained supply supports both.
Investment metrics
- 1% rule
- 0.96% ✗
- Cap rate
- 7.29%
- Cash-on-cash
- 3.56%
- DSCR
- 1.16
- GRM
- 8.7
CMA / ARV
- ARV (median comp)
- $192,929
- List price
- $180,000
- Delta
- -6.70%
- Verdict
- FAIR
- Comps
- 20 within 1.0 mi
Show comp detail 12 sales within ~0.75 mi
| Address | Dist | Beds/Ba | Sqft | Sold | Price | $/sf | Match |
|---|---|---|---|---|---|---|---|
| 4110 16th St | 0.36mi | 2/1.0 | 1,500 (+2%) | 1mo | $160,000 | $107 | 79 |
| 4008 15th St | 0.32mi | 2/1.0 | 1,536 (+5%) | 1mo | $125,000 | $81 | 76 |
| 3714 14 St | 0.24mi | 3/1.5 (+1) | 1,489 (+2%) | 4mo | $245,000 | $165 | 76 |
| 3523 18th St | 0.00mi | 3/1.0 (+1) | 1,652 (+13%) | 0mo | $183,000 | $111 | 73 |
| 2154 36th Ave | 0.21mi | 2/1.0 | 1,632 (+12%) | 2mo | $193,000 | $118 | 70 |
| 1772 45th Ave | 0.55mi | 2/2.0 | 1,440 (-2%) | 4mo | $184,800 | $128 | 64 |
| 1665 40th Ave | 0.25mi | 3/1.0 (+1) | 1,297 (-11%) | 3mo | $193,000 | $149 | 62 |
| 1855 45th Ave | 0.53mi | 2/2.0 | 1,600 (+9%) | 2mo | $209,000 | $131 | 54 |
| 1360 35th Ave | 0.27mi | 3/2.0 (+1) | 1,632 (+12%) | 16mo | $170,000 | $104 | 46 |
| 3912 22nd St | 0.37mi | 3/2.0 (+1) | 1,260 (-14%) | 7mo | $275,000 | $218 | 45 |
| 4416 17th St | 0.52mi | 3/2.0 (+1) | 1,680 (+15%) | 12mo | $230,000 | $137 | 32 |
| 1871 25th Ave | 0.73mi | 3/1.0 (+1) | 1,680 (+15%) | 6mo | $140,000 | $83 | 32 |
Match score weights: distance 35% · size 25% · config 20% · recency 20%. Top-matched comps best support the ARV.
Projected returns pro-forma
-3.0% appreciation · 3.0% rent growth · sell at horizon
- IRR
- -10.7%
- Equity multiple
- 0.61×
- Total profit
- $-19,642
- Equity at exit
- $26,839
- IRR
- -1.4%
- Equity multiple
- 0.90×
- Total profit
- $-4,820
- Equity at exit
- $15,563
Cash invested: $50,400 (down + closing). Projections, not guarantees.
Landlord ↔ Tenant lean methodology
- Overall (STATE)
- 83 Strongly Landlord-Friendly
- State Nebraska
- 83 Strongly Landlord-Friendly · R+13
- County
- — inherits STATE
- City
- — inherits STATE
ZIP-level market 68601
- Home prices YoY
- -22.4%
- Active inventory
- 301
- Price-to-rent
- 8.7×
Monthly cashflow live
- Estimated rent
- $1,723 high interval (Pro) →
- Mortgage (P&I)
- −$944
- Tax from tax record
- −$193 /mo · $2,315/yr
- Insurance
- −$75
- HOA
- −$0
- Vacancy / Maint / Mgmt
- −$362
- Net cashflow
- $149
Break-even live
UW: 25.0% down · 7.5% · 30yr · 1.5% tax · 5.0% vac · 8.0% maint · 8.0% mgmt
Financing live
Cash to close
- Down payment
- $45,000
- Closing costs
- $5,400
- Reserves months
- —
- Total cash needed
- —
Loan-product check · same deal, 3 products live
Conventional
25% down · 7.5% · 30yr
- Down + closing
- —
- Monthly P&I
- —
- Monthly cashflow
- —
- DSCR
- —
- Eligible?
- —
Personal DTI + credit; lowest rate.
DSCR
20% down · 8.5% · 30yr
- Down + closing
- —
- Monthly P&I
- —
- Monthly cashflow
- —
- DSCR
- —
- Eligible?
- —
No personal income docs; deal must DSCR.
Hard money
10% down · 12.0% · 12mo
- Down + closing
- —
- Monthly P&I
- —
- Monthly cashflow
- —
- DSCR
- —
- Eligible?
- —
Short-term bridge; refi at stabilization.
Rent comps 7 comps
| Address | Beds | Baths | Sqft | Rent | $/sqft | DOM | Units | Dist |
|---|---|---|---|---|---|---|---|---|
| 1281 37th Ave Columbus, NE | 2.0 | 2.0 | 1250 | $1,850 | $1.48 | 44d | 1 | 0.34mi |
| 3539 43rd Ave Unit 304 Columbus, NE | 2.0 | 2.0 | 1051 | $1,595 | $1.52 | 44d | 1 | 1.11mi |
| 3539 43rd Ave Unit 208 Columbus, NE | 2.0 | 2.0 | 1053 | $1,650 | $1.57 | 44d | 1 | 1.11mi |
| 3539 43rd Ave Unit 202 Columbus, NE | 2.0 | 2.0 | 973 | $1,525 | $1.57 | 44d | 1 | 1.11mi |
| 3539 43rd Ave Unit 106 Columbus, NE | 2.0 | 2.0 | 1053 | $1,750 | $1.66 | 44d | 1 | 1.11mi |
| 3539 43rd Ave Unit 307 Columbus, NE | 2.0 | 1.0 | 903 | $1,425 | $1.58 | 44d | 1 | 1.11mi |
| 3539 43rd Ave Unit 102 Columbus, NE | 2.0 | 2.0 | 1051 | $1,850 | $1.76 | 44d | 1 | 1.11mi |
Listing history 2 events
-
2026-05-18status Pending 283-char remark
-
2026-05-12$180,000 Active 283-char remark
ⓘ Source: listings_history table (triggers on properties + properties_extension) + one-shot
backfill from property_details.listing_events for pre-trigger history.
Tax reassessment forecast NE · Resets to sale price
- Current annual tax
- $2,315 · $193/mo
- Projected year-2 tax
- $3,114 · $260/mo
- Expected delta
- +$799/yr (+$67/mo · 34.5%)
ⓘ Screening estimate from a state-policy table — verify with the county assessor before closing.
Climate risk First Street
- Flood 1/10 Low FEMA zone X · 0% chance over 30 yrs
- Wildfire 1/10 Low
- Heat 3/10 Moderate 7 d/yr ≥103°F today · 16 d/yr by 30 yrs out
- Wind 2/10 Low
- Air quality 1/10 Low 0 unhealthy d/yr today · 0 by 30 yrs out
Nearby sold comps map
Loading sold comps map…
Walkable amenities ~0.75 mi
Loading nearby amenities…
Taxation est. · year 1
- Rental income
- $20,679
- − Mortgage interest
- −$10,083
- − Property taxes
- −$2,315
- − Insurance
- −$900
- − Repairs & maintenance
- −$1,654
- − Management
- −$1,654
- − Depreciation
- −$5,236
- Taxable loss
- −$1,164
- Est. tax savings @ 24.0%
- +$279
- After-tax cash flow
- $2,073/yr
For passive investors: Depreciation is non-cash, so a rental often shows a tax loss while cash-flowing — sheltering income. Rental losses are passive: they offset passive income freely, and up to $25,000/yr can offset ordinary (W-2) income if you actively participate and your MAGI is under $100k (phasing out to $0 by $150k); unused losses carry forward. On sale, claimed depreciation is recaptured at up to 25%, and gains may owe capital-gains tax (a 1031 exchange can defer both). Figures are a year-1 estimate at your 24.0% rate — not tax advice; consult a CPA.
Schools (NCES district)
- District
- Columbus Public Schools
- NCES district ID
- 3105340
- Math proficiency
- 39% ▼ -10.00%
- Reading proficiency
- 43% ▼ -3.00%
- Median HH income
- $51,074
- Composite
- 35.41/100
- National rank
- #4942
- State rank
- #93 of 111 in NE
Livability — Columbus
- Score
- 80/100
- State rank
- #20
- US rank
- #1633
Category grades
Schools grade is shown separately in the Schools card above.
Census & demographics
- Census place
- Columbus, NE
- City population
- 30,619
- Population (ZIP)
- 30,619
Population outlook (Platte County) Hauer SSP2
- Today (2025)
- 34,130 people
- By 2030
- 34,778 · +1.9%
- By 2040
- 36,436 · +6.8%
- By 2050
- 38,648 · +13.2%
- By 2075
- 47,293 · +38.6%
- By 2100
- 57,020 · +67.1%
Race, ethnicity, and origin ACS 2023
- Neighborhood character
- Predominantly White (71%)
- Race & ethnicity
- White 71% Hispanic / Latino 25% Two or more races 14%
- Hispanic origin (detail)
- Mexican 14% Cuban 2%
- Common ancestry
- Romanian 7% Portuguese 2% Lithuanian 1%
- Foreign-born
- 14% · Canada
- Languages at home
- 79% English-only · Spanish 20%
Political lean MEDSL · Platte
- 2024 margin
- Solid R (+58.3) · D 20.4% · R 78.7%
- 2008→2024 swing
- -16.8pp toward R · 2008: -41.5pp · 2024: -58.3pp
- All cycles
- 2024: R+58.3 2020: R+56.8 2016: R+58.8 2012: R+51.8 2008: R+41.5
Not yet ingested
- Civics
- —
Market trends
- HPI YoY
- ▼ -100.37%
- Current HPI
- 347.5063
- Rent YoY
- —
- Metro
- —
- State GDP YoY
- ▲ 0.68%
- F500 in state
- 2
Industry mix (Fortune 500 HQ in NE)
| Industry | F500 HQs | Revenue |
|---|---|---|
| Conglomerate | 1 | $371B |
|
||
Price history
+4.8% since first listed4 events — show timeline
- 2026-06-05 Sold (Public Records) $188,693 Public Records
- 2026-06-04 Sold (MLS) $183,000 CBOR
- 2026-05-18 Pending — CBOR
- 2026-05-12 Listed $180,000 CBOR
Property tax history
+4.0%/yrLatest (2025): $2,315 · +16.5% YoY. Source: county tax records.
Cash-flow waterfall
monthlySold comps — $/sqft
last 12 mo · ≤1 miLoading sold comps…