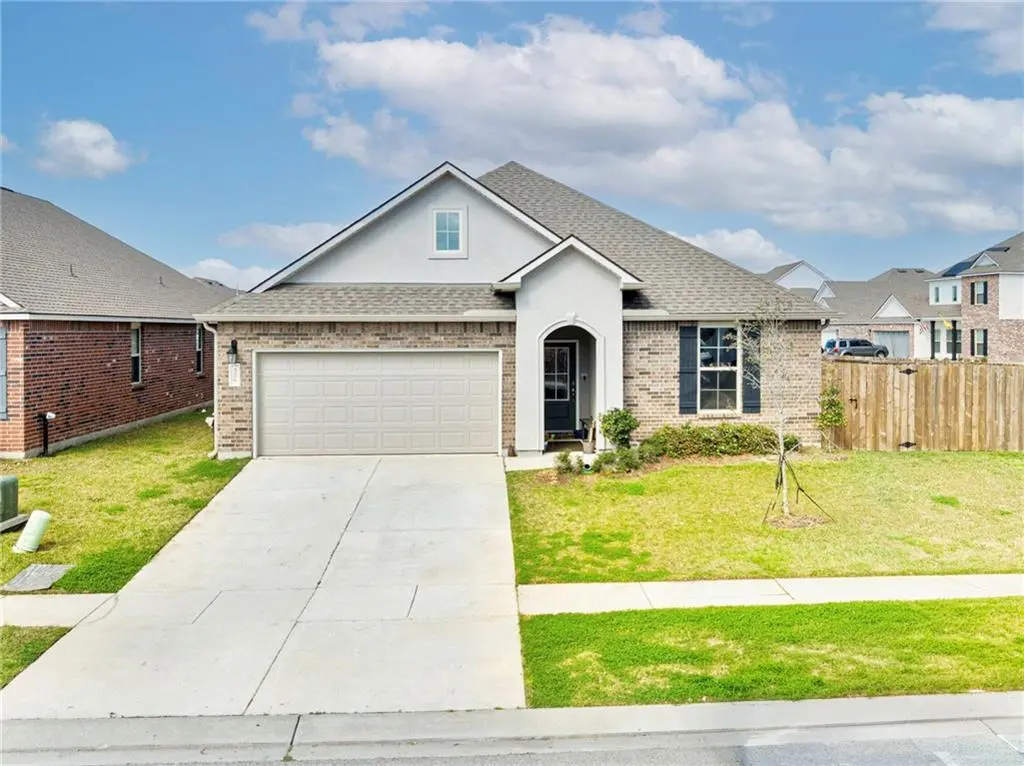
5206 Summer Pecan Dr · Slidell, LA
Flood risk No data
- FEMA flood zone
- —
- Chance of flooding over 30 yrs
- —
- Est. flood insurance / yr
- —
Fire risk No data
- Est. fire insurance / yr
- —
Heat risk No data
- Hot days now (above threshold)
- —
- Hot days in 30 yrs
- —
Wind risk No data
- Chance of severe wind over 30 yrs
- —
Air-quality risk No data
- Unhealthy air days now
- —
- Unhealthy air days in 30 yrs
- —
Risk factors via First Street. Map © Google.
Why this score? — see what drove the D grade
The composite is a weighted blend of 9 inputs, each scored 0–100. Each bar is that input's sub-score; the figure is the points it added to the 100-point composite (weight × sub-score).
- Cash flow +10.8/30.0
- ARV discount +10.2/15.0
- Schools +4.3/10.0
- Condition / age +4.0/5.0
- 1% rule +3.5/10.0
- Livability +3.5/5.0
- DSCR +3.1/10.0
- Rent growth +2.9/5.0
- Appreciation +0.0/10.0
$279,000
🖨 Deal sheet (PDF) 📄 Offer letter ✓ Due diligence
Listing remarks MLS
4 bed, 2 bath home built in 2023 in Lakeshore Villages, Slidell. Open layout with laminate flooring in main areas and carpet in bedrooms. Tinted windows throughout for added privacy and efficiency. Updated primary bathroom with granite countertops, marble shower, and added shelving. Fully fenced backyard. Some amenities include a community pool, fitness center, and basketball goals. Move-in ready
Key facts
- Laminate flooring
- Community pool
- Marble shower
Tags
Neighborhood map
What this means for you Summary
Snapshot
- This is a 4-bed/2.0-bath single-family listed at $279k. Condition is rated good.
Deal economics
- At list price, monthly cash flow is $-130 ($-2k/yr) — negative.
- To cash-flow at today's rent, offer at most $256k (8.2% below list).
- To meet the 1% rule (rent ≥ 1% of price), the offer needs to be $238k (14.8% below list).
- Recommended offer: $238k (14.8% below list) — sets the bar for 1% rule.
Location & tenants
- Location reads 70/100 on livability (#57 in LA) — a middle-class / working-renter tenant base. Strengths: cost of living A+, housing A+, health & safety A+; Watch: amenities F, commute F.
- St. Tammany Parish (suburban): math 43% / reading 55% proficiency, ranked #11 of 98 in LA (top 11%) — families likely to look elsewhere, expect single-tenant / working-renter base with shorter leases.
- Zoned schools: W.L. Abney Elementary School (math 31% / reading 38%, grade F, #284 of 646 statewide, top 46%, 1,094 students, 70% FRL); St. Tammany Junior High School (math 19% / reading 41%, grade F, #114 of 218 statewide, top 53%, 793 students, 68% FRL); Salmen High School (math 15% / reading 27%, grade F, #179 of 265 statewide, top 68%, 1,216 students, 62% FRL) — zoned schools average 67% FRL vs 40% district-wide (27 pts higher); higher-poverty schools than district average — tighter screening recommended.
- Zoned-school proficiency averages 28% at this address vs 49% district-wide (-20 pts) — the specific schools serving this property underperform the St. Tammany Parish average; the district grade overstates school quality for this exact location.
- Market conditions: Rents rising (+1.7%/yr); 594 active listings in the ZIP; 21 comparable units currently listed for rent nearby; rentals at typical pace (median 19d on market — plan ~3-4 weeks tenant-placement turnaround); solid renter incomes; 1,064 units permitted in St. Tammany Parish in 2024 (0 in 5+ unit buildings).
- This rent runs 32% of the median local income ($89k/yr) — at the standard rent-burdened threshold; future hikes will face affordability resistance.
Forward outlook
- Local home prices are declining (-3.0%/yr); year-one equity from $2k of loan paydown is wiped out by about $8k of value loss. Plan a longer hold.
- St. Tammany County population projected at +27% by 2050 — long-run rental-demand tailwind backs the buy-and-hold thesis.
Negotiation context
- It's been on market 95 days — a 9% lower offer ($254k) is reasonable based on typical stale-listing flexibility.
- 3 sale attempts since 3y ago with the ask held roughly flat each time — persistent listings suggest the price (not the market) is what's stuck; bring a comps-based counter.
Questions for the listing agent
- What do current leases actually rent for vs. the listed asking? Can we see a recent rent roll and the last 12 months of T-12 income?
- It's been on market 95 days. Have you received any prior offers? Is the seller open to a 15% concession, seller financing, or rate buy-down credit?
- What does the HOA fee cover, when was the last increase, and are there any pending special assessments or reserve-fund shortfalls?
- Why hasn't it sold? Are there any deal-killer items the seller is aware of (foundation, flood, title, zoning, code violations)?
- Is there a deadline driving the sale (1031 exchange, divorce, estate, relocation)? That informs how much negotiation room exists.
- Schools are B-rated — typically a magnet for longer-tenancy family renters. What's the average tenant stay here, and is there a school-zone premium baked into asking?
- The area grade is low — what's the realistic commute time and amenity access for the typical tenant pool here? Any planned neighborhood developments (good or bad) we should know about?
- What's the average days-on-market for RENTAL listings here right now (not sales)? A rising rental-DOM trend means longer vacancies and softer asking-rent achievability than the comps imply.
- What's the recent tenant-quality profile in this submarket — average credit score on applications, eviction rate, late-payment / NSF rate, and stable-employment percentage? A property-management company in the area should have these aggregated.
- How much new for-sale + rental construction is in the pipeline within 1–3 miles? Heavy new supply typically softens prices + rents 12–24 months out; constrained supply supports both.
Investment metrics
- 1% rule
- 0.85% ✗
- Cap rate
- 5.73%
- Cash-on-cash
- -2.00%
- DSCR
- 0.91
- GRM
- 9.8
CMA / ARV
- ARV (median comp)
- $296,777
- List price
- $279,000
- Delta
- -5.99%
- Verdict
- FAIR
- Comps
- 20 within 1.0 mi
Show comp detail 12 sales within ~0.75 mi
| Address | Dist | Beds/Ba | Sqft | Sold | Price | $/sf | Match |
|---|---|---|---|---|---|---|---|
| 5164 Spillway Manor Dr | 0.23mi | 4/2.0 | 1,819 (-1%) | 1mo | $273,900 | $151 | 87 |
| 5169 Spillway Manor Dr | 0.25mi | 4/2.0 | 1,819 (-1%) | 1mo | $273,900 | $151 | 86 |
| 3311 Tide Wind Dr | 0.22mi | 4/2.0 | 2,051 (+12%) | 1mo | $297,900 | $145 | 69 |
| 5161 Spillway Manor Dr | 0.24mi | 4/2.0 | 2,051 (+12%) | 2mo | $283,900 | $138 | 68 |
| 5132 Spillway Manor Dr | 0.19mi | 5/3.0 (+1) | 2,016 (+10%) | 1mo | $296,795 | $147 | 64 |
| 5144 Spillway Manor Dr | 0.20mi | 4/2.0 | 1,562 (-15%) | 2mo | $259,900 | $166 | 64 |
| 5152 Spillway Manor Dr | 0.21mi | 5/3.0 (+1) | 2,016 (+10%) | 3mo | $294,900 | $146 | 63 |
| 120 Lakeshore Village St S | 0.36mi | 4/2.0 | 2,111 (+15%) | 2mo | $295,000 | $140 | 57 |
| 5449 Fornea Glen Way | 0.68mi | 3/2.5 (-1) | 1,776 (-3%) | 2mo | $274,900 | $155 | 54 |
| 5441 Fornea Glen Way | 0.68mi | 4/2.0 | 1,612 (-12%) | 1mo | $249,900 | $155 | 47 |
| 5472 Fornea Glen Way | 0.68mi | 4/2.0 | 1,612 (-12%) | 2mo | $256,005 | $159 | 46 |
| 5444 Fornea Glen Way | 0.68mi | 4/3.0 | 2,038 (+11%) | 2mo | $302,000 | $148 | 44 |
Match score weights: distance 35% · size 25% · config 20% · recency 20%. Top-matched comps best support the ARV.
Projected returns pro-forma
-3.0% appreciation · 1.72% rent growth · sell at horizon
- IRR
- -21.1%
- Equity multiple
- 0.28×
- Total profit
- $-56,424
- Equity at exit
- $41,600
- IRR
- -17.8%
- Equity multiple
- 0.08×
- Total profit
- $-71,534
- Equity at exit
- $24,123
Cash invested: $78,120 (down + closing). Projections, not guarantees.
Landlord ↔ Tenant lean methodology
- Overall (STATE)
- 90 Strongly Landlord-Friendly
- State Louisiana
- 90 Strongly Landlord-Friendly · R+12
- County
- — inherits STATE
- City
- — inherits STATE
ZIP-level market 70461
- Home prices YoY
- -33.0%
- Rents YoY
- 1.7%
- Active inventory
- 594
- Price-to-rent
- 9.8×
Monthly cashflow live
- Estimated rent
- $2,377 high interval (Pro) →
- Mortgage (P&I)
- −$1,463
- Tax from tax record
- −$370 /mo · $4,444/yr
- Insurance
- −$116
- HOA
- −$58
- Vacancy / Maint / Mgmt
- −$499
- Net cashflow
- $-130
Break-even live
Sensitivity live
| Price | -10% $28 | -5% $-51 | +0% $-130 | +5% $-209 | +10% $-288 |
|---|---|---|---|---|---|
| Rent | -10% $-318 | -5% $-224 | +0% $-130 | +5% $-36 | +10% $58 |
| Rate | -1.0pp $11 | -0.5pp $-59 | base $-130 | +0.5pp $-202 | +1.0pp $-276 |
UW: 25.0% down · 7.5% · 30yr · 1.5% tax · 5.0% vac · 8.0% maint · 8.0% mgmt
Financing live
Cash to close
- Down payment
- $69,750
- Closing costs
- $8,370
- Reserves months
- —
- Total cash needed
- —
Loan-product check · same deal, 3 products live
Conventional
25% down · 7.5% · 30yr
- Down + closing
- —
- Monthly P&I
- —
- Monthly cashflow
- —
- DSCR
- —
- Eligible?
- —
Personal DTI + credit; lowest rate.
DSCR
20% down · 8.5% · 30yr
- Down + closing
- —
- Monthly P&I
- —
- Monthly cashflow
- —
- DSCR
- —
- Eligible?
- —
No personal income docs; deal must DSCR.
Hard money
10% down · 12.0% · 12mo
- Down + closing
- —
- Monthly P&I
- —
- Monthly cashflow
- —
- DSCR
- —
- Eligible?
- —
Short-term bridge; refi at stabilization.
Rent comps 21 comps
| Address | Beds | Baths | Sqft | Rent | $/sqft | DOM | Units | Dist |
|---|---|---|---|---|---|---|---|---|
| 5225 Summer Pecan Rd Slidell, LA | 4.0 | 2.0 | 2079 | $2,300 | $1.11 | 25d | 1 | 0.08mi |
| 5265 Summer Pecan Rd Slidell, LA | 4.0 | 2.0 | 1647 | $2,300 | $1.40 | 4d | 1 | 0.17mi |
| 3604 Spruce Key Ln Slidell, LA | 3.0–4.0 | 2.0 | 1539 | $2,610 | $1.70 | 46d | 1 | 0.20mi |
| 3604 Spruce Key Ln Slidell, LA | 3.0–4.0 | 2.0 | 1586 | $2,510 | $1.58 | 3d | 14 | 0.20mi |
| 3616 Spruce Key Ln Slidell, LA | 3.0 | 2.0 | 1635 | $2,395 | $1.46 | 3d | 1 | 0.22mi |
| 301 Lakeshore Blvd N Slidell, LA | 1.0–4.0 | 1.0–2.0 | 1134 | $1,699 | $1.50 | 3d | 1 | 0.56mi |
| 109 Oak Landing Ln Slidell, LA | 4.0 | 2.0 | 1884 | $2,350 | $1.25 | 19d | 1 | 0.61mi |
| 5916 Honey Glade Rd Slidell, LA | 4.0 | 2.0 | 2290 | $2,600 | $1.14 | 19d | 1 | 0.62mi |
| 408 Lakeshore Vlg E Slidell, LA | 3.0 | 2.0 | 1785 | $2,395 | $1.34 | 13d | 1 | 0.65mi |
| 479 Lakeshore Vlg E Slidell, LA | 4.0 | 2.0 | 1893 | $2,400 | $1.27 | 25d | 1 | 0.65mi |
| 5169 Clarkston Grove Dr Slidell, LA | 4.0 | 3.0 | 2107 | $2,250 | $1.07 | 19d | 1 | 0.66mi |
| 5579 Grand Springs Rd Slidell, LA | 4.0 | 2.0 | 1867 | $2,200 | $1.18 | 45d | 1 | 0.69mi |
| 7535 1st Lake Dr Slidell, LA | 3.0 | 2.0 | 1564 | $2,195 | $1.40 | 19d | 1 | 0.82mi |
| 289 Grand Isle Ct Slidell, LA | 4.0 | 2.0 | 1980 | $2,300 | $1.16 | 25d | 1 | 0.84mi |
| 289 Grand Isle Ct Slidell, LA | 4.0 | 2.0 | 1980 | $2,300 | $1.16 | 45d | 1 | 0.84mi |
| 3635 Trestle Crossing Ave Slidell, LA | 4.0 | 3.0 | 2208 | $2,600 | $1.18 | 45d | 1 | 0.87mi |
| 713 Lakeshore Vlg E Slidell, LA | 3.0 | 2.0 | 1563 | $2,100 | $1.34 | 45d | 1 | 0.98mi |
| 25 Oak Tree Dr Slidell, LA | 4.0 | 2.5 | 2530 | $2,900 | $1.15 | 3d | 1 | 1.19mi |
| 200 Long St Slidell, LA | 2.0–4.0 | 2.0 | 1112 | $1,539 | $1.38 | 3d | 1 | 1.29mi |
| 870 Marina Dr Unit B Slidell, LA | 3.0 | 2.5 | 1700 | $2,000 | $1.18 | 45d | 1 | 1.41mi |
| 870 Marina Dr Unit A Slidell, LA | 3.0 | 2.5 | 1600 | $1,950 | $1.22 | 5d | 1 | 1.42mi |
HOA detail
- Monthly dues
- $58 · $696/yr
- Likely covers
- poolgym
Listing history 17 events
-
2026-06-21days on market $279,000 Active 95 DOM
-
2026-06-18days on market $279,000 Active 92 DOM
-
2026-06-17days on market $279,000 Active 91 DOM
-
2026-06-16days on market $279,000 Active 90 DOM
-
2026-06-15days on market $279,000 Active 89 DOM
-
2026-06-13days on market $279,000 Active 87 DOM
-
2026-06-10days on market $279,000 Active 84 DOM
-
2026-06-09days on market $279,000 Active 83 DOM
-
2026-06-08days on market $279,000 Active 82 DOM
-
2026-06-07days on market $279,000 Active 81 DOM
-
2026-06-03days on market $279,000 Active 77 DOM
-
2026-06-02days on market $279,000 Active 76 DOM
-
2026-06-01days on market $279,000 Active 75 DOM
-
2026-05-31days on market $279,000 Active 74 DOM
-
2026-03-18$289,000 Active 399-char remark
Show marketing remark (399 chars)
4 bed, 2 bath home built in 2023 in Lakeshore Villages, Slidell. Open layout with laminate flooring in main areas and carpet in bedrooms. Tinted windows throughout for added privacy and efficiency. Updated primary bathroom with granite countertops, marble shower, and added shelving. Fully fenced backyard. Some amenities include a community pool, fitness center, and basketball goals. Move-in ready
-
2023-05-17$269,900
ⓘ Source: listings_history table (triggers on properties + properties_extension) + one-shot
backfill from property_details.listing_events for pre-trigger history.
Tax reassessment forecast LA · Resets to sale price
- Current annual tax
- $4,444 · $370/mo
- Projected year-2 tax
- $4,444 · $370/mo
- Expected delta
- $0/yr ($0/mo · 0.0%)
ⓘ Screening estimate from a state-policy table — verify with the county assessor before closing.
Nearby sold comps map
Loading sold comps map…
Walkable amenities ~0.75 mi
Loading nearby amenities…
Taxation est. · year 1
- Rental income
- $28,523
- − Mortgage interest
- −$15,628
- − Property taxes
- −$4,444
- − Insurance
- −$1,395
- − Repairs & maintenance
- −$2,282
- − Management
- −$2,282
- − HOA
- −$696
- − Depreciation
- −$8,116
- Taxable loss
- −$6,321
- Est. tax savings @ 24.0%
- +$1,517
- After-tax cash flow
- $-42/yr
For passive investors: Depreciation is non-cash, so a rental often shows a tax loss while cash-flowing — sheltering income. Rental losses are passive: they offset passive income freely, and up to $25,000/yr can offset ordinary (W-2) income if you actively participate and your MAGI is under $100k (phasing out to $0 by $150k); unused losses carry forward. On sale, claimed depreciation is recaptured at up to 25%, and gains may owe capital-gains tax (a 1031 exchange can defer both). Figures are a year-1 estimate at your 24.0% rate — not tax advice; consult a CPA.
Condition & rehab AI · 12 photos
This move-in ready home in Lakeshore Villages, Slidell, features a modern kitchen, updated bathrooms, and a fully fenced backyard. It offers a good condition with minimal repairs needed, making it an attractive option for both buyers and renters.
Value-add opportunities
- Both Painting exterior and interior walls — Fresh paint can enhance curb appeal and interior aesthetics.
- Both Landscaping improvements — Enhanced landscaping can improve curb appeal and attract potential buyers/tenants.
- Both New flooring in bedrooms — Replacing carpet with hardwood or tile can increase both resale and rental value.
- Both Upgrading kitchen appliances — Modernizing the kitchen can attract more buyers/tenants and increase value.
- Both Adding smart home features — Smart home features can increase convenience and attract tech-savvy buyers/tenants.
- Both Upgrading lighting fixtures — Modern lighting can enhance the home's ambiance and increase its appeal.
- Both Adding a smart thermostat — A smart thermostat can improve energy efficiency and attract eco-conscious buyers/tenants.
Renovation cost estimate screening
Value-add ROI direction
- Both Painting exterior and interior walls — Fresh paint can enhance curb appeal and interior aesthetics. ↑
- Both Landscaping improvements — Enhanced landscaping can improve curb appeal and attract potential buyers/tenants. ↑
- Both New flooring in bedrooms — Replacing carpet with hardwood or tile can increase both resale and rental value. ↑
- Both Upgrading kitchen appliances — Modernizing the kitchen can attract more buyers/tenants and increase value. ↑
- Both Adding smart home features — Smart home features can increase convenience and attract tech-savvy buyers/tenants. ↑
- Both Upgrading lighting fixtures — Modern lighting can enhance the home's ambiance and increase its appeal. ↑
- Both Adding a smart thermostat — A smart thermostat can improve energy efficiency and attract eco-conscious buyers/tenants. ↑
ⓘ Cost ranges are severity-bucket heuristics (US national rule-of-thumb). Get contractor quotes + a written scope before underwriting a rehab budget.
Schools (NCES district)
- District
- St. Tammany Parish
- NCES district ID
- 2201650
- Math proficiency
- 43% ▼ -32.00%
- Reading proficiency
- 55% ▼ -26.00%
- Median HH income
- $61,752
- Composite
- 43.04/100
- National rank
- #3098
- State rank
- #11 of 98 in LA
Livability — Slidell
- Score
- 70/100
- State rank
- #57
- US rank
- #7673
Category grades
Schools grade is shown separately in the Schools card above.
Census & demographics
- County
- Saint Tammany Parish · 228,296 people
- City population
- 95,511
- Metro
- New Orleans-Metairie, LA
- Population (ZIP)
- 34,808
- Household income
- $89,003
- Rent vs Own
- Severe rent burden
- 328.0
Population outlook (St. Tammany County) Hauer SSP2
- Today (2025)
- 286,725 people
- By 2030
- 304,175 · +6.1%
- By 2040
- 336,203 · +17.3%
- By 2050
- 364,590 · +27.2%
- By 2075
- 433,362 · +51.1%
- By 2100
- 470,333 · +64.0%
Race, ethnicity, and origin ACS 2023
- Neighborhood character
- Diverse neighborhood (Simpson 0.63)
- Race & ethnicity
- White 55% Black 24% Two or more races 14% Hispanic / Latino 11% Asian 3%
- Hispanic origin (detail)
- Common ancestry
- Lithuanian 9% Italian 1% Romanian 1%
- Foreign-born
- 8% · Canada, China, Vietnam
- Languages at home
- 89% English-only · Spanish 7% Chinese 1% Vietnamese 1%
Political lean MEDSL · St. Tammany
- 2024 margin
- Solid R (+43.8) · D 27.3% · R 71.1% · Other 1.6%
- 2008→2024 swing
- +9.6pp toward D · 2008: -53.4pp · 2024: -43.8pp
- All cycles
- 2024: R+43.8 2020: R+44.2 2016: R+50.8 2012: R+52.2 2008: R+53.4
Not yet ingested
- Civics
- —
Market trends
- HPI YoY
- ▼ -74.47%
- Current HPI
- 151.3353
- Rent YoY
- ▲ 1.72%
- Metro
- New Orleans-Metairie, LA
- State GDP YoY
- ▲ 3.29%
- F500 in state
- 10
Industry mix (Fortune 500 HQ in LA)
| Industry | F500 HQs | Revenue |
|---|---|---|
| Telecommunications | 2 | $23B |
|
||
| Utilities | 1 | $12B |
|
||
| Wholesale / Distribution | 1 | $5B |
|
||
| Advertising | 1 | $2B |
|
||
Price history
+7.1% since first listed3 events — show timeline
- 2026-03-18 Listed $289,000 AcadianaMLS
- 2026-03-18 Listed $289,000 GSREIN
- 2023-05-17 Listed $269,900 AcadianaMLS
Property tax history
+5.1%/yrLatest (2025): $4,444 · -2.3% YoY. Source: county tax records.
Cash-flow waterfall
monthlySold comps — $/sqft
last 12 mo · ≤1 miLoading sold comps…