 Multi-family
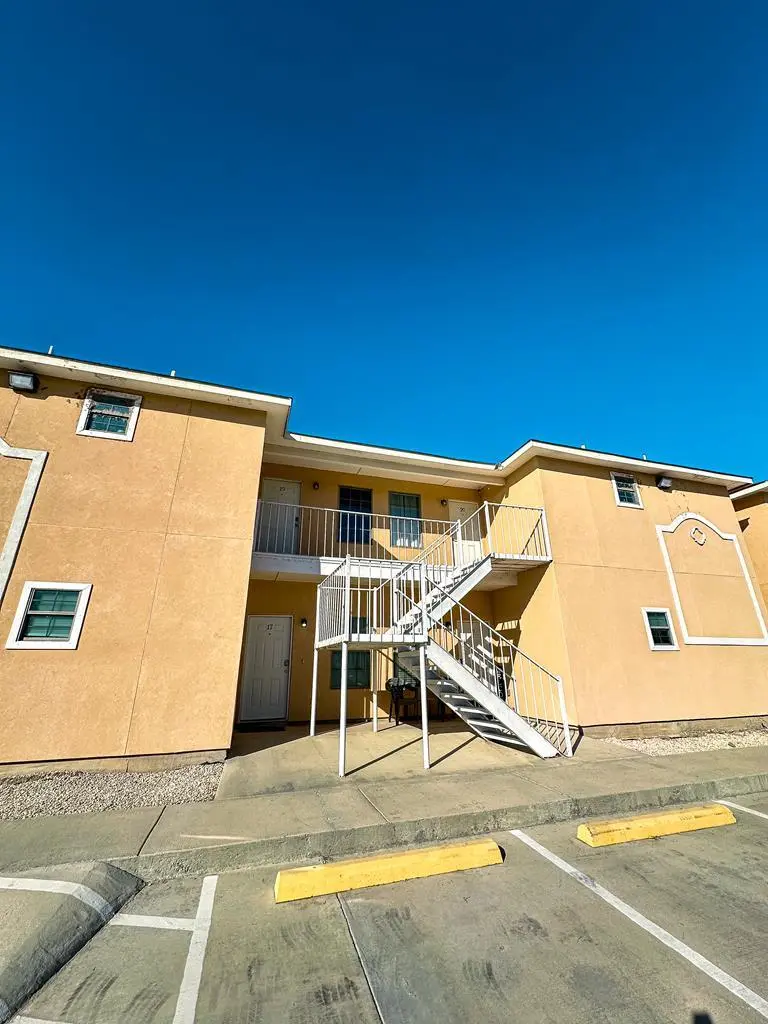
391 Riverside Dr · Rosita, TX
Flood risk No data
- FEMA flood zone
- —
- Chance of flooding over 30 yrs
- —
- Est. flood insurance / yr
- —
Fire risk No data
- Est. fire insurance / yr
- —
Heat risk No data
- Hot days now (above threshold)
- —
- Hot days in 30 yrs
- —
Wind risk No data
- Chance of severe wind over 30 yrs
- —
Air-quality risk No data
- Unhealthy air days now
- —
- Unhealthy air days in 30 yrs
- —
Risk factors via First Street. Map © Google.
Why this score? — see what drove the C grade
The composite is a weighted blend of 9 inputs, each scored 0–100. Each bar is that input's sub-score; the figure is the points it added to the 100-point composite (weight × sub-score).
- Cash flow +25.6/30.0
- DSCR +8.5/10.0
- ARV discount +7.5/15.0
- 1% rule +6.7/10.0
- Livability +3.0/5.0
- Rent growth +2.5/5.0
- Condition / age +2.5/5.0
- Schools +1.7/10.0
- Appreciation +0.0/10.0
$160,000
🖨 Deal sheet 📄 Offer letter ✓ Due diligence
Multi-family units
County records classify this as Multi-Family (2-4 Unit). Listing-text estimate: 1 unit. estimate disagrees with records
Listing remarks
Original MLS#: 83092; Age Range: 6-10 Yrs; Apx Bsmt SqFt: 0; Apx Lot Size SqFt: 12460.00; Family Room/Den: Hard Surface; Living Room: Hard Surface; Misc Exterior: Fenced; Qualify: No
Key facts
- Hard surface
- Fenced
- 3,606 sq ft lot
Tags
Neighborhood map
What this means for you Summary
Snapshot
- This is a 2-bed/2.0-bath multifamily listed at $160k.
Deal economics
- At list price, monthly cash flow is $379 ($5k/yr) — positive.
- The deal already cash-flows at list — no discount required.
- Meets the 1% rule at list price ($2k rent vs $160k).
- Cap rate 9.1% vs local median 2.6% in Rosita — top-decile yield for the area; either an underpriced asset or a hidden risk that comps aren't pricing in. Stress-test before assuming the spread holds.
Location & tenants
- Location reads 59/100 on livability (#1,119 in TX) — a working-class tenant base; expect higher turnover. Strengths: cost of living A+, housing A+; Watch: health & safety C-, schools F, amenities F.
- Eagle Pass ISD (town): math 15% / reading 28% proficiency, ranked #774 of 826 in TX (top 94%) — low school quality limits family demand, transient renter base, plan for 1-2y turnover.
- Market conditions: 461 active listings in the ZIP; 66 units permitted in Maverick County in 2024 (0 in 5+ unit buildings).
- At $1,879/mo this rent would consume 45% of the median local household income ($50k/yr) (locally 822% of renters already pay >50% of income on rent) — very limited rent-growth headroom before tenants either downsize or default.
Forward outlook
- Local home prices are declining (-3.0%/yr); year-one equity from $1k of loan paydown is wiped out by about $5k of value loss. Plan a longer hold.
- Maverick County population projected at +18% by 2050 — long-run rental-demand tailwind backs the buy-and-hold thesis.
Negotiation context
- Only 11 days on market — expect competitive offers; lowballing is unlikely to land.
- 3 sale attempts since 12y ago with the ask held roughly flat each time — persistent listings suggest the price (not the market) is what's stuck; bring a comps-based counter.
Questions for the listing agent
- Is there a deadline driving the sale (1031 exchange, divorce, estate, relocation)? That informs how much negotiation room exists.
- Schools are F-rated, which usually means shorter tenancies and higher turnover. Who's the typical renter profile here, and what's been the actual vacancy rate?
- What's the average days-on-market for RENTAL listings here right now (not sales)? A rising rental-DOM trend means longer vacancies and softer asking-rent achievability than the comps imply.
- What's the recent tenant-quality profile in this submarket — average credit score on applications, eviction rate, late-payment / NSF rate, and stable-employment percentage? A property-management company in the area should have these aggregated.
- How much new apartment / multifamily construction is in the pipeline within 1–3 miles? Heavy new supply (>2% of stock underway) typically softens rents 12–24 months out; light construction supports rent growth.
Investment metrics
- 1% rule
- 1.17% ✓
- Cap rate
- 9.13%
- Cash-on-cash
- 10.14%
- DSCR
- 1.45
- GRM
- 7.1
CMA / ARV
No comps found within radius.
Projected returns pro-forma
-3.0% appreciation · 3.0% rent growth · sell at horizon
- IRR
- -1.0%
- Equity multiple
- 0.96×
- Total profit
- $-1,780
- Equity at exit
- $23,857
- IRR
- 8.6%
- Equity multiple
- 1.66×
- Total profit
- $29,622
- Equity at exit
- $13,834
Cash invested: $44,800 (down + closing). Projections, not guarantees.
Landlord ↔ Tenant lean methodology
- Overall (STATE)
- 87 Strongly Landlord-Friendly
- State Texas
- 87 Strongly Landlord-Friendly · R+5
- County
- — inherits STATE
- City
- — inherits STATE
ZIP-level market 78852
- Home prices YoY
- -27.5%
- Active inventory
- 461
- Price-to-rent
- 14.2×
Monthly cashflow live
- Estimated rent
- $1,879 medium interval (Pro) →
- Mortgage (P&I)
- −$839
- Tax est. 1.5%
- −$200 /mo · $2,400/yr
- Insurance
- −$67
- HOA
- −$0
- Vacancy / Maint / Mgmt
- −$395
- Net cashflow
- $379
Break-even live
2-unit breakdown (identical units grouped — click to expand)
| Units | Beds | Baths | Est. rent |
|---|---|---|---|
| 2× units | 2 | 1 | $1,878 |
| #1 | 2 | 1 | $939 |
| #2 | 2 | 1 | $939 |
| Total (2 units) | $1,879 | ||
UW: 25.0% down · 7.5% · 30yr · 1.5% tax · 5.0% vac · 8.0% maint · 8.0% mgmt
Financing live
Cash to close
- Down payment
- $40,000
- Closing costs
- $4,800
- Reserves months
- —
- Total cash needed
- —
Loan-product check · same deal, 3 products live
Conventional
25% down · 7.5% · 30yr
- Down + closing
- —
- Monthly P&I
- —
- Monthly cashflow
- —
- DSCR
- —
- Eligible?
- —
Personal DTI + credit; lowest rate.
DSCR
20% down · 8.5% · 30yr
- Down + closing
- —
- Monthly P&I
- —
- Monthly cashflow
- —
- DSCR
- —
- Eligible?
- —
No personal income docs; deal must DSCR.
Hard money
10% down · 12.0% · 12mo
- Down + closing
- —
- Monthly P&I
- —
- Monthly cashflow
- —
- DSCR
- —
- Eligible?
- —
Short-term bridge; refi at stabilization.
Listing history 22 events
-
2026-06-19days on market $160,000 Active 11 DOM
-
2026-06-18days on market $160,000 Active 10 DOM
-
2026-06-17days on market $160,000 Active 9 DOM
-
2026-06-16days on market $160,000 Active 8 DOM
-
2026-06-15days on market $160,000 Active 7 DOM
-
2026-06-14days on market $160,000 Active 5 DOM
-
2026-06-13days on market $160,000 Active 4 DOM
-
2026-06-10days on market $160,000 Active 2 DOM
-
2026-06-09remarks 182-char remark
-
2026-06-09days on market $160,000 Active 1 DOM
-
2026-06-08days on market $160,000 Active 118 DOM
-
2026-06-07days on market $160,000 Active 117 DOM
-
2026-06-05days on market $160,000 Active 114 DOM
-
2026-06-02days on market $160,000 Active 112 DOM
-
2026-06-01days on market $160,000 Active 111 DOM
-
2026-05-31days on market $160,000 Active 110 DOM
-
2026-05-30days on market $160,000 Active 109 DOM
-
2025-06-13$199,000 Active
-
2025-06-13$160,000 Active
-
2023-08-30soldstatus
-
2015-12-15soldstatus
-
2014-03-16$40,000
ⓘ Source: listings_history table (triggers on properties + properties_extension) + one-shot
backfill from property_details.listing_events for pre-trigger history.
Nearby sold comps map
Loading sold comps map…
Walkable amenities ~0.75 mi
Loading nearby amenities…
Taxation est. · year 1
- Rental income
- $22,548
- − Mortgage interest
- −$8,962
- − Property taxes
- −$2,400
- − Insurance
- −$800
- − Repairs & maintenance
- −$1,804
- − Management
- −$1,804
- − Depreciation
- −$4,655
- Taxable income
- $2,123
- Est. tax owed @ 24.0%
- −$510
- After-tax cash flow
- $4,035/yr
For passive investors: Depreciation is non-cash, so a rental often shows a tax loss while cash-flowing — sheltering income. Rental losses are passive: they offset passive income freely, and up to $25,000/yr can offset ordinary (W-2) income if you actively participate and your MAGI is under $100k (phasing out to $0 by $150k); unused losses carry forward. On sale, claimed depreciation is recaptured at up to 25%, and gains may owe capital-gains tax (a 1031 exchange can defer both). Figures are a year-1 estimate at your 24.0% rate — not tax advice; consult a CPA.
Schools (NCES district)
- District
- Eagle Pass ISD
- NCES district ID
- 4817730
- Math proficiency
- 15% ▼ -41.00%
- Reading proficiency
- 28% ▼ -18.00%
- Median HH income
- $32,967
- Composite
- 17.48/100
- National rank
- #9057
- State rank
- #774 of 826 in TX
Livability — Rosita
- Score
- 59/100
- State rank
- #1119
- US rank
- #19773
Category grades
Schools grade is shown separately in the Schools card above.
Census & demographics
- Census place
- Rosita, TX
- County
- Maverick County · 57,434 people
- Metro
- Eagle Pass, TX
- Population (ZIP)
- 57,434
- Household income
- $49,954
- Rent vs Own
- Severe rent burden
- 822.0
Population outlook (Maverick County) Hauer SSP2
- Today (2025)
- 62,919 people
- By 2030
- 65,440 · +4.0%
- By 2040
- 70,229 · +11.6%
- By 2050
- 74,218 · +18.0%
- By 2075
- 80,765 · +28.4%
- By 2100
- 76,268 · +21.2%
Race, ethnicity, and origin ACS 2023
- Neighborhood character
- Predominantly Hispanic (95%)
- Race & ethnicity
- Hispanic / Latino 95% Two or more races 53% White 3% Native American 2%
- Hispanic origin (detail)
- Mexican 91% Puerto Rican 1%
- Foreign-born
- 30% · Canada
- Languages at home
- 11% English-only · Spanish 88%
Political lean MEDSL · Maverick
- 2024 margin
- R (+18.5) · D 40.5% · R 59.0%
- 2008→2024 swing
- -75.5pp toward R · 2008: 57.0pp · 2024: -18.5pp
- All cycles
- 2024: R+18.5 2020: D+9.4 2016: D+55.8 2012: D+58.0 2008: D+57.0
Not yet ingested
- Civics
- —
Market trends
- HPI YoY
- ▼ -65.62%
- Current HPI
- 172.9298
- Rent YoY
- —
- Metro
- Eagle Pass, TX
- State GDP YoY
- ▲ 3.95%
- F500 in state
- 110
Industry mix (Fortune 500 HQ in TX)
| Industry | F500 HQs | Revenue |
|---|---|---|
| Energy | 16 | $1,198B |
|
||
| Technology | 5 | $198B |
|
||
| Engineering / Construction | 4 | $72B |
|
||
| Energy Services | 3 | $60B |
|
||
| Utilities | 3 | $41B |
|
||
| Healthcare | 2 | $330B |
|
||
Price history
+300.0% since first listed5 events — show timeline
- 2025-06-13 Listed $160,000 EPBOR
- 2025-06-13 Listed $199,000 EPBOR
- 2023-08-30 Sold (Public Records) — Public Records
- 2015-12-15 Sold (MLS) — EPBOR
- 2014-03-16 Listed $40,000 EPBOR
Property tax history
+5.9%/yrLatest (2025): $138 · +7.5% YoY. Source: county tax records.
Cash-flow waterfall
monthlySold comps — $/sqft
last 12 mo · ≤1 miLoading sold comps…