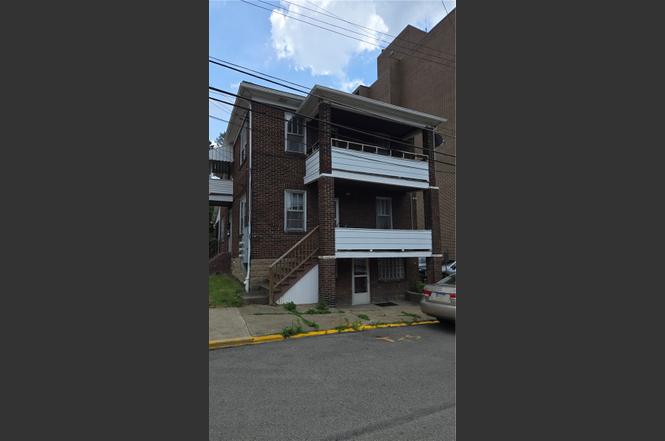
540 Brinton Ave · Trafford, PA
Flood risk 1/10 · Minimal
- FEMA flood zone
- X (unshaded)
- Chance of flooding over 30 yrs
- 0.0%
- Est. flood insurance / yr
- $507 – $1,088
Fire risk 1/10 · Minimal
- Est. fire insurance / yr
- $511 – $949
Heat risk 4/10 · Minor
- Hot days now (above 97°F)
- 7 days/yr
- Hot days in 30 yrs
- 20 days/yr
Wind risk 2/10 · Minimal
- Chance of severe wind over 30 yrs
- 0.0%
Air-quality risk 4/10 · Minor
- Unhealthy air days now
- 5 days/yr
- Unhealthy air days in 30 yrs
- 7 days/yr
Risk factors via First Street. Map © Google.
Why this score? — see what drove the F grade
The composite is a weighted blend of 9 inputs, each scored 0–100. Each bar is that input's sub-score; the figure is the points it added to the 100-point composite (weight × sub-score).
- ARV discount +7.5/15.0
- Schools +6.0/10.0
- Livability +3.4/5.0
- Rent growth +2.5/5.0
- Condition / age +2.5/5.0
- Cash flow +0.0/30.0
- 1% rule +0.0/10.0
- DSCR +0.0/10.0
- Appreciation +0.0/10.0
$179,000
🖨 Deal sheet 📄 Offer letter ✓ Due diligence
Listing remarks MLS
CHARMING 3 UNIT WITH ORIGINAL WOODWORK, HARDWOODS. UPDATED KITCHEN AND CENTRAL AIR ON MID-FLOOR UNIT. WELL-MAINTAINED MECHANICS.
Key facts
- Covered patio
- Rear patio
- Three distinct units
Tags
Property features AI
Finance
- Financial info: Total of 3 units; Gross annual income reported at $30,710; Utilities expense reported at $2,687; Insurance expense reported at $1,000; Unit rents reported: $575, $850, $960
Exterior
- Parking: On-street parking
- Utilities: Electricity available; Natural gas available; Public water available; Public sewer available
- Home design: Multi-family property
- Construction: Brick construction; Shake roof
- Exterior features: Multi-family zoning; Public transportation nearby
Interior
- Bedrooms: One 1-bedroom unit; One 2-bedroom unit; One 3-bedroom unit
- Bathrooms: Each unit has one full bathroom
- Interior features: Unfinished basement
Neighborhood map
What this means for you Summary
Snapshot
- This is a 6-bed/3.0-bath other listed at $179k.
Deal economics
- At list price, monthly cash flow is $-1k ($-15k/yr) — negative.
- Rent doesn't cover operating costs at any purchase price — skip.
Location & tenants
- Location reads 68/100 on livability (#883 in PA) — a middle-class / working-renter tenant base. Strengths: crime A+, cost of living A+, housing A+; Watch: employment D, amenities F, commute F.
- Penn-Trafford SD (suburban): math 60% / reading 78% proficiency, ranked #27 of 539 in PA (top 5%) — acceptable for families but not a draw, mixed tenant base, ~2y average lease; only 14% free/reduced lunch — higher-income household profile.
- Market conditions: 21 active listings in the ZIP; 415 units permitted in Westmoreland County in 2024 (10 in 5+ unit buildings).
Forward outlook
- Local home prices are declining (-3.0%/yr); year-one equity from $1k of loan paydown is wiped out by about $5k of value loss. Plan a longer hold.
- Westmoreland County population projected at -19% by 2050 — secular population decline; favor cash flow + early exit over multi-decade hold.
Negotiation context
- Only 2 days on market — expect competitive offers; lowballing is unlikely to land.
- 2 sale attempts since 10y ago with the ask held roughly flat each time — persistent listings suggest the price (not the market) is what's stuck; bring a comps-based counter.
- Current owner paid $72k; list at $179k implies a 147% gain — meaningful room to come down on a strong offer.
Questions for the listing agent
- What do current leases actually rent for vs. the listed asking? Can we see a recent rent roll and the last 12 months of T-12 income?
- Is there a deadline driving the sale (1031 exchange, divorce, estate, relocation)? That informs how much negotiation room exists.
- Schools are A-rated — typically a magnet for longer-tenancy family renters. What's the average tenant stay here, and is there a school-zone premium baked into asking?
- The area grade is low — what's the realistic commute time and amenity access for the typical tenant pool here? Any planned neighborhood developments (good or bad) we should know about?
- What's the average days-on-market for RENTAL listings here right now (not sales)? A rising rental-DOM trend means longer vacancies and softer asking-rent achievability than the comps imply.
- What's the recent tenant-quality profile in this submarket — average credit score on applications, eviction rate, late-payment / NSF rate, and stable-employment percentage? A property-management company in the area should have these aggregated.
- How much new for-sale + rental construction is in the pipeline within 1–3 miles? Heavy new supply typically softens prices + rents 12–24 months out; constrained supply supports both.
Investment metrics
- 1% rule
- 0.00% ✗
- Cap rate
- -2.01%
- Cash-on-cash
- -29.66%
- DSCR
- -0.32
- GRM
- 0.0
CMA / ARV
No comps found within radius.
Projected returns pro-forma
-3.0% appreciation · 3.0% rent growth · sell at horizon
- IRR
- -87.2%
- Equity multiple
- -1.15×
- Total profit
- $-107,893
- Equity at exit
- $26,689
- IRR
- —
- Equity multiple
- -2.90×
- Total profit
- $-195,529
- Equity at exit
- $15,477
Cash invested: $50,120 (down + closing). Projections, not guarantees.
Landlord ↔ Tenant lean methodology
- Overall (STATE)
- 62 Landlord-Friendly
- State Pennsylvania
- 62 Landlord-Friendly · EVEN
- County
- — inherits STATE
- City
- — inherits STATE
ZIP-level market 15085
- Home prices YoY
- -30.4%
- Active inventory
- 21
Monthly cashflow live
- Estimated rent
- $0 none
- Mortgage (P&I)
- −$939
- Tax from tax record
- −$225 /mo · $2,704/yr
- Insurance
- −$75
- HOA
- −$0
- Vacancy / Maint / Mgmt
- −$0
- Net cashflow
- $-1,239
Break-even live
UW: 25.0% down · 7.5% · 30yr · 1.5% tax · 5.0% vac · 8.0% maint · 8.0% mgmt
Financing live
Cash to close
- Down payment
- $44,750
- Closing costs
- $5,370
- Reserves months
- —
- Total cash needed
- —
Loan-product check · same deal, 3 products live
Conventional
25% down · 7.5% · 30yr
- Down + closing
- —
- Monthly P&I
- —
- Monthly cashflow
- —
- DSCR
- —
- Eligible?
- —
Personal DTI + credit; lowest rate.
DSCR
20% down · 8.5% · 30yr
- Down + closing
- —
- Monthly P&I
- —
- Monthly cashflow
- —
- DSCR
- —
- Eligible?
- —
No personal income docs; deal must DSCR.
Hard money
10% down · 12.0% · 12mo
- Down + closing
- —
- Monthly P&I
- —
- Monthly cashflow
- —
- DSCR
- —
- Eligible?
- —
Short-term bridge; refi at stabilization.
Listing history 3 events
-
2026-06-18days on market $179,000 Active 2 DOM
-
2026-06-17remarks 693-char remark
-
2026-06-17$179,000 Active 1 DOM
ⓘ Source: listings_history table (triggers on properties + properties_extension) + one-shot
backfill from property_details.listing_events for pre-trigger history.
Tax reassessment forecast PA · Partial reset (capped growth)
- Current annual tax
- $2,704 · $225/mo
- Projected year-2 tax
- $2,766 · $231/mo
- Expected delta
- +$62/yr (+$5/mo · 2.3%)
ⓘ Screening estimate from a state-policy table — verify with the county assessor before closing.
Climate risk First Street
- Flood 1/10 Low FEMA zone X (unshaded) · 0% chance over 30 yrs
- Wildfire 1/10 Low
- Heat 4/10 Moderate 7 d/yr ≥97°F today · 20 d/yr by 30 yrs out
- Wind 2/10 Low 0% chance of damaging wind over 30 yrs
- Air quality 4/10 Moderate 5 unhealthy d/yr today · 7 by 30 yrs out
Nearby sold comps map
Loading sold comps map…
Walkable amenities ~0.75 mi
Loading nearby amenities…
Taxation est. · year 1
- Rental income
- $0
- − Mortgage interest
- −$10,027
- − Property taxes
- −$2,704
- − Insurance
- −$895
- − Repairs & maintenance
- −$0
- − Management
- −$0
- − Depreciation
- −$5,207
- Taxable loss
- −$18,833
- Est. tax savings @ 24.0%
- +$4,520
- After-tax cash flow
- $-10,343/yr
For passive investors: Depreciation is non-cash, so a rental often shows a tax loss while cash-flowing — sheltering income. Rental losses are passive: they offset passive income freely, and up to $25,000/yr can offset ordinary (W-2) income if you actively participate and your MAGI is under $100k (phasing out to $0 by $150k); unused losses carry forward. On sale, claimed depreciation is recaptured at up to 25%, and gains may owe capital-gains tax (a 1031 exchange can defer both). Figures are a year-1 estimate at your 24.0% rate — not tax advice; consult a CPA.
Schools (NCES district)
- District
- Penn-Trafford SD
- NCES district ID
- 4218660
- Math proficiency
- 60% ▼ -13.00%
- Reading proficiency
- 78% ▼ -7.00%
- Median HH income
- $68,988
- Composite
- 60.28/100
- National rank
- #855
- State rank
- #27 of 539 in PA
Livability — Trafford
- Score
- 68/100
- State rank
- #883
- US rank
- #9411
Category grades
Schools grade is shown separately in the Schools card above.
Census & demographics
- Census place
- Trafford, PA
- Population (ZIP)
- 8,123
Population outlook (Westmoreland County) Hauer SSP2
- Today (2025)
- 342,555 people
- By 2030
- 331,717 · -3.2%
- By 2040
- 304,976 · -11.0%
- By 2050
- 277,444 · -19.0%
- By 2075
- 224,607 · -34.4%
- By 2100
- 171,084 · -50.1%
Race, ethnicity, and origin ACS 2023
- Neighborhood character
- Predominantly White (92%)
- Race & ethnicity
- White 92% Two or more races 6% Hispanic / Latino 2% Asian 1%
- Common ancestry
- Romanian 9% Slovak 3% Scotch-Irish 2%
- Foreign-born
- 2% · South Korea
- Languages at home
- 96% English-only · Other Indo-European 2%
Political lean MEDSL · Westmoreland
- 2024 margin
- Strong R (+28.4) · D 35.4% · R 63.9%
- 2008→2024 swing
- -11.7pp toward R · 2008: -16.7pp · 2024: -28.4pp
- All cycles
- 2024: R+28.4 2020: R+28.3 2016: R+31.3 2012: R+23.7 2008: R+16.7
Not yet ingested
- Civics
- —
Market trends
- HPI YoY
- ▼ -87.06%
- Current HPI
- 199.6379
- Rent YoY
- —
- Metro
- —
- State GDP YoY
- ▲ 1.68%
- F500 in state
- 34
Industry mix (Fortune 500 HQ in PA)
| Industry | F500 HQs | Revenue |
|---|---|---|
| Healthcare | 2 | $309B |
|
||
| Insurance | 2 | $27B |
|
||
| Telecommunications / Media | 1 | $124B |
|
||
| Industrial Distribution | 1 | $22B |
|
||
| Financial Services | 1 | $20B |
|
||
| Chemicals / Materials | 1 | $18B |
|
||
Price history
+110.6% since first listed7 events — show timeline
- 2026-06-09 Listed $179,000 West Penn MLS
- 2016-11-21 Price Changed $72,500 West Penn MLS
- 2016-11-21 Sold (Public Records) $72,500 Public Records
- 2016-11-21 Sold (MLS) $72,500 West Penn MLS
- 2016-10-27 Pending — West Penn MLS
- 2016-10-27 Price Changed $85,000 West Penn MLS
- 2016-10-14 Listed $85,000 West Penn MLS
Property tax history
+1.8%/yrLatest (2026): $2,704 · +0.0% YoY. Source: county tax records.
Cash-flow waterfall
monthlySold comps — $/sqft
last 12 mo · ≤1 miLoading sold comps…