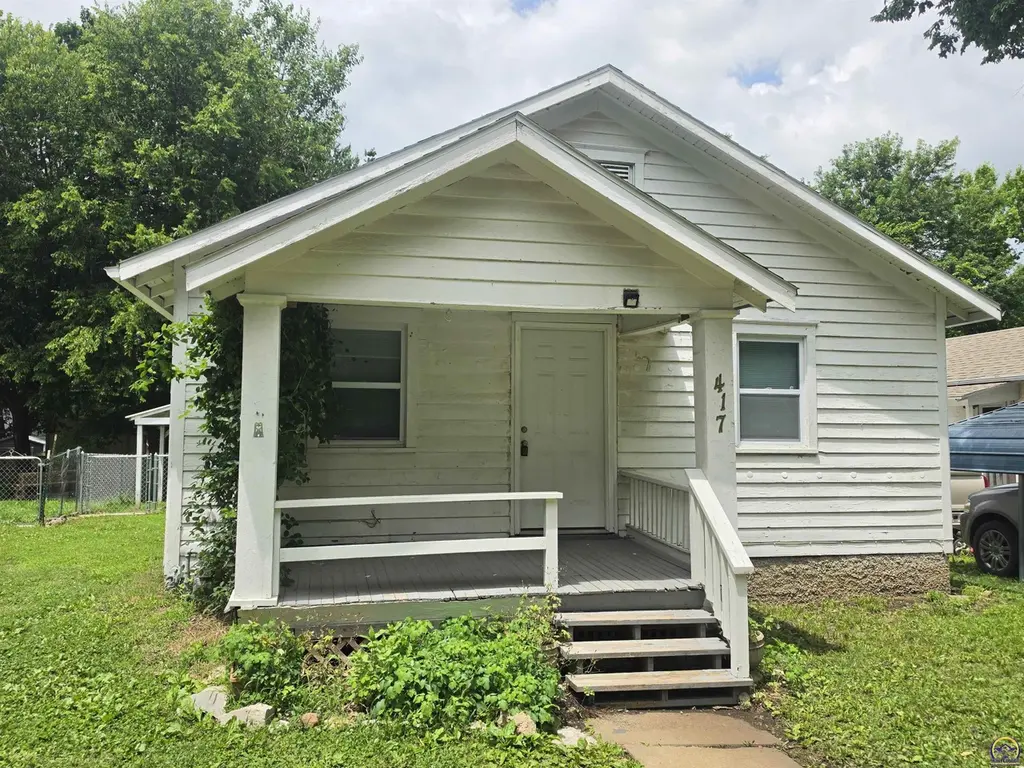
417 Elm St · Emporia, KS
Flood risk 4/10 · Minor
- FEMA flood zone
- X (unshaded)
- Chance of flooding over 30 yrs
- 0.22%
- Est. flood insurance / yr
- $473 – $860
Fire risk 1/10 · Minimal
- Est. fire insurance / yr
- $1,154 – $2,142
Heat risk 5/10 · Moderate
- Hot days now (above 107°F)
- 7 days/yr
- Hot days in 30 yrs
- 17 days/yr
Wind risk 2/10 · Minimal
- Chance of severe wind over 30 yrs
- —
Air-quality risk 4/10 · Minor
- Unhealthy air days now
- 4 days/yr
- Unhealthy air days in 30 yrs
- 4 days/yr
Risk factors via First Street. Map © Google.
Why this score? — see what drove the D- grade
The composite is a weighted blend of 9 inputs, each scored 0–100. Each bar is that input's sub-score; the figure is the points it added to the 100-point composite (weight × sub-score).
- Cash flow +15.4/30.0
- DSCR +4.7/10.0
- 1% rule +4.2/10.0
- Livability +3.8/5.0
- Rent growth +3.2/5.0
- Condition / age +2.5/5.0
- Schools +2.0/10.0
- ARV discount +0.0/15.0
- Appreciation +0.0/10.0
$94,900
🖨 Deal sheet (PDF) 📄 Offer letter ✓ Due diligence
Listing remarks MLS
Great starter home or rental home in this renovated bungalow. This 2 bedroom 1 bath home features new windows, new roof, re-purposed hard wood floor, interior paint and much more. Hurry and schedule your showing today!
Key facts
- Quiet street
- 2024 roof
- Hardwood floors
Tags
Property features AI
Exterior
- Parking: Carport
- Utilities: Public water
- Home design: Single family residence (single house); Residential property
- Construction: Above-grade finished area: 832; Full unfinished concrete basement
- Exterior features: Chain link fencing; Composition roof
Interior
- Kitchen: Electric range; Refrigerator
- Flooring: Hardwood floors; Laminate floors
- Bathrooms: 1 full bathroom
- Heating & cooling: Cooling: window units
- Interior features: Gas water heater; Window cooling units
- Laundry & utility: Laundry in basement; Full unfinished concrete basement
Neighborhood map
What this means for you Summary
Snapshot
- This is a 2-bed/1.0-bath single-family listed at $95k.
Deal economics
- At list price, monthly cash flow is $36 ($438/yr) — positive.
- The deal already cash-flows at list — no discount required.
- To meet the 1% rule (rent ≥ 1% of price), the offer needs to be $88k (7.6% below list).
- Recommended offer: $88k (7.6% below list) — sets the bar for 1% rule.
Location & tenants
- Location reads 75/100 on livability (#60 in KS, #3,810 nationally) — a middle-class / working-renter tenant base. Strengths: cost of living A+, housing A+, health & safety A+; Watch: crime D, commute F, employment D-.
- Emporia (town): math 19% / reading 30% proficiency, ranked #146 of 169 in KS (top 86%) — low school quality limits family demand, transient renter base, plan for 1-2y turnover.
- Zoned schools: Riverside Elementary (math 17% / reading 22%, grade F, #593 of 684 statewide, top 89%, 424 students, 77% FRL); Emporia Middle School (math 12% / reading 24%, grade F, #164 of 219 statewide, top 76%, 900 students, 62% FRL); Emporia High (math 18% / reading 29%, grade F, #161 of 327 statewide, top 50%, 1,510 students, 51% FRL).
- Market conditions: Rents rising (+2.8%/yr); 160 active listings in the ZIP; 33 units permitted in Lyon County in 2024 (0 in 5+ unit buildings).
Forward outlook
- Local home prices are declining (-3.0%/yr); year-one equity from $656 of loan paydown is wiped out by about $3k of value loss. Plan a longer hold.
- Lyon County population projected to shrink 4% by 2050 — rents likely to lag national; underwrite the cash flow, not the appreciation.
Negotiation context
- Only 11 days on market — expect competitive offers; lowballing is unlikely to land.
- 2 sale attempts since 11y ago with the ask held roughly flat each time — persistent listings suggest the price (not the market) is what's stuck; bring a comps-based counter.
Risks & watch-outs
- Watch-outs: built in 1921 — expect roof / HVAC / electrical / plumbing capex.
- Climate carrying-cost: extreme-heat days projected 7→17/yr by 2055 (HVAC capex compounding) — expect insurance premiums to compound above CPI over the hold.
Questions for the listing agent
- Built in 1921 — when were the roof, HVAC, electrical panel, plumbing, and water heater last replaced?
- Is there a deadline driving the sale (1031 exchange, divorce, estate, relocation)? That informs how much negotiation room exists.
- Schools are F-rated, which usually means shorter tenancies and higher turnover. Who's the typical renter profile here, and what's been the actual vacancy rate?
- Crime grade is D in this area — have there been break-ins, vandalism, or insurance claims at this property in the last 3 years? What carrier currently insures it and at what premium?
- The area grade is low — what's the realistic commute time and amenity access for the typical tenant pool here? Any planned neighborhood developments (good or bad) we should know about?
- What's the average days-on-market for RENTAL listings here right now (not sales)? A rising rental-DOM trend means longer vacancies and softer asking-rent achievability than the comps imply.
- What's the recent tenant-quality profile in this submarket — average credit score on applications, eviction rate, late-payment / NSF rate, and stable-employment percentage? A property-management company in the area should have these aggregated.
- How much new for-sale + rental construction is in the pipeline within 1–3 miles? Heavy new supply typically softens prices + rents 12–24 months out; constrained supply supports both.
Investment metrics
- 1% rule
- 0.92% ✗
- Cap rate
- 6.75%
- Cash-on-cash
- 1.65%
- DSCR
- 1.07
- GRM
- 9.0
CMA / ARV
- ARV (on-the-fly)
- $78,208
- Comps found
- 1
Show comp detail 1 sale within ~0.75 mi
| Address | Dist | Beds/Ba | Sqft | Sold | Price | $/sf | Match |
|---|---|---|---|---|---|---|---|
| 427 Elm St | 0.03mi | 2/1.0 | 726 (-13%) | 23mo | $68,000 | $94 | 58 |
Match score weights: distance 35% · size 25% · config 20% · recency 20%. Top-matched comps best support the ARV.
Projected returns pro-forma
-3.0% appreciation · 2.78% rent growth · sell at horizon
- IRR
- -13.9%
- Equity multiple
- 0.50×
- Total profit
- $-13,235
- Equity at exit
- $14,150
- IRR
- -5.4%
- Equity multiple
- 0.65×
- Total profit
- $-9,269
- Equity at exit
- $8,205
Cash invested: $26,572 (down + closing). Projections, not guarantees.
Landlord ↔ Tenant lean methodology
- Overall (STATE)
- 83 Strongly Landlord-Friendly
- State Kansas
- 83 Strongly Landlord-Friendly · R+10
- County
- — inherits STATE
- City
- — inherits STATE
ZIP-level market 66801
- Rents YoY
- 2.8%
- Active inventory
- 160
- Price-to-rent
- 9.0×
Monthly cashflow live
- Estimated rent
- $877 medium interval (Pro) →
- Mortgage (P&I)
- −$498
- Tax from tax record
- −$119 /mo · $1,429/yr
- Insurance
- −$40
- HOA
- −$0
- Vacancy / Maint / Mgmt
- −$184
- Net cashflow
- $36
Break-even live
Sensitivity live
| Price | -10% $90 | -5% $63 | +0% $36 | +5% $10 | +10% $-17 |
|---|---|---|---|---|---|
| Rent | -10% $-33 | -5% $2 | +0% $36 | +5% $71 | +10% $106 |
| Rate | -1.0pp $84 | -0.5pp $61 | base $36 | +0.5pp $12 | +1.0pp $-13 |
UW: 25.0% down · 7.5% · 30yr · 1.5% tax · 5.0% vac · 8.0% maint · 8.0% mgmt
Financing live
Cash to close
- Down payment
- $23,725
- Closing costs
- $2,847
- Reserves months
- —
- Total cash needed
- —
Loan-product check · same deal, 3 products live
Conventional
25% down · 7.5% · 30yr
- Down + closing
- —
- Monthly P&I
- —
- Monthly cashflow
- —
- DSCR
- —
- Eligible?
- —
Personal DTI + credit; lowest rate.
DSCR
20% down · 8.5% · 30yr
- Down + closing
- —
- Monthly P&I
- —
- Monthly cashflow
- —
- DSCR
- —
- Eligible?
- —
No personal income docs; deal must DSCR.
Hard money
10% down · 12.0% · 12mo
- Down + closing
- —
- Monthly P&I
- —
- Monthly cashflow
- —
- DSCR
- —
- Eligible?
- —
Short-term bridge; refi at stabilization.
Listing history 8 events
-
2026-06-22days on market $94,900 Active 11 DOM
-
2026-06-19days on market $94,900 Active 8 DOM
-
2026-06-18days on market $94,900 Active 7 DOM
-
2026-06-17days on market $94,900 Active 6 DOM
-
2026-06-16days on market $94,900 Active 5 DOM
-
2026-06-15days on market $94,900 Active 4 DOM
-
2026-06-14days on market $94,900 Active 2 DOM
-
2026-06-12$94,900 Active 1 DOM
ⓘ Source: listings_history table (triggers on properties + properties_extension) + one-shot
backfill from property_details.listing_events for pre-trigger history.
Tax reassessment forecast KS · Resets to sale price
- Current annual tax
- $1,429 · $119/mo
- Projected year-2 tax
- $1,429 · $119/mo
- Expected delta
- $0/yr ($0/mo · 0.0%)
ⓘ Screening estimate from a state-policy table — verify with the county assessor before closing.
Climate risk First Street
- Flood 4/10 Moderate FEMA zone X (unshaded) · 22% chance over 30 yrs
- Wildfire 1/10 Low
- Heat 5/10 Major 7 d/yr ≥107°F today · 17 d/yr by 30 yrs out
- Wind 2/10 Low
- Air quality 4/10 Moderate 4 unhealthy d/yr today · 4 by 30 yrs out
Nearby sold comps map
Loading sold comps map…
Walkable amenities ~0.75 mi
Loading nearby amenities…
Taxation est. · year 1
- Rental income
- $10,523
- − Mortgage interest
- −$5,316
- − Property taxes
- −$1,429
- − Insurance
- −$474
- − Repairs & maintenance
- −$842
- − Management
- −$842
- − Depreciation
- −$2,761
- Taxable loss
- −$1,141
- Est. tax savings @ 24.0%
- +$274
- After-tax cash flow
- $712/yr
For passive investors: Depreciation is non-cash, so a rental often shows a tax loss while cash-flowing — sheltering income. Rental losses are passive: they offset passive income freely, and up to $25,000/yr can offset ordinary (W-2) income if you actively participate and your MAGI is under $100k (phasing out to $0 by $150k); unused losses carry forward. On sale, claimed depreciation is recaptured at up to 25%, and gains may owe capital-gains tax (a 1031 exchange can defer both). Figures are a year-1 estimate at your 24.0% rate — not tax advice; consult a CPA.
Schools (NCES district)
- District
- Emporia
- NCES district ID
- 2005940
- Math proficiency
- 19% ▼ -8.00%
- Reading proficiency
- 30% ▼ -1.00%
- Median HH income
- $36,740
- Composite
- 20.34/100
- National rank
- #8607
- State rank
- #146 of 169 in KS
Livability — Emporia
- Score
- 75/100
- State rank
- #60
- US rank
- #3810
Category grades
Schools grade is shown separately in the Schools card above.
Census & demographics
- Census place
- Emporia, KS
- County
- Lyon County · 27,585 people
- City population
- 27,585
- Metro
- Emporia, KS
- Population (ZIP)
- 27,585
- Household income
- $56,794
- Rent vs Own
- Severe rent burden
- 1054.0
Population outlook (Lyon County) Hauer SSP2
- Today (2025)
- 33,170 people
- By 2030
- 33,104 · -0.2%
- By 2040
- 32,526 · -1.9%
- By 2050
- 31,863 · -3.9%
- By 2075
- 31,879 · -3.9%
- By 2100
- 30,609 · -7.7%
Race, ethnicity, and origin ACS 2023
- Neighborhood character
- Majority White (65%)
- Race & ethnicity
- White 65% Hispanic / Latino 27% Two or more races 20% Black 2% Asian 2%
- Hispanic origin (detail)
- Mexican 22%
- Common ancestry
- Italian 7% Lithuanian 3% Slovak 2%
- Foreign-born
- 12% · Canada, Vietnam, China
- Languages at home
- 81% English-only · Spanish 17%
Political lean MEDSL · Lyon
- 2024 margin
- R (+14.7) · D 41.6% · R 56.3% · Other 2.1%
- 2008→2024 swing
- -8.7pp toward R · 2008: -6.0pp · 2024: -14.7pp
- All cycles
- 2024: R+14.7 2020: R+11.0 2016: R+16.2 2012: R+11.9 2008: R+6.0
Not yet ingested
- Civics
- —
Market trends
- HPI YoY
- ▼ -186.93%
- Current HPI
- 186.0786
- Rent YoY
- ▲ 2.78%
- Metro
- Emporia, KS
- State GDP YoY
- —
- F500 in state
- 0
Price history
+430.2% since first listed6 events — show timeline
- 2026-06-10 Listed $94,900 Sunflower MLS as distributed by MLS GRID
- 2024-04-03 Sold (Public Records) — Public Records
- 2024-04-02 Sold (MLS) — Sunflower MLS as distributed by MLS GRID
- 2015-07-24 Sold (Public Records) — Public Records
- 2015-07-24 Sold (MLS) — Sunflower MLS as distributed by MLS GRID
- 2015-07-17 Listed $17,900 Sunflower MLS as distributed by MLS GRID
Property tax history
+9.5%/yrLatest (2025): $1,429 · +73.0% YoY. Source: county tax records.
Cash-flow waterfall
monthlySold comps — $/sqft
last 12 mo · ≤1 miLoading sold comps…