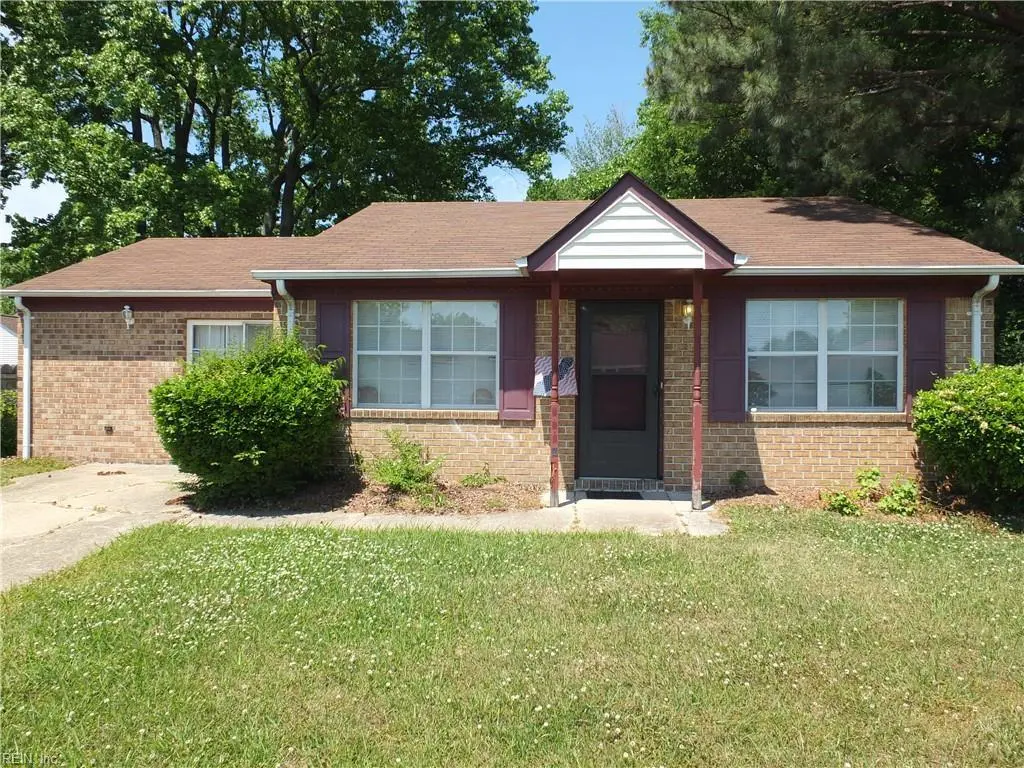
3712 Santos St · Norfolk, VA
Flood risk 1/10 · Minimal
- FEMA flood zone
- X (unshaded)
- Chance of flooding over 30 yrs
- 0.0%
- Est. flood insurance / yr
- $507 – $1,088
Fire risk 1/10 · Minimal
- Est. fire insurance / yr
- $666 – $1,236
Heat risk 9/10 · Severe
- Hot days now (above 105°F)
- 7 days/yr
- Hot days in 30 yrs
- 16 days/yr
Wind risk 8/10 · Major
- Chance of severe wind over 30 yrs
- 80.0%
Air-quality risk 3/10 · Minor
- Unhealthy air days now
- 2 days/yr
- Unhealthy air days in 30 yrs
- 3 days/yr
Risk factors via First Street. Map © Google.
Why this score? — see what drove the D+ grade
The composite is a weighted blend of 9 inputs, each scored 0–100. Each bar is that input's sub-score; the figure is the points it added to the 100-point composite (weight × sub-score).
- ARV discount +15.0/15.0
- Cash flow +12.6/30.0
- Livability +4.2/5.0
- DSCR +3.8/10.0
- 1% rule +3.5/10.0
- Schools +3.5/10.0
- Rent growth +3.4/5.0
- Condition / age +2.5/5.0
- Appreciation +0.0/10.0
$230,000
🖨 Deal sheet 📄 Offer letter ✓ Due diligence
Listing remarks
Property being sold "AS IS". Appliances convey "AS IS". Contents and debris in and on the property at settlement convey. Due diligence should be completed prior to submitting offer. No contingencies please. Property is being sold by a Conservator and, as a result, requires approval by a Commissioner of Accounts before any contract can be ratified.
Key facts
- 2 parking spots
- Built 1982
- Listed 31 days
Property features AI
Finance
- HOA & community: No HOA fees
Exterior
- Parking: Driveway with 2 parking spaces
- Security: Security system
- Utilities: City/County water; City/County sewer; Electric water heater; Electric power
- Home design: Detached ranch-style home; Single-story
- Construction: Brick and vinyl siding; Asphalt shingle roof; Slab foundation
- Exterior features: Patio; Chain-link full fence; Storage shed
Interior
- Kitchen: Electric range; Dishwasher; Refrigerator
- Bedrooms: Master bedroom with ensuite (first floor); Additional bedroom(s); First-floor bedroom and full bathroom
- Flooring: Carpet; Vinyl
- Bathrooms: 2 full bathrooms
- Heating & cooling: Electric heating; Central air conditioning
- Interior features: Ceiling fan; Security system; Satellite dish; Scuttle (attic) access
- Laundry & utility: Washer; Dryer; Utility room
Neighborhood map
What this means for you Summary
Snapshot
- This is a 3-bed/2.0-bath single-family listed at $230k.
Deal economics
- At list price, monthly cash flow is $-28 ($-338/yr) — negative.
- To cash-flow at today's rent, offer at most $225k (2.2% below list).
- To meet the 1% rule (rent ≥ 1% of price), the offer needs to be $196k (14.9% below list).
- Recommended offer: $196k (14.9% below list) — sets the bar for 1% rule.
- Cap rate 6.1% vs local median 4.0% in Norfolk — top-decile yield for the area; either an underpriced asset or a hidden risk that comps aren't pricing in. Stress-test before assuming the spread holds.
Location & tenants
- Location reads 83/100 on livability (#43 in VA, #1,026 nationally) — a professional / high-income tenant draw. Strengths: amenities A+, commute A+, health & safety A+; Watch: employment C-, crime F.
- Norfolk City Public School District (urban): math 27% / reading 56% proficiency, ranked #118 of 131 in VA (top 90%) — families likely to look elsewhere, expect single-tenant / working-renter base with shorter leases.
- Zoned schools: Coleman Place Elementary (math 13% / reading 38%, grade F, #1,046 of 1,108 statewide, top 95%, 617 students, 98% FRL); Booker T Washington High (math 26% / reading 70%, grade D, #303 of 319 statewide, top 95%, 947 students, 94% FRL) — zoned schools average 96% FRL vs 59% district-wide (37 pts higher); higher-poverty schools than district average — tighter screening recommended.
- Market conditions: Rents rising (+3.4%/yr); 132 active listings in the ZIP; 40 comparable units currently listed for rent nearby; rentals at typical pace (median 24d on market — plan ~3-4 weeks tenant-placement turnaround); 42% of comp listings sitting > 30 days — soft ceiling on asking rent; 438 units permitted in Norfolk city in 2024 (273 in 5+ unit buildings).
- This rent runs 34% of the median local income ($68k/yr) — at the standard rent-burdened threshold; future hikes will face affordability resistance.
Forward outlook
- Local home prices are declining (-3.0%/yr); year-one equity from $2k of loan paydown is wiped out by about $7k of value loss. Plan a longer hold.
Negotiation context
- It's been on market 31 days — a 3% lower offer ($223k) is reasonable based on typical stale-listing flexibility.
- Current owner paid $61k; list at $230k implies a 277% gain — meaningful room to come down on a strong offer.
Risks & watch-outs
- Climate carrying-cost: severe wind risk, 80% chance of damaging wind over 30y; extreme-heat days projected 7→16/yr by 2055 (HVAC capex compounding) — expect insurance premiums to compound above CPI over the hold.
Questions for the listing agent
- What do current leases actually rent for vs. the listed asking? Can we see a recent rent roll and the last 12 months of T-12 income?
- It's been on market 31 days. Have you received any prior offers? Is the seller open to a 15% concession, seller financing, or rate buy-down credit?
- Is there a deadline driving the sale (1031 exchange, divorce, estate, relocation)? That informs how much negotiation room exists.
- Schools are A-rated — typically a magnet for longer-tenancy family renters. What's the average tenant stay here, and is there a school-zone premium baked into asking?
- Crime grade is F in this area — have there been break-ins, vandalism, or insurance claims at this property in the last 3 years? What carrier currently insures it and at what premium?
- The area grade is low — what's the realistic commute time and amenity access for the typical tenant pool here? Any planned neighborhood developments (good or bad) we should know about?
- What's the average days-on-market for RENTAL listings here right now (not sales)? A rising rental-DOM trend means longer vacancies and softer asking-rent achievability than the comps imply.
- What's the recent tenant-quality profile in this submarket — average credit score on applications, eviction rate, late-payment / NSF rate, and stable-employment percentage? A property-management company in the area should have these aggregated.
- How much new for-sale + rental construction is in the pipeline within 1–3 miles? Heavy new supply typically softens prices + rents 12–24 months out; constrained supply supports both.
Investment metrics
- 1% rule
- 0.85% ✗
- Cap rate
- 6.15%
- Cash-on-cash
- -0.52%
- DSCR
- 0.98
- GRM
- 9.8
CMA / ARV
- ARV (on-the-fly)
- $298,200
- Comps found
- 12
Show comp detail 12 sales within ~0.75 mi
| Address | Dist | Beds/Ba | Sqft | Sold | Price | $/sf | Match |
|---|---|---|---|---|---|---|---|
| 3414 Tait Ter | 0.19mi | 4/2.0 (+1) | 1,498 (+6%) | 1mo | $314,650 | $210 | 76 |
| 4614 Cape Henry Ave | 0.49mi | 3/2.0 | 1,400 (-1%) | 2mo | $285,000 | $204 | 73 |
| 2444 Ballentine Blvd | 0.48mi | 4/1.0 (+1) | 1,424 (+0%) | 2mo | $160,000 | $112 | 67 |
| 2813 Ballentine Blvd | 0.55mi | 3/2.5 | 1,364 (-4%) | 1mo | $306,500 | $225 | 65 |
| 3772 Larkin St | 0.19mi | 3/2.5 | 1,630 (+15%) | 3mo | $325,000 | $199 | 62 |
| 2428 Juniper St | 0.53mi | 3/2.0 | 1,517 (+7%) | 3mo | $278,000 | $183 | 62 |
| 3432 W Bonner Dr | 0.58mi | 4/3.0 (+1) | 1,401 (-1%) | 1mo | $357,000 | $255 | 61 |
| 2329 Early St | 0.48mi | 3/2.0 | 1,564 (+10%) | 2mo | $339,900 | $217 | 59 |
| 2813 Keller Ave | 0.64mi | 3/2.0 | 1,512 (+6%) | 2mo | $325,000 | $215 | 58 |
| 3636 Henrico St | 0.71mi | 3/2.0 | 1,500 (+6%) | 2mo | $320,000 | $213 | 56 |
| 2721 Keller Ave | 0.60mi | 4/1.0 (+1) | 1,300 (-8%) | 3mo | $195,000 | $150 | 47 |
| 2311 Harrell Ave | 0.71mi | 4/1.0 (+1) | 1,296 (-9%) | 1mo | $270,000 | $208 | 42 |
Match score weights: distance 35% · size 25% · config 20% · recency 20%. Top-matched comps best support the ARV.
Projected returns pro-forma
-3.0% appreciation · 3.42% rent growth · sell at horizon
- IRR
- -16.7%
- Equity multiple
- 0.41×
- Total profit
- $-38,211
- Equity at exit
- $34,294
- IRR
- -7.8%
- Equity multiple
- 0.50×
- Total profit
- $-32,063
- Equity at exit
- $19,886
Cash invested: $64,400 (down + closing). Projections, not guarantees.
Landlord ↔ Tenant lean methodology
- Overall (STATE)
- 55 Moderately Landlord-Leaning
- State Virginia
- 55 Moderately Landlord-Leaning · D+2
- County
- — inherits STATE
- City
- — inherits STATE
ZIP-level market 23513
- Home prices YoY
- -9.3%
- Rents YoY
- 3.4%
- Active inventory
- 132
- Price-to-rent
- 9.8×
Monthly cashflow live
- Estimated rent
- $1,957 high interval (Pro) →
- Mortgage (P&I)
- −$1,206
- Tax from tax record
- −$272 /mo · $3,263/yr
- Insurance
- −$96
- HOA
- −$0
- Vacancy / Maint / Mgmt
- −$411
- Net cashflow
- $-28
Break-even live
UW: 25.0% down · 7.5% · 30yr · 1.5% tax · 5.0% vac · 8.0% maint · 8.0% mgmt
Financing live
Cash to close
- Down payment
- $57,500
- Closing costs
- $6,900
- Reserves months
- —
- Total cash needed
- —
Loan-product check · same deal, 3 products live
Conventional
25% down · 7.5% · 30yr
- Down + closing
- —
- Monthly P&I
- —
- Monthly cashflow
- —
- DSCR
- —
- Eligible?
- —
Personal DTI + credit; lowest rate.
DSCR
20% down · 8.5% · 30yr
- Down + closing
- —
- Monthly P&I
- —
- Monthly cashflow
- —
- DSCR
- —
- Eligible?
- —
No personal income docs; deal must DSCR.
Hard money
10% down · 12.0% · 12mo
- Down + closing
- —
- Monthly P&I
- —
- Monthly cashflow
- —
- DSCR
- —
- Eligible?
- —
Short-term bridge; refi at stabilization.
Rent comps 40 comps
| Address | Beds | Baths | Sqft | Rent | $/sqft | DOM | Units | Dist |
|---|---|---|---|---|---|---|---|---|
| 1525 Nevada Ave Unit B Norfolk, VA | 2.0 | 1.5 | 1134 | $1,445 | $1.27 | 43d | 1 | 0.28mi |
| 1531 Spruce St Unit B Norfolk, VA | 3.0 | 2.0 | 1304 | $1,600 | $1.23 | 23d | 1 | 0.43mi |
| 1531 Spruce St Unit B Norfolk, VA | 3.0 | 2.0 | 1304 | $1,600 | $1.23 | 43d | 1 | 0.43mi |
| 2721 Grandy Ave Norfolk, VA | 2.0 | 1.0 | 900 | $1,150 | $1.28 | 23d | 1 | 0.49mi |
| 2400 Ballentine Blvd Unit A Norfolk, VA | 2.0 | 1.0 | 879 | $1,550 | $1.76 | 43d | 1 | 0.52mi |
| 2531 Vincent Ave Norfolk, VA | 3.0 | 2.0 | 1600 | $2,195 | $1.37 | 43d | 1 | 0.55mi |
| 3477 E Bonner Dr Norfolk, VA | 3.0 | 1.0 | 1304 | $2,000 | $1.53 | 23d | 1 | 0.66mi |
| 2815 Keller Ave Norfolk, VA | 3.0 | 2.0 | 1210 | $2,250 | $1.86 | 4d | 1 | 0.67mi |
| 3640 Robin Hood Rd Norfolk, VA | 4.0 | 2.5 | 1400 | $2,999 | $2.14 | 17d | 1 | 0.70mi |
| 3653 Nottaway St Norfolk, VA | 3.0 | 1.5 | 1564 | $2,200 | $1.41 | 17d | 1 | 0.72mi |
| 2412 Azalea Garden Rd Unit 105 Norfolk, VA | 2.0 | 1.0 | 950 | $1,325 | $1.39 | 23d | 1 | 0.73mi |
| 2412 Azalea Garden Rd Apt 210 Norfolk, VA | 2.0 | 1.0 | 950 | $1,325 | $1.39 | 43d | 1 | 0.73mi |
| 4563 Shoshone Ct Norfolk, VA | 3.0 | 2.0 | 1600 | $2,500 | $1.56 | 43d | 1 | 0.75mi |
| 4745 Lind St Unit A Norfolk, VA | 2.0 | 1.0 | 1000 | $1,600 | $1.60 | 43d | 1 | 0.77mi |
| 1562 Norcova Ave Norfolk, VA | 3.0 | 1.0 | 1288 | $2,000 | $1.55 | 17d | 1 | 0.81mi |
| 2949 Verdun Ave Norfolk, VA | 3.0 | 2.0 | 950 | $3,000 | $3.16 | 43d | 1 | 0.83mi |
| 3504 Chesapeake Blvd Norfolk, VA | 3.0 | 2.0 | 1624 | $1,995 | $1.23 | 43d | 1 | 0.87mi |
| 3504 Chesapeake Blvd Norfolk, VA | 3.0 | 2.0 | 1624 | $1,995 | $1.23 | 23d | 1 | 0.87mi |
| 2660 Chesapeake Blvd Norfolk, VA | 3.0 | 2.0 | 1375 | $2,100 | $1.53 | 17d | 1 | 0.91mi |
| 2640 Azalea Garden Rd Norfolk, VA | 3.0 | 1.5 | 1100 | $2,150 | $1.95 | 4d | 1 | 0.95mi |
| 2914 Peronne Ave Norfolk, VA | 4.0 | 2.0 | 1764 | $2,495 | $1.41 | 23d | 1 | 1.01mi |
| 1371 E Norcova Dr Norfolk, VA | 2.0 | 1.0 | 967 | $1,750 | $1.81 | 7d | 1 | 1.01mi |
| 1323 W Norcova Dr Norfolk, VA | 3.0 | 1.0 | 1410 | $2,500 | $1.77 | 43d | 1 | 1.02mi |
| 2405 Lafayette Blvd Unit A Norfolk, VA | 3.0 | 2.0 | 1000 | $2,200 | $2.20 | 14d | 1 | 1.03mi |
| 3541 Mangrove Ave Unit 8 Norfolk, VA | 2.0 | 1.0 | 900 | $1,350 | $1.50 | 23d | 1 | 1.13mi |
| 2111 Bellevue Ave Unit 1 Norfolk, VA | 2.0 | 1.0 | 950 | $1,300 | $1.37 | 43d | 1 | 1.14mi |
| 3521 Brest Ave Norfolk, VA | 3.0 | 2.0 | 1234 | $2,300 | $1.86 | 43d | 1 | 1.17mi |
| 2201 Pershing Ave Norfolk, VA | 3.0 | 2.5 | 1455 | $2,250 | $1.55 | 4d | 1 | 1.17mi |
| 3305 Herbert St Norfolk, VA | 2.0 | 1.0 | 1215 | $1,750 | $1.44 | 12d | 1 | 1.24mi |
| 3301 Vimy Ridge Ave Norfolk, VA | 4.0 | 2.0 | 1300 | $2,150 | $1.65 | 4d | 1 | 1.24mi |
| 2729 Somme Ave Norfolk, VA | 3.0 | 2.5 | 1524 | $2,295 | $1.51 | 14d | 1 | 1.24mi |
| 3801 Chatham Cir Unit 2 Norfolk, VA | 2.0 | 1.0 | 1100 | $1,350 | $1.23 | 7d | 1 | 1.29mi |
| 1320 Gabriel Dr Norfolk, VA | 4.0 | 1.5 | 1812 | $2,495 | $1.38 | 43d | 1 | 1.30mi |
| 1801 Saint Denis Ave Unit 3 Norfolk, VA | 4.0 | 2.0 | 1500 | $2,400 | $1.60 | 23d | 1 | 1.33mi |
| 1801 Lasalle Ave Norfolk, VA | 3.0 | 1.0 | 1102 | $1,880 | $1.71 | 44d | 1 | 1.35mi |
| 1403 Lead St Norfolk, VA | 4.0 | 2.5 | 1854 | $2,550 | $1.38 | 43d | 1 | 1.36mi |
| 1714 Bellevue Ave Norfolk, VA | 3.0 | 1.5 | 1500 | $1,799 | $1.20 | 43d | 1 | 1.36mi |
| 3819 Pamlico Cir Norfolk, VA | 3.0 | 1.0 | 1250 | $2,000 | $1.60 | 12d | 1 | 1.38mi |
| 5404 Douglas St Norfolk, VA | 3.0 | 1.0 | 981 | $1,950 | $1.99 | 43d | 1 | 1.38mi |
| 1225 River Oaks Dr Norfolk, VA | 3.0 | 1.5 | 1529 | $1,335 | $0.87 | 23d | 1 | 1.39mi |
Listing history 15 events
-
2026-06-18days on market $230,000 Active 31 DOM
-
2026-06-17days on market $230,000 Active 30 DOM
-
2026-06-16days on market $230,000 Active 29 DOM
-
2026-06-15days on market $230,000 Active 28 DOM
-
2026-06-13days on market $230,000 Active 26 DOM
-
2026-06-09days on market $230,000 Active 22 DOM
-
2026-06-08days on market $230,000 Active 21 DOM
-
2026-06-07days on market $230,000 Active 20 DOM
-
2026-06-03days on market $230,000 Active 16 DOM
-
2026-06-02days on market $230,000 Active 15 DOM
-
2026-06-01days on market $230,000 Active 14 DOM
-
2026-05-31days on market $230,000 Active 13 DOM
-
2026-05-18$230,000 Active
-
1984-05-31soldstatus $61,000
-
1982-06-22soldstatus $58,000
ⓘ Source: listings_history table (triggers on properties + properties_extension) + one-shot
backfill from property_details.listing_events for pre-trigger history.
Tax reassessment forecast VA · Resets to sale price
- Current annual tax
- $3,263 · $272/mo
- Projected year-2 tax
- $3,263 · $272/mo
- Expected delta
- $0/yr ($0/mo · 0.0%)
ⓘ Screening estimate from a state-policy table — verify with the county assessor before closing.
Climate risk First Street
- Flood 1/10 Low FEMA zone X (unshaded) · 0% chance over 30 yrs
- Wildfire 1/10 Low
- Heat 9/10 Extreme 7 d/yr ≥105°F today · 16 d/yr by 30 yrs out
- Wind 8/10 Severe 80% chance of damaging wind over 30 yrs
- Air quality 3/10 Moderate 2 unhealthy d/yr today · 3 by 30 yrs out
Nearby sold comps map
Loading sold comps map…
Walkable amenities ~0.75 mi
Loading nearby amenities…
Taxation est. · year 1
- Rental income
- $23,480
- − Mortgage interest
- −$12,884
- − Property taxes
- −$3,263
- − Insurance
- −$1,150
- − Repairs & maintenance
- −$1,878
- − Management
- −$1,878
- − Depreciation
- −$6,691
- Taxable loss
- −$4,264
- Est. tax savings @ 24.0%
- +$1,023
- After-tax cash flow
- $686/yr
For passive investors: Depreciation is non-cash, so a rental often shows a tax loss while cash-flowing — sheltering income. Rental losses are passive: they offset passive income freely, and up to $25,000/yr can offset ordinary (W-2) income if you actively participate and your MAGI is under $100k (phasing out to $0 by $150k); unused losses carry forward. On sale, claimed depreciation is recaptured at up to 25%, and gains may owe capital-gains tax (a 1031 exchange can defer both). Figures are a year-1 estimate at your 24.0% rate — not tax advice; consult a CPA.
Schools (NCES district)
- District
- Norfolk City Public School District
- NCES district ID
- 5102670
- Math proficiency
- 27% ▼ -44.00%
- Reading proficiency
- 56% ▼ -10.00%
- Median HH income
- $44,358
- Composite
- 35.08/100
- National rank
- #5026
- State rank
- #118 of 131 in VA
Livability — Norfolk
- Score
- 83/100
- State rank
- #43
- US rank
- #1026
Category grades
Schools grade is shown separately in the Schools card above.
Census & demographics
- Census place
- Norfolk, VA
- County
- Norfolk City · 214,042 people
- City population
- 214,042
- Metro
- Virginia Beach-Norfolk-Newport News, VA-NC
- Population (ZIP)
- 28,628
- Household income
- $68,380
- Rent vs Own
- Severe rent burden
- 1342.0
Population outlook (Norfolk County) Hauer SSP2
- Today (2025)
- 249,032 people
- By 2030
- 252,347 · +1.3%
- By 2040
- 253,644 · +1.9%
- By 2050
- 251,913 · +1.2%
- By 2075
- 245,281 · -1.5%
- By 2100
- 219,548 · -11.8%
Race, ethnicity, and origin ACS 2023
- Neighborhood character
- Diverse neighborhood (Simpson 0.63)
- Race & ethnicity
- Black 55% White 23% Hispanic / Latino 11% Two or more races 7% Asian 5%
- Hispanic origin (detail)
- Mexican 4% Puerto Rican 3%
- Common ancestry
- Romanian 1% Slovak 1% Lithuanian 0%
- Foreign-born
- 10% · Canada
- Languages at home
- 87% English-only · Spanish 6% Tagalog/Filipino 4% French/Haitian/Cajun 1%
Political lean MEDSL · Norfolk
- 2024 margin
- Solid D (+41.5) · D 70.0% · R 28.5% · Other 1.6%
- 2008→2024 swing
- -1.4pp toward R · 2008: 43.0pp · 2024: 41.5pp
- All cycles
- 2024: D+41.5 2020: D+45.6 2016: D+42.0 2012: D+44.0 2008: D+43.0
Not yet ingested
- Civics
- —
Market trends
- HPI YoY
- ▼ -33.67%
- Current HPI
- 329.2241
- Rent YoY
- ▲ 3.42%
- Metro
- Virginia Beach-Norfolk-Newport News, VA-NC
- State GDP YoY
- ▲ 2.40%
- F500 in state
- 50
Industry mix (Fortune 500 HQ in VA)
| Industry | F500 HQs | Revenue |
|---|---|---|
| Aerospace / Defense | 4 | $236B |
|
||
| Technology / Defense | 3 | $32B |
|
||
| Financial Services | 2 | $176B |
|
||
| Utilities | 2 | $27B |
|
||
| Insurance | 2 | $25B |
|
||
| Technology | 2 | $15B |
|
||
Price history
+296.6% since first listed3 events — show timeline
- 2026-05-18 Listed $230,000 REINMLS
- 1984-05-31 Sold (Public Records) $61,000 Public Records
- 1982-06-22 Sold (Public Records) $58,000 Public Records
Property tax history
+6.1%/yrLatest (2025): $3,263 · +8.5% YoY. Source: county tax records.
Cash-flow waterfall
monthlySold comps — $/sqft
last 12 mo · ≤1 miLoading sold comps…