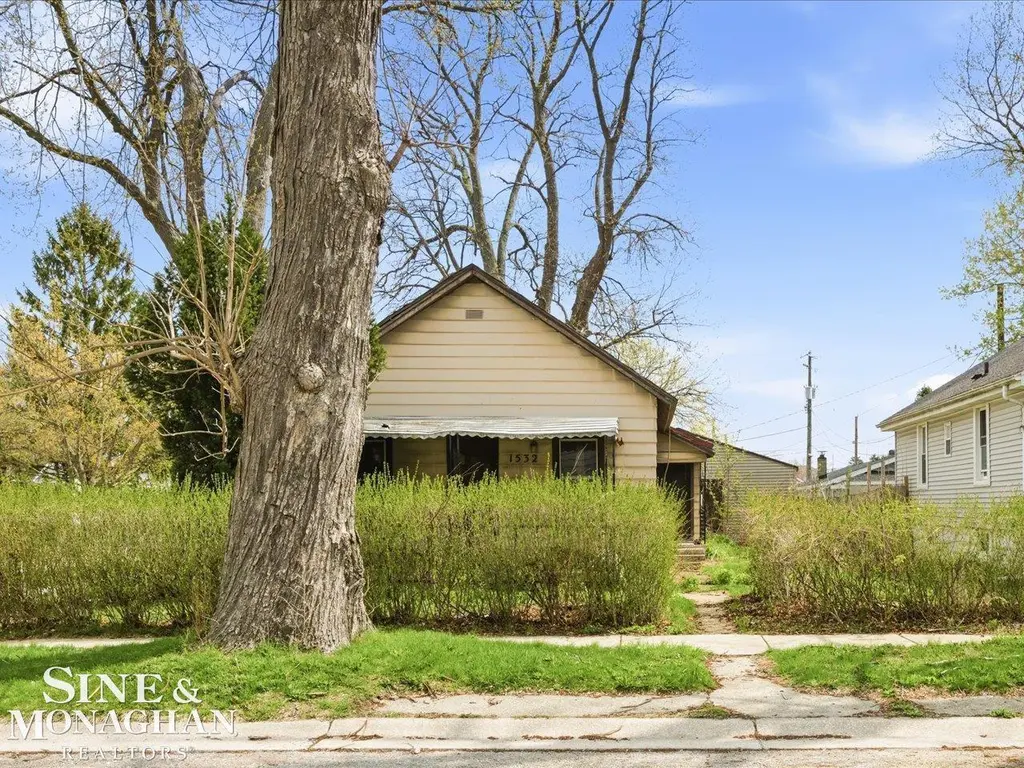
1532 Poplar St · Port Huron, MI
Flood risk 4/10 · Minor
- FEMA flood zone
- X (unshaded)
- Chance of flooding over 30 yrs
- 0.21%
- Est. flood insurance / yr
- $507 – $1,088
Fire risk 1/10 · Minimal
- Est. fire insurance / yr
- $784 – $1,456
Heat risk 3/10 · Minor
- Hot days now (above 98°F)
- 7 days/yr
- Hot days in 30 yrs
- 14 days/yr
Wind risk 1/10 · Minimal
- Chance of severe wind over 30 yrs
- —
Air-quality risk 2/10 · Minimal
- Unhealthy air days now
- 1 days/yr
- Unhealthy air days in 30 yrs
- 2 days/yr
Risk factors via First Street. Map © Google.
Why this score? — see what drove the B- grade
The composite is a weighted blend of 9 inputs, each scored 0–100. Each bar is that input's sub-score; the figure is the points it added to the 100-point composite (weight × sub-score).
- Cash flow +30.0/30.0
- 1% rule +10.0/10.0
- DSCR +10.0/10.0
- ARV discount +7.5/15.0
- Rent growth +3.4/5.0
- Livability +3.2/5.0
- Schools +2.5/10.0
- Condition / age +2.5/5.0
- Appreciation +0.0/10.0
$69,000
🖨 Deal sheet 📄 Offer letter ✓ Due diligence
Listing remarks MLS
Investor Special! This home features a double corner lot close to the expressway, restaurants, shopping and hospital. 2 car attached garage, 3 bedrooms and 1 bath, Home is in need of TLC and sold as is
Key facts
- Close to hospital
- Close to restaurants
- Double corner lot
Tags
Property features AI
Finance
- Other: Located in FORT GRATIOT MILITARY RESERVATION SUB subdivision; Corner lot dimensions approximately 50 x 100 (0.12 acres)
- HOA & community: Homeowners association present
Exterior
- Parking: Attached garage with 2 spaces
- Utilities: Public water; Public sewer
- Home design: Single-family residence; One story
- Construction: Aluminum siding; Block foundation; Block basement crawl space
- Exterior features: Front porch; City lot on a corner; Paved road frontage
Interior
- Kitchen: Dishwasher; Oven; Range; Refrigerator
- Bedrooms: Total of 3 rooms (includes bedroom count within total rooms)
- Bathrooms: 1 full bathroom
- Heating & cooling: Forced air heating (natural gas); Ceiling fan cooling
- Interior features: Gas water heater; Dishwasher; Oven; Refrigerator; Range; Ceiling fan(s)
- Laundry & utility: Gas water heater
Neighborhood map
What this means for you Summary
Snapshot
- This is a 3-bed/1.0-bath single-family listed at $69k.
Deal economics
- At list price, monthly cash flow is $558 ($7k/yr) — positive.
- The deal already cash-flows at list — no discount required.
- Meets the 1% rule at list price ($1k rent vs $69k).
- Recommended offer: $67k (3.0% below list) — sets the bar for market timing.
- Cap rate 16.0% vs local median 4.6% in Port Huron — top-decile yield for the area; either an underpriced asset or a hidden risk that comps aren't pricing in. Stress-test before assuming the spread holds.
Location & tenants
- Location reads 65/100 on livability (#445 in MI) — a middle-class / working-renter tenant base. Strengths: cost of living A+, housing A+; Watch: amenities C-, health & safety D, schools F.
- Port Huron Area School District (suburban): math 23% / reading 37% proficiency, ranked #368 of 540 in MI (top 68%) — families likely to look elsewhere, expect single-tenant / working-renter base with shorter leases.
- Market conditions: Rents rising (+3.6%/yr); 220 active listings in the ZIP; 11 comparable units currently listed for rent nearby; rentals lingering (median 44d on market — plan ~5-8 weeks vacancy on turnover, expect pricing pressure); 55% of comp listings sitting > 30 days — soft ceiling on asking rent; 232 units permitted in St. Clair County in 2024 (0 in 5+ unit buildings).
- This rent runs 31% of the median local income ($53k/yr) — at the standard rent-burdened threshold; future hikes will face affordability resistance.
Forward outlook
- Local home prices are declining (-3.0%/yr); year-one equity from $477 of loan paydown is wiped out by about $2k of value loss. Plan a longer hold.
- St. Clair County population projected at -20% by 2050 — secular population decline; favor cash flow + early exit over multi-decade hold.
- At projected returns (-3.0% appreciation + 3.6% rent growth), your $19k cash investment doubles in ~4 years — after that, you're playing with house money.
Negotiation context
- It's been on market 56 days — a 3% lower offer ($67k) is reasonable based on typical stale-listing flexibility.
- 3 sale attempts; this cycle's ask has dropped $10k (13%) from the opening price — seller is motivated, your offer sets the floor, not the list.
Risks & watch-outs
- Watch-outs: built in 1902 — expect roof / HVAC / electrical / plumbing capex.
Questions for the listing agent
- It's been on market 56 days. Have you received any prior offers? Is the seller open to a 3% concession, seller financing, or rate buy-down credit?
- Built in 1902 — when were the roof, HVAC, electrical panel, plumbing, and water heater last replaced?
- Is there a deadline driving the sale (1031 exchange, divorce, estate, relocation)? That informs how much negotiation room exists.
- Schools are F-rated, which usually means shorter tenancies and higher turnover. Who's the typical renter profile here, and what's been the actual vacancy rate?
- Crime grade is F in this area — have there been break-ins, vandalism, or insurance claims at this property in the last 3 years? What carrier currently insures it and at what premium?
- What's the average days-on-market for RENTAL listings here right now (not sales)? A rising rental-DOM trend means longer vacancies and softer asking-rent achievability than the comps imply.
- What's the recent tenant-quality profile in this submarket — average credit score on applications, eviction rate, late-payment / NSF rate, and stable-employment percentage? A property-management company in the area should have these aggregated.
- How much new for-sale + rental construction is in the pipeline within 1–3 miles? Heavy new supply typically softens prices + rents 12–24 months out; constrained supply supports both.
Investment metrics
- 1% rule
- 1.96% ✓
- Cap rate
- 16.00%
- Cash-on-cash
- 34.68%
- DSCR
- 2.54
- GRM
- 4.3
CMA / ARV
- ARV (median comp)
- $153,993
- List price
- $69,000
- Delta
- -55.19%
- Verdict
- UNDERPRICED
- Comps
- 20 within 1.0 mi
Show comp detail 12 sales within ~0.75 mi
| Address | Dist | Beds/Ba | Sqft | Sold | Price | $/sf | Match |
|---|---|---|---|---|---|---|---|
| 1523 Elk St | 0.03mi | 3/2.0 | 1,240 (-1%) | 2mo | $175,000 | $141 | 92 |
| 1507 Elk St | 0.05mi | 3/1.0 | 1,118 (-10%) | 3mo | $205,000 | $183 | 78 |
| 1691 Mcbrady St | 0.44mi | 3/2.0 | 1,254 (+0%) | 7mo | $200,000 | $159 | 69 |
| 923 Stone St | 0.49mi | 3/1.0 | 1,255 (+1%) | 10mo | $123,000 | $98 | 68 |
| 1409 Kearney St | 0.31mi | 2/1.0 (-1) | 1,101 (-12%) | 0mo | $105,000 | $95 | 61 |
| 822 Saint Clair St | 0.60mi | 3/1.5 | 1,204 (-4%) | 7mo | $165,000 | $137 | 58 |
| 1819 Riverside Dr | 0.51mi | 2/2.0 (-1) | 1,200 (-4%) | 5mo | $430,000 | $358 | 57 |
| 717 Superior St | 0.72mi | 3/1.0 | 1,212 (-3%) | 9mo | $30,000 | $25 | 54 |
| 2115 Willow St | 0.46mi | 3/1.0 | 1,106 (-11%) | 9mo | $146,000 | $132 | 52 |
| 713 Rawlins St | 0.53mi | 3/1.0 | 1,082 (-13%) | 6mo | $160,000 | $148 | 48 |
| 819 Stone St | 0.57mi | 4/1.0 (+1) | 1,140 (-9%) | 8mo | $99,900 | $88 | 47 |
| 2401 Walnut St | 0.66mi | 4/1.0 (+1) | 1,373 (+10%) | 5mo | $165,000 | $120 | 44 |
Match score weights: distance 35% · size 25% · config 20% · recency 20%. Top-matched comps best support the ARV.
Projected returns pro-forma
-3.0% appreciation · 3.61% rent growth · sell at horizon
- IRR
- 30.9%
- Equity multiple
- 2.31×
- Total profit
- $25,258
- Equity at exit
- $10,288
- IRR
- 38.5%
- Equity multiple
- 4.70×
- Total profit
- $71,419
- Equity at exit
- $5,966
Cash invested: $19,320 (down + closing). Projections, not guarantees.
Landlord ↔ Tenant lean methodology
- Overall (STATE)
- 62 Landlord-Friendly
- State Michigan
- 62 Landlord-Friendly · EVEN
- County
- — inherits STATE
- City
- — inherits STATE
ZIP-level market 48060
- Rents YoY
- 3.6%
- Active inventory
- 220
- Price-to-rent
- 4.3×
Monthly cashflow live
- Estimated rent
- $1,351 high interval (Pro) →
- Mortgage (P&I)
- −$362
- Tax from tax record
- −$118 /mo · $1,421/yr
- Insurance
- −$29
- HOA
- −$0
- Vacancy / Maint / Mgmt
- −$284
- Net cashflow
- $558
Break-even live
UW: 25.0% down · 7.5% · 30yr · 1.5% tax · 5.0% vac · 8.0% maint · 8.0% mgmt
Financing live
Cash to close
- Down payment
- $17,250
- Closing costs
- $2,070
- Reserves months
- —
- Total cash needed
- —
Loan-product check · same deal, 3 products live
Conventional
25% down · 7.5% · 30yr
- Down + closing
- —
- Monthly P&I
- —
- Monthly cashflow
- —
- DSCR
- —
- Eligible?
- —
Personal DTI + credit; lowest rate.
DSCR
20% down · 8.5% · 30yr
- Down + closing
- —
- Monthly P&I
- —
- Monthly cashflow
- —
- DSCR
- —
- Eligible?
- —
No personal income docs; deal must DSCR.
Hard money
10% down · 12.0% · 12mo
- Down + closing
- —
- Monthly P&I
- —
- Monthly cashflow
- —
- DSCR
- —
- Eligible?
- —
Short-term bridge; refi at stabilization.
Rent comps 11 comps
| Address | Beds | Baths | Sqft | Rent | $/sqft | DOM | Units | Dist |
|---|---|---|---|---|---|---|---|---|
| 909 Stone St Unit 1 Port Huron, MI | 3.0 | 1.0 | 1100 | $1,250 | $1.14 | 44d | 1 | 0.53mi |
| 145 Rural St Unit 145 Port Huron, MI | 2.0 | 1.5 | 950 | $1,190 | $1.25 | 24d | 1 | 0.88mi |
| 2622 Maple St Port Huron, MI | 2.0 | 1.0 | 1200 | $1,050 | $0.88 | 44d | 1 | 0.88mi |
| 1820 Kern St Port Huron, MI | 2.0 | 1.0 | 950 | $1,000 | $1.05 | 24d | 1 | 0.93mi |
| 2849 15th Ave Port Huron, MI | 1.0–2.0 | 1.0 | 1140 | $1,995 | $1.75 | 2d | 4 | 1.05mi |
| 218 Huron Ave Apt 204 Port Huron, MI | 2.0 | 2.0 | 1086 | $1,700 | $1.57 | 44d | 1 | 1.09mi |
| 218 Huron Ave Unit 303 Port Huron, MI | 2.0 | 2.0 | 1239 | $1,600 | $1.29 | 44d | 1 | 1.09mi |
| 1613 Lapeer Ave Unit 2 Port Huron, MI | 2.0 | 1.0 | 800 | $875 | $1.09 | 44d | 1 | 1.09mi |
| 208 Huron Ave Unit 202-2B Port Huron, MI | 2.0 | 2.0 | 1096 | $1,600 | $1.46 | 44d | 1 | 1.09mi |
| 937 Howard St Port Huron, MI | 3.0 | 1.0 | 1080 | $1,500 | $1.39 | 18d | 1 | 1.13mi |
| 619 Taylor St Port Huron, MI | 2.0–3.0 | 1.0–1.5 | 716 | $900 | $1.26 | 2d | 1 | 1.38mi |
Listing history 18 events
-
2026-06-18days on market $69,000 Active 56 DOM
-
2026-06-17days on market $69,000 Active 55 DOM
-
2026-06-16days on market $69,000 Active 54 DOM
-
2026-06-15days on market $69,000 Active 53 DOM
-
2026-06-13days on market $69,000 Active 51 DOM
-
2026-06-13days on market $69,000 Active 50 DOM
-
2026-06-09days on market $69,000 Active 47 DOM
-
2026-06-08days on market $69,000 Active 46 DOM
-
2026-06-07days on market $69,000 Active 45 DOM
-
2026-06-04days on market $69,000 Active 42 DOM
-
2026-06-03days on market $69,000 Active 41 DOM
-
2026-06-02days on market $69,000 Active 40 DOM
-
2026-06-01days on market $69,000 Active 39 DOM
-
2026-05-31days on market $69,000 Active 38 DOM
-
2026-05-01status Active 201-char remark
Show marketing remark (201 chars)
Investor Special! This home features a double corner lot close to the expressway, restaurants, shopping and hospital. 2 car attached garage, 3 bedrooms and 1 bath, Home is in need of TLC and sold as is
-
2026-05-01status Pending 201-char remark
Show marketing remark (201 chars)
Investor Special! This home features a double corner lot close to the expressway, restaurants, shopping and hospital. 2 car attached garage, 3 bedrooms and 1 bath, Home is in need of TLC and sold as is
-
2026-04-23$79,000 Active 201-char remark
Show marketing remark (201 chars)
Investor Special! This home features a double corner lot close to the expressway, restaurants, shopping and hospital. 2 car attached garage, 3 bedrooms and 1 bath, Home is in need of TLC and sold as is
-
2026-04-23$79,000 Active 201-char remark
Show marketing remark (201 chars)
Investor Special! This home features a double corner lot close to the expressway, restaurants, shopping and hospital. 2 car attached garage, 3 bedrooms and 1 bath, Home is in need of TLC and sold as is
ⓘ Source: listings_history table (triggers on properties + properties_extension) + one-shot
backfill from property_details.listing_events for pre-trigger history.
Tax reassessment forecast MI · Partial reset (capped growth)
- Current annual tax
- $1,421 · $118/mo
- Projected year-2 tax
- $1,421 · $118/mo
- Expected delta
- $0/yr ($0/mo · 0.0%)
ⓘ Screening estimate from a state-policy table — verify with the county assessor before closing.
Climate risk First Street
- Flood 4/10 Moderate FEMA zone X (unshaded) · 21% chance over 30 yrs
- Wildfire 1/10 Low
- Heat 3/10 Moderate 7 d/yr ≥98°F today · 14 d/yr by 30 yrs out
- Wind 1/10 Low
- Air quality 2/10 Low 1 unhealthy d/yr today · 2 by 30 yrs out
Nearby sold comps map
Loading sold comps map…
Walkable amenities ~0.75 mi
Loading nearby amenities…
Taxation est. · year 1
- Rental income
- $16,214
- − Mortgage interest
- −$3,865
- − Property taxes
- −$1,421
- − Insurance
- −$345
- − Repairs & maintenance
- −$1,297
- − Management
- −$1,297
- − Depreciation
- −$2,007
- Taxable income
- $5,981
- Est. tax owed @ 24.0%
- −$1,436
- After-tax cash flow
- $5,265/yr
For passive investors: Depreciation is non-cash, so a rental often shows a tax loss while cash-flowing — sheltering income. Rental losses are passive: they offset passive income freely, and up to $25,000/yr can offset ordinary (W-2) income if you actively participate and your MAGI is under $100k (phasing out to $0 by $150k); unused losses carry forward. On sale, claimed depreciation is recaptured at up to 25%, and gains may owe capital-gains tax (a 1031 exchange can defer both). Figures are a year-1 estimate at your 24.0% rate — not tax advice; consult a CPA.
Schools (NCES district)
- District
- Port Huron Area School District
- NCES district ID
- 2628830
- Math proficiency
- 23% ▼ -5.00%
- Reading proficiency
- 37% ▼ -2.00%
- Median HH income
- $42,093
- Composite
- 25.4/100
- National rank
- #7462
- State rank
- #368 of 540 in MI
Livability — Port Huron
- Score
- 65/100
- State rank
- #445
- US rank
- #12478
Category grades
Schools grade is shown separately in the Schools card above.
Census & demographics
- Census place
- Port Huron, MI
- County
- Saint Clair County · 44,760 people
- City population
- 39,342
- Metro
- Detroit-Warren-Dearborn, MI
- Population (ZIP)
- 39,342
- Household income
- $53,018
- Rent vs Own
- Severe rent burden
- 1808.0
Population outlook (St. Clair County) Hauer SSP2
- Today (2025)
- 154,587 people
- By 2030
- 150,031 · -2.9%
- By 2040
- 138,177 · -10.6%
- By 2050
- 124,390 · -19.5%
- By 2075
- 95,825 · -38.0%
- By 2100
- 68,672 · -55.6%
Race, ethnicity, and origin ACS 2023
- Neighborhood character
- Predominantly White (80%)
- Race & ethnicity
- White 80% Black 7% Two or more races 7% Hispanic / Latino 6%
- Hispanic origin (detail)
- Mexican 4%
- Common ancestry
- Romanian 6% Lithuanian 4% Slovak 3%
- Foreign-born
- 2% · Canada
- Languages at home
- 97% English-only · Spanish 2%
Political lean MEDSL · St. Clair
- 2024 margin
- Solid R (+34.6) · D 32.0% · R 66.6% · Other 1.4%
- 2008→2024 swing
- -37.3pp toward R · 2008: 2.6pp · 2024: -34.6pp
- All cycles
- 2024: R+34.6 2020: R+30.2 2016: R+31.4 2012: R+7.1 2008: D+2.6
Not yet ingested
- Civics
- —
Market trends
- HPI YoY
- ▼ -134.75%
- Current HPI
- 177.2401
- Rent YoY
- ▲ 3.61%
- Metro
- Detroit-Warren-Dearborn, MI
- State GDP YoY
- ▲ 1.37%
- F500 in state
- 28
Industry mix (Fortune 500 HQ in MI)
| Industry | F500 HQs | Revenue |
|---|---|---|
| Automotive Parts | 3 | $48B |
|
||
| Automotive | 2 | $372B |
|
||
| Chemicals | 1 | $45B |
|
||
| Automotive Retail | 1 | $29B |
|
||
| Healthcare / Medical Devices | 1 | $23B |
|
||
| Automotive Technology | 1 | $20B |
|
||
Price history
-12.7% since first listed6 events — show timeline
- 2026-05-20 Price Changed $69,000 MiRealSource-MiMLS
- 2026-05-20 Price Changed $69,000 REALCOMP
- 2026-05-01 Relisted — MiRealSource-MiMLS
- 2026-05-01 Pending — MiRealSource-MiMLS
- 2026-04-23 Listed $79,000 REALCOMP
- 2026-04-23 Listed $79,000 MiRealSource-MiMLS
Property tax history
+5.1%/yrLatest (2025): $1,421 · +2.9% YoY. Source: county tax records.
Cash-flow waterfall
monthlySold comps — $/sqft
last 12 mo · ≤1 miLoading sold comps…