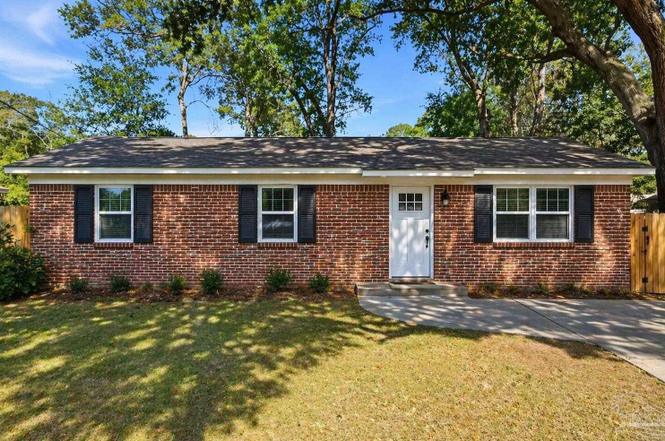
6210 Long St · Milton, FL
Flood risk No data
- FEMA flood zone
- —
- Chance of flooding over 30 yrs
- —
- Est. flood insurance / yr
- —
Fire risk No data
- Est. fire insurance / yr
- —
Heat risk No data
- Hot days now (above threshold)
- —
- Hot days in 30 yrs
- —
Wind risk No data
- Chance of severe wind over 30 yrs
- —
Air-quality risk No data
- Unhealthy air days now
- —
- Unhealthy air days in 30 yrs
- —
Risk factors via First Street. Map © Google.
Why this score? — see what drove the D+ grade
The composite is a weighted blend of 9 inputs, each scored 0–100. Each bar is that input's sub-score; the figure is the points it added to the 100-point composite (weight × sub-score).
- Cash flow +18.6/30.0
- ARV discount +6.6/15.0
- DSCR +5.8/10.0
- Schools +5.3/10.0
- 1% rule +3.9/10.0
- Livability +3.9/5.0
- Rent growth +3.2/5.0
- Condition / age +2.5/5.0
- Appreciation +0.0/10.0
$209,900
🖨 Deal sheet 📄 Offer letter ✓ Due diligence
Listing remarks MLS
Completely Remodeled – Everything is Brand New! The theme of this home is new! This 3-bedroom, 1-bath home in the heart of Milton has been completely renovated from top to bottom, offering modern upgrades while maintaining its solid structure. Conveniently located just minutes from Highway 90, I-10, and downtown Milton, this home is move-in ready with no detail overlooked. Inside, every inch has been updated with new windows, new wiring, new plumbing, new HVAC system, new luxury vinyl plank flooring, new interior paint, and all-new fixtures. The kitchen shines with new cabinetry, stunning stone countertops, sleek new appliances, and a stylish white tile backsplash. The bathroom is equally impressive, featuring a fully tiled shower tub combo, tiled floors, a new vanity, and updated plumbing. The exterior boasts freshly laid sod and new landscaping, enhancing the home’s curb appeal. With all major systems upgraded, this home offers worry-free living with brand-new everything at a lower price than some of the new builds in the area! Don’t miss your chance to own a fully remodeled home in a prime location. Schedule your showing today!
Key facts
- White cabinets
- Large laundry room
- Granite countertops
Tags
Property features AI
Finance
- Other: Paved, county-maintained road access; Green/energy-efficient features: heat pump, insulation, insulated floors, insulated walls, ridge vent
- HOA & community: No association
Exterior
- Parking: Driveway with open parking
- Utilities: Public water; Septic tank sewer; Copper electrical wiring; Cable available
- Home design: Single-story (one level); Not attached to another property; Resale property; Frame construction
- Construction: Off-grade foundation; Shingle roof
- Exterior features: Full backyard fencing; Back yard fenced area; Patio
Interior
- Kitchen: Fully renovated kitchen (updated within the last 1–5 years); Granite counters; Built-in microwave; Dishwasher; Refrigerator; Electric water heater
- Bedrooms: Primary bedroom on the first floor; Additional bedrooms on the first floor
- Flooring: Tile flooring
- Bathrooms: One full bathroom, fully renovated (updated within the last 1–5 years)
- Heating & cooling: Heat pump heating and cooling; Ceiling fans for additional cooling
- Interior features: Baseboards; Ceiling fan(s); Insulated doors; Double-pane windows with blinds
- Laundry & utility: Laundry inside
Neighborhood map
What this means for you Summary
Snapshot
- This is a 3-bed/1.0-bath single-family listed at $210k.
Deal economics
- At list price, monthly cash flow is $202 ($2k/yr) — positive.
- The deal already cash-flows at list — no discount required.
- To meet the 1% rule (rent ≥ 1% of price), the offer needs to be $187k (10.8% below list).
- Recommended offer: $185k (12.0% below list) — sets the bar for market timing.
- Cap rate 7.4% vs local median 4.6% in Milton — top-decile yield for the area; either an underpriced asset or a hidden risk that comps aren't pricing in. Stress-test before assuming the spread holds.
Location & tenants
- Location reads 78/100 on livability (#166 in FL, #2,480 nationally) — a middle-class / working-renter tenant base. Strengths: cost of living A+, housing A+, health & safety A+; Watch: amenities D-, commute F.
- Santa Rosa (suburban): math 63% / reading 60% proficiency, ranked #8 of 73 in FL (top 11%) — acceptable for families but not a draw, mixed tenant base, ~2y average lease.
- Market conditions: Rents rising (+2.7%/yr); 360 active listings in the ZIP; 4 comparable units currently listed for rent nearby; rentals leasing fast (median 14d on market — plan ~1-2 weeks tenant-placement turnaround); solid renter incomes; 1,983 units permitted in Santa Rosa County in 2024 (128 in 5+ unit buildings).
Forward outlook
- Local home prices are declining (-3.0%/yr); year-one equity from $1k of loan paydown is wiped out by about $6k of value loss. Plan a longer hold.
- Santa Rosa County population projected at +31% by 2050 — long-run rental-demand tailwind backs the buy-and-hold thesis.
Negotiation context
- It's been on market 126 days — a 12% lower offer ($185k) is reasonable based on typical stale-listing flexibility.
- 5 sale attempts with the ask held roughly flat each time — persistent listings suggest the price (not the market) is what's stuck; bring a comps-based counter.
Questions for the listing agent
- It's been on market 126 days. Have you received any prior offers? Is the seller open to a 12% concession, seller financing, or rate buy-down credit?
- Built in 1971 — when were the roof, HVAC, electrical panel, plumbing, and water heater last replaced?
- Why hasn't it sold? Are there any deal-killer items the seller is aware of (foundation, flood, title, zoning, code violations)?
- Is there a deadline driving the sale (1031 exchange, divorce, estate, relocation)? That informs how much negotiation room exists.
- Schools are B-rated — typically a magnet for longer-tenancy family renters. What's the average tenant stay here, and is there a school-zone premium baked into asking?
- The area grade is low — what's the realistic commute time and amenity access for the typical tenant pool here? Any planned neighborhood developments (good or bad) we should know about?
- What's the average days-on-market for RENTAL listings here right now (not sales)? A rising rental-DOM trend means longer vacancies and softer asking-rent achievability than the comps imply.
- What's the recent tenant-quality profile in this submarket — average credit score on applications, eviction rate, late-payment / NSF rate, and stable-employment percentage? A property-management company in the area should have these aggregated.
- How much new for-sale + rental construction is in the pipeline within 1–3 miles? Heavy new supply typically softens prices + rents 12–24 months out; constrained supply supports both.
Investment metrics
- 1% rule
- 0.89% ✗
- Cap rate
- 7.45%
- Cash-on-cash
- 4.13%
- DSCR
- 1.18
- GRM
- 9.3
CMA / ARV
- ARV (on-the-fly)
- $205,875
- Comps found
- 11
Show comp detail 11 sales within ~0.75 mi
| Address | Dist | Beds/Ba | Sqft | Sold | Price | $/sf | Match |
|---|---|---|---|---|---|---|---|
| 6225 St Ann Ave | 0.03mi | 3/2.0 | 1,125 (0%) | 21mo | $203,000 | $180 | 77 |
| 6280 Long St | 0.18mi | 3/2.0 | 1,178 (+5%) | 9mo | $219,900 | $187 | 72 |
| 6276 Long St | 0.17mi | 3/2.0 | 1,178 (+5%) | 10mo | $215,000 | $183 | 72 |
| 6288 Long St | 0.19mi | 3/2.0 | 1,227 (+9%) | 3mo | $249,900 | $204 | 70 |
| 6285 Long St | 0.19mi | 3/2.0 | 1,173 (+4%) | 15mo | $214,900 | $183 | 68 |
| 6289 Long St | 0.21mi | 3/2.0 | 1,173 (+4%) | 14mo | $214,900 | $183 | 67 |
| 6328 Simpson St | 0.29mi | 3/2.0 | 1,204 (+7%) | 6mo | $224,900 | $187 | 66 |
| 6452 Open Rose Dr | 0.64mi | 3/1.0 | 1,210 (+8%) | 2mo | $204,900 | $169 | 56 |
| 5116 Nekole Dr | 0.37mi | 2/1.0 (-1) | 1,000 (-11%) | 14mo | $215,000 | $215 | 47 |
| 5134 Cora St | 0.39mi | 3/1.5 | 1,248 (+11%) | 19mo | $218,000 | $175 | 46 |
| 6414 Hamilton Bridge Rd | 0.67mi | 3/1.0 | 1,255 (+12%) | 5mo | $170,000 | $135 | 45 |
Match score weights: distance 35% · size 25% · config 20% · recency 20%. Top-matched comps best support the ARV.
Projected returns pro-forma
-3.0% appreciation · 2.7% rent growth · sell at horizon
- IRR
- -10.2%
- Equity multiple
- 0.63×
- Total profit
- $-21,776
- Equity at exit
- $31,297
- IRR
- -1.3%
- Equity multiple
- 0.91×
- Total profit
- $-4,997
- Equity at exit
- $18,148
Cash invested: $58,772 (down + closing). Projections, not guarantees.
Landlord ↔ Tenant lean methodology
- Overall (STATE)
- 87 Strongly Landlord-Friendly
- State Florida
- 87 Strongly Landlord-Friendly · R+3
- County
- — inherits STATE
- City
- — inherits STATE
ZIP-level market 32570
- Home prices YoY
- -15.1%
- Rents YoY
- 2.7%
- Active inventory
- 360
- Price-to-rent
- 9.3×
Monthly cashflow live
- Estimated rent
- $1,871 medium interval (Pro) →
- Mortgage (P&I)
- −$1,101
- Tax from tax record
- −$88 /mo · $1,056/yr
- Insurance
- −$87
- HOA
- −$0
- Vacancy / Maint / Mgmt
- −$393
- Net cashflow
- $202
Break-even live
UW: 25.0% down · 7.5% · 30yr · 1.5% tax · 5.0% vac · 8.0% maint · 8.0% mgmt
Financing live
Cash to close
- Down payment
- $52,475
- Closing costs
- $6,297
- Reserves months
- —
- Total cash needed
- —
Loan-product check · same deal, 3 products live
Conventional
25% down · 7.5% · 30yr
- Down + closing
- —
- Monthly P&I
- —
- Monthly cashflow
- —
- DSCR
- —
- Eligible?
- —
Personal DTI + credit; lowest rate.
DSCR
20% down · 8.5% · 30yr
- Down + closing
- —
- Monthly P&I
- —
- Monthly cashflow
- —
- DSCR
- —
- Eligible?
- —
No personal income docs; deal must DSCR.
Hard money
10% down · 12.0% · 12mo
- Down + closing
- —
- Monthly P&I
- —
- Monthly cashflow
- —
- DSCR
- —
- Eligible?
- —
Short-term bridge; refi at stabilization.
Rent comps 4 comps
| Address | Beds | Baths | Sqft | Rent | $/sqft | DOM | Units | Dist |
|---|---|---|---|---|---|---|---|---|
| 6436 Highway 90 Milton, FL | 2.0 | 1.0 | 512 | $1,395 | $2.72 | 13d | 8 | 0.57mi |
| 5461 Collins Mill Creek Dr Milton, FL | 2.0 | 2.0 | 950 | $1,672 | $1.76 | 13d | 4 | 1.14mi |
| 5357 Locklin Ave Milton, FL | 3.0 | 1.0 | 1100 | $1,700 | $1.55 | 13d | 1 | 1.16mi |
| 5837 Berryhill Rd Milton, FL | 3.0 | 2.0 | 1131 | $1,950 | $1.72 | 21d | 1 | 1.48mi |
Listing history 16 events
-
2026-06-18days on market $209,900 Active 126 DOM
-
2026-06-17days on market $209,900 Active 125 DOM
-
2026-06-16days on market $209,900 Active 124 DOM
-
2026-06-15days on market $209,900 Active 123 DOM
-
2026-06-14pricedays on market $209,900 Active 121 DOM
-
2026-06-10days on market $214,500 Active 118 DOM
-
2026-06-09days on market $214,500 Active 117 DOM
-
2026-06-08days on market $214,500 Active 116 DOM
-
2026-06-07days on market $214,500 Active 115 DOM
-
2026-06-05days on market $214,500 Active 112 DOM
-
2026-06-03days on market $214,500 Active 111 DOM
-
2026-06-02days on market $214,500 Active 110 DOM
-
2026-06-01days on market $214,500 Active 109 DOM
-
2026-05-31days on market $214,500 Active 108 DOM
-
2026-05-31remarks 693-char remark
-
2026-05-31$214,500 Active 107 DOM
ⓘ Source: listings_history table (triggers on properties + properties_extension) + one-shot
backfill from property_details.listing_events for pre-trigger history.
Tax reassessment forecast FL · Resets to sale price
- Current annual tax
- $1,056 · $88/mo
- Projected year-2 tax
- $1,742 · $145/mo
- Expected delta
- +$686/yr (+$57/mo · 64.9%)
ⓘ Screening estimate from a state-policy table — verify with the county assessor before closing.
Nearby sold comps map
Loading sold comps map…
Walkable amenities ~0.75 mi
Loading nearby amenities…
Taxation est. · year 1
- Rental income
- $22,457
- − Mortgage interest
- −$11,758
- − Property taxes
- −$1,056
- − Insurance
- −$1,050
- − Repairs & maintenance
- −$1,797
- − Management
- −$1,797
- − Depreciation
- −$6,106
- Taxable loss
- −$1,106
- Est. tax savings @ 24.0%
- +$265
- After-tax cash flow
- $2,692/yr
For passive investors: Depreciation is non-cash, so a rental often shows a tax loss while cash-flowing — sheltering income. Rental losses are passive: they offset passive income freely, and up to $25,000/yr can offset ordinary (W-2) income if you actively participate and your MAGI is under $100k (phasing out to $0 by $150k); unused losses carry forward. On sale, claimed depreciation is recaptured at up to 25%, and gains may owe capital-gains tax (a 1031 exchange can defer both). Figures are a year-1 estimate at your 24.0% rate — not tax advice; consult a CPA.
Schools (NCES district)
- District
- Santa Rosa
- NCES district ID
- 1201650
- Math proficiency
- 63% ▼ -6.00%
- Reading proficiency
- 60% ▼ -5.00%
- Median HH income
- $58,161
- Composite
- 53.12/100
- National rank
- #1511
- State rank
- #8 of 73 in FL
Livability — Milton
- Score
- 78/100
- State rank
- #166
- US rank
- #2480
Category grades
Schools grade is shown separately in the Schools card above.
Census & demographics
- County
- Santa Rosa County · 194,764 people
- City population
- 69,025
- Metro
- Pensacola-Ferry Pass-Brent, FL
- Population (ZIP)
- 37,197
- Household income
- $77,222
- Rent vs Own
- Severe rent burden
- 590.0
Population outlook (Santa Rosa County) Hauer SSP2
- Today (2025)
- 195,978 people
- By 2030
- 209,782 · +7.0%
- By 2040
- 235,293 · +20.1%
- By 2050
- 256,408 · +30.8%
- By 2075
- 298,074 · +52.1%
- By 2100
- 303,216 · +54.7%
Race, ethnicity, and origin ACS 2023
- Neighborhood character
- Predominantly White (80%)
- Race & ethnicity
- White 80% Two or more races 7% Black 6% Hispanic / Latino 6% Asian 1%
- Hispanic origin (detail)
- Mexican 2% Puerto Rican 2%
- Common ancestry
- Italian 4% Lithuanian 3% Portuguese 2%
- Foreign-born
- 4% · Canada
- Languages at home
- 94% English-only · Spanish 4% Other Asian/Pacific 1%
Political lean MEDSL · Santa Rosa
- 2024 margin
- Solid R (+51.0) · D 24.1% · R 75.0%
- 2008→2024 swing
- -3.0pp toward R · 2008: -47.9pp · 2024: -51.0pp
- All cycles
- 2024: R+51.0 2020: R+46.5 2016: R+53.5 2012: R+52.6 2008: R+47.9
Not yet ingested
- Civics
- —
Market trends
- HPI YoY
- ▼ -51.06%
- Current HPI
- 287.7469
- Rent YoY
- ▲ 2.70%
- Metro
- Pensacola-Ferry Pass-Brent, FL
- State GDP YoY
- ▲ 3.28%
- F500 in state
- 36
Industry mix (Fortune 500 HQ in FL)
| Industry | F500 HQs | Revenue |
|---|---|---|
| Industrial Technology | 2 | $29B |
|
||
| Insurance | 2 | $17B |
|
||
| Retail | 1 | $60B |
|
||
| Technology Distribution | 1 | $58B |
|
||
| Homebuilding | 1 | $35B |
|
||
| Technology Manufacturing | 1 | $35B |
|
||
Price history
+550.0% since first listed17 events — show timeline
- 2026-05-30 Relisted — PARMLS
- 2026-05-30 Price Changed $214,500 PARMLS
- 2026-05-14 Listing Removed — PARMLS
- 2026-03-13 Relisted — PARMLS
- 2026-02-28 Contingent — PARMLS
- 2026-01-27 Listed $215,000 PARMLS
- 2025-03-14 Relisted — PARMLS
- 2025-03-13 Sold (Public Records) $229,000 Public Records
- 2025-03-13 Sold (MLS) $229,000 PARMLS
- 2025-02-27 Contingent — PARMLS
- 2025-02-14 Listed $208,900 PARMLS
- 2024-08-08 Sold (Public Records) $90,000 Public Records
- 2024-04-15 Sold (Public Records) $72,000 Public Records
- 2013-10-18 Sold (Public Records) $9,500 Public Records
- 1997-01-06 Sold (Public Records) $25,500 Public Records
- 1996-03-19 Sold (Public Records) $29,600 Public Records
- 1994-08-23 Sold (Public Records) $33,000 Public Records
Property tax history
+8.9%/yrLatest (2025): $1,056 · +116.4% YoY. Source: county tax records.
Cash-flow waterfall
monthlySold comps — $/sqft
last 12 mo · ≤1 miLoading sold comps…