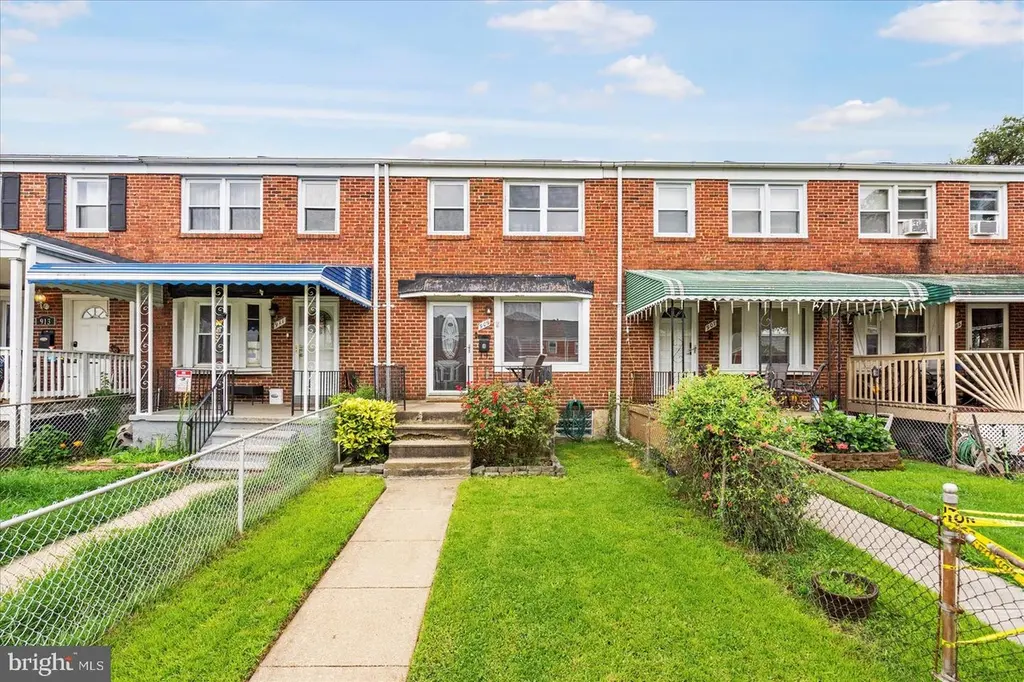
909 Arncliffe Rd · Essex, MD
Flood risk 1/10 · Minimal
- FEMA flood zone
- X (unshaded)
- Chance of flooding over 30 yrs
- 0.0%
- Est. flood insurance / yr
- $473 – $860
Fire risk 1/10 · Minimal
- Est. fire insurance / yr
- $755 – $1,403
Heat risk 8/10 · Major
- Hot days now (above 104°F)
- 7 days/yr
- Hot days in 30 yrs
- 15 days/yr
Wind risk 6/10 · Moderate
- Chance of severe wind over 30 yrs
- 27.0%
Air-quality risk 5/10 · Moderate
- Unhealthy air days now
- 6 days/yr
- Unhealthy air days in 30 yrs
- 8 days/yr
Risk factors via First Street. Map © Google.
Why this score? — see what drove the C- grade
The composite is a weighted blend of 9 inputs, each scored 0–100. Each bar is that input's sub-score; the figure is the points it added to the 100-point composite (weight × sub-score).
- Cash flow +20.7/30.0
- ARV discount +8.5/15.0
- DSCR +6.6/10.0
- 1% rule +5.5/10.0
- Livability +4.0/5.0
- Rent growth +2.8/5.0
- Condition / age +2.5/5.0
- Schools +2.3/10.0
- Appreciation +0.0/10.0
$200,000
🖨 Deal sheet (PDF) 📄 Offer letter ✓ Due diligence
Listing remarks
Beautifully maintained and move-in ready 3BR/1BA brick Townhome located on a pristinely manicured lot in the quiet neighborhood of Middlesex. Make your way through the gated front yard past a lush green lawn on the way to the front porch of your forever home. Step inside to a home filled with natural light, hardwood floors, and an open main floor plan. The main floor offers a large living room, spacious dining room, and kitchen. The dining room is separated from the kitchen by a half wall ideal when entertaining. The kitchen features plenty of cabinets with open shelving, stainless steel appliances, granite countertops, and a deep stainless sink. On the second floor are two sizable secondar
Key facts
- Lush green lawn
- Gated front yard
- Natural light
Tags
Property features AI
Exterior
- Parking: On-street parking
- Utilities: Public water; Public sewer; Electric service
- Home design: Interior townhouse/rowhouse; Fee simple ownership
- Construction: Brick construction; Block foundation; Shingle/composite roof
- Exterior features: No tidal water
Interior
- Bedrooms: Three bedrooms on the first upper level
- Bathrooms: One full bathroom (all upper levels)
- Heating & cooling: Forced air heating (natural gas); Central air conditioning (electric); Natural gas hot water
- Interior features: Partially finished basement
Neighborhood map
What this means for you Summary
Snapshot
- This is a 3-bed/1.0-bath townhouse listed at $200k.
Deal economics
- At list price, monthly cash flow is $270 ($3k/yr) — positive.
- The deal already cash-flows at list — no discount required.
- Meets the 1% rule at list price ($2k rent vs $200k).
- Cap rate 7.9% vs local median 4.9% in Essex — top-decile yield for the area; either an underpriced asset or a hidden risk that comps aren't pricing in. Stress-test before assuming the spread holds.
Location & tenants
- Location reads 79/100 on livability (#60 in MD, #2,277 nationally) — a middle-class / working-renter tenant base. Strengths: commute A+, housing A+, health & safety A; Watch: amenities D+, crime F.
- Baltimore County Public Schools (suburban): math 15% / reading 34% proficiency, ranked #11 of 24 in MD (top 46%) — low school quality limits family demand, transient renter base, plan for 1-2y turnover.
- Zoned schools: Middlesex Elementary (math 8% / reading 8%, grade F, #681 of 860 statewide, top 81%, 373 students, 74% FRL); Stemmers Run Middle (math 5% / reading 28%, grade F, #174 of 225 statewide, top 81%, 838 students, 68% FRL); Kenwood High (math 10% / reading 43%, grade F, #161 of 222 statewide, top 72%, 1,908 students, 63% FRL) — zoned schools average 68% FRL vs 39% district-wide (29 pts higher); higher-poverty schools than district average — tighter screening recommended.
- Market conditions: Rents rising (+1.1%/yr); 142 active listings in the ZIP; 36 comparable units currently listed for rent nearby; rentals at typical pace (median 26d on market — plan ~3-4 weeks tenant-placement turnaround); 1,511 units permitted in Baltimore County in 2024 (643 in 5+ unit buildings).
- This rent runs 37% of the median local income ($67k/yr) — at the standard rent-burdened threshold; future hikes will face affordability resistance.
Forward outlook
- Local home prices are declining (-3.0%/yr); year-one equity from $1k of loan paydown is wiped out by about $6k of value loss. Plan a longer hold.
- Baltimore County population projected at +12% by 2050 — modest demand growth; plan on rents tracking national, not racing it.
Negotiation context
- Only 5 days on market — expect competitive offers; lowballing is unlikely to land.
- 8 sale attempts since 21y ago; this cycle's ask has dropped $15k (7%) from the opening price — seller is motivated, your offer sets the floor, not the list.
- Current owner paid $146k; 37% above their basis — modest negotiation headroom, anchor on the comps not their cost.
Risks & watch-outs
- Watch-outs: built in 1954 — expect roof / HVAC / electrical / plumbing capex.
- Climate carrying-cost: major wind risk, 27% chance of damaging wind over 30y; extreme-heat days projected 7→15/yr by 2055 (HVAC capex compounding) — expect insurance premiums to compound above CPI over the hold.
Questions for the listing agent
- Built in 1954 — when were the roof, HVAC, electrical panel, plumbing, and water heater last replaced?
- Is there a deadline driving the sale (1031 exchange, divorce, estate, relocation)? That informs how much negotiation room exists.
- Schools are D-rated, which usually means shorter tenancies and higher turnover. Who's the typical renter profile here, and what's been the actual vacancy rate?
- Crime grade is F in this area — have there been break-ins, vandalism, or insurance claims at this property in the last 3 years? What carrier currently insures it and at what premium?
- What's the average days-on-market for RENTAL listings here right now (not sales)? A rising rental-DOM trend means longer vacancies and softer asking-rent achievability than the comps imply.
- What's the recent tenant-quality profile in this submarket — average credit score on applications, eviction rate, late-payment / NSF rate, and stable-employment percentage? A property-management company in the area should have these aggregated.
- How much new for-sale + rental construction is in the pipeline within 1–3 miles? Heavy new supply typically softens prices + rents 12–24 months out; constrained supply supports both.
Investment metrics
- 1% rule
- 1.05% ✓
- Cap rate
- 7.92%
- Cash-on-cash
- 5.79%
- DSCR
- 1.26
- GRM
- 7.9
CMA / ARV
- ARV (on-the-fly)
- $204,776
- Comps found
- 12
Show comp detail 12 sales within ~0.75 mi
| Address | Dist | Beds/Ba | Sqft | Sold | Price | $/sf | Match |
|---|---|---|---|---|---|---|---|
| 417 Torner Rd | 0.21mi | 3/1.0 | 1,144 (0%) | 3mo | $207,000 | $181 | 88 |
| 732 Arncliffe Rd | 0.19mi | 3/1.0 | 1,169 (+2%) | 2mo | $200,000 | $171 | 86 |
| 1100 N Marlyn Ave | 0.23mi | 3/1.5 | 1,144 (0%) | 2mo | $215,000 | $188 | 85 |
| 813 Middlesex Rd | 0.12mi | 4/2.0 (+1) | 1,144 (0%) | 2mo | $257,500 | $225 | 84 |
| 559 Welbrook Rd | 0.31mi | 3/1.0 | 1,124 (-2%) | 4mo | $175,000 | $156 | 79 |
| 606 Middlesex Rd | 0.35mi | 3/2.0 | 1,152 (+1%) | 1mo | $252,000 | $219 | 77 |
| 1024 Middlesex | 0.16mi | 3/2.0 | 1,196 (+4%) | 7mo | $247,500 | $207 | 75 |
| 946 Middlesex Rd | 0.11mi | 3/1.0 | 1,284 (+12%) | 1mo | $195,000 | $152 | 74 |
| 647 Dunwich Way | 0.25mi | 3/1.5 | 1,024 (-10%) | 2mo | $147,000 | $144 | 67 |
| 329 Leeanne Rd | 0.61mi | 3/1.5 | 1,152 (+1%) | 2mo | $206,000 | $179 | 67 |
| 724 Middlesex | 0.19mi | 2/1.5 (-1) | 1,016 (-11%) | 7mo | $170,000 | $167 | 59 |
| 303 Leeanne Rd | 0.66mi | 3/1.0 | 1,024 (-10%) | 5mo | $182,000 | $178 | 47 |
Match score weights: distance 35% · size 25% · config 20% · recency 20%. Top-matched comps best support the ARV.
Projected returns pro-forma
-3.0% appreciation · 1.08% rent growth · sell at horizon
- IRR
- -9.5%
- Equity multiple
- 0.66×
- Total profit
- $-19,132
- Equity at exit
- $29,821
- IRR
- -2.9%
- Equity multiple
- 0.82×
- Total profit
- $-10,057
- Equity at exit
- $17,292
Cash invested: $56,000 (down + closing). Projections, not guarantees.
Landlord ↔ Tenant lean methodology
- Overall (STATE)
- 27 Tenant-Leaning
- State Maryland
- 27 Tenant-Leaning · D+14
- County
- — inherits STATE
- City
- — inherits STATE
ZIP-level market 21221
- Rents YoY
- 1.1%
- Active inventory
- 142
- Price-to-rent
- 7.9×
Monthly cashflow live
- Estimated rent
- $2,100 high interval (Pro) →
- Mortgage (P&I)
- −$1,049
- Tax from tax record
- −$257 /mo · $3,079/yr
- Insurance
- −$83
- HOA
- −$0
- Vacancy / Maint / Mgmt
- −$441
- Net cashflow
- $270
Break-even live
Sensitivity live
| Price | -10% $384 | -5% $327 | +0% $270 | +5% $214 | +10% $157 |
|---|---|---|---|---|---|
| Rent | -10% $104 | -5% $187 | +0% $270 | +5% $353 | +10% $436 |
| Rate | -1.0pp $371 | -0.5pp $321 | base $270 | +0.5pp $219 | +1.0pp $166 |
UW: 25.0% down · 7.5% · 30yr · 1.5% tax · 5.0% vac · 8.0% maint · 8.0% mgmt
Financing live
Cash to close
- Down payment
- $50,000
- Closing costs
- $6,000
- Reserves months
- —
- Total cash needed
- —
Loan-product check · same deal, 3 products live
Conventional
25% down · 7.5% · 30yr
- Down + closing
- —
- Monthly P&I
- —
- Monthly cashflow
- —
- DSCR
- —
- Eligible?
- —
Personal DTI + credit; lowest rate.
DSCR
20% down · 8.5% · 30yr
- Down + closing
- —
- Monthly P&I
- —
- Monthly cashflow
- —
- DSCR
- —
- Eligible?
- —
No personal income docs; deal must DSCR.
Hard money
10% down · 12.0% · 12mo
- Down + closing
- —
- Monthly P&I
- —
- Monthly cashflow
- —
- DSCR
- —
- Eligible?
- —
Short-term bridge; refi at stabilization.
Rent comps 36 comps
| Address | Beds | Baths | Sqft | Rent | $/sqft | DOM | Units | Dist |
|---|---|---|---|---|---|---|---|---|
| 832 N Marlyn Ave Essex, MD | 3.0 | 2.0 | 1416 | $2,300 | $1.62 | 45d | 1 | 0.08mi |
| 421 Torner Rd Essex, MD | 3.0 | 2.0 | 1024 | $2,050 | $2.00 | 23d | 1 | 0.21mi |
| 326 Stemmers Run Rd Essex, MD | 4.0 | 2.0 | 1144 | $2,300 | $2.01 | 45d | 1 | 0.22mi |
| 233 Orville Rd Essex, MD | 3.0 | 2.0 | 1144 | $1,850 | $1.62 | 45d | 1 | 0.23mi |
| 153 Bennett Rd Unit Labs Essex, MD | 2.0 | 2.0 | 1196 | $1,800 | $1.51 | 7d | 1 | 0.23mi |
| 201 Middleway Rd Middle River, MD | 1.0–2.0 | 1.0 | 750 | $1,571 | $2.09 | 4d | 24 | 0.59mi |
| 54 Stemmers Run Rd Essex, MD | 3.0 | 2.5 | 1260 | $1,950 | $1.55 | 45d | 1 | 0.66mi |
| 47 S Hawthorne Rd Middle River, MD | 3.0 | 1.0 | 1024 | $1,900 | $1.86 | 25d | 1 | 0.83mi |
| 60 S Hawthorne Rd Middle River, MD | 3.0 | 1.0 | 1234 | $2,250 | $1.82 | 45d | 1 | 0.83mi |
| 4 Essex Ave Unit A Essex, MD | 2.0 | 1.0 | 800 | $1,250 | $1.56 | 25d | 1 | 0.85mi |
| 8908 Golden Tree Ln Essex, MD | 4.0 | 1.5 | 1466 | $3,000 | $2.05 | 45d | 1 | 0.86mi |
| 2125 Hawthorne Rd Middle River, MD | 3.0 | 2.0 | 1299 | $2,100 | $1.62 | 45d | 1 | 0.90mi |
| 42 Holcumb Ct Middle River, MD | 3.0 | 1.5 | 1452 | $2,200 | $1.52 | 45d | 1 | 0.91mi |
| 120 Kingston Rd Middle River, MD | 3.0 | 2.0 | 1024 | $1,950 | $1.90 | 25d | 1 | 0.95mi |
| 1516 Becklow Ave Middle River, MD | 3.0 | 1.0 | 1144 | $2,100 | $1.84 | 23d | 1 | 0.97mi |
| 1513 Aldeney Ave Middle River, MD | 4.0 | 2.0 | 1324 | $2,295 | $1.73 | 25d | 1 | 0.98mi |
| 439 Hopkins Landing Dr Essex, MD | 2.0 | 2.0 | 1485 | $1,795 | $1.21 | 12d | 1 | 1.00mi |
| 1542 Becklow Ave Middle River, MD | 4.0 | 2.0 | 1224 | $1,800 | $1.47 | 0d | 1 | 1.01mi |
| 303 Endsleigh Ave Middle River, MD | 3.0 | 2.0 | 1144 | $1,950 | $1.70 | 23d | 1 | 1.01mi |
| 2202 Firethorn Rd Middle River, MD | 3.0 | 2.5 | 1324 | $2,300 | $1.74 | 45d | 1 | 1.09mi |
| 19 Mooring Ct Essex, MD | 3.0 | 1.5 | 1439 | $1,900 | $1.32 | 0d | 1 | 1.12mi |
| 433 Grovethorn Rd Middle River, MD | 3.0 | 2.0 | 1024 | $2,000 | $1.95 | 23d | 1 | 1.14mi |
| 2203 Redthorn Rd Middle River, MD | 3.0 | 2.0 | 1144 | $2,200 | $1.92 | 12d | 1 | 1.15mi |
| 22 Nakota Ct Middle River, MD | 3.0 | 1.5 | 1194 | $2,000 | $1.68 | 45d | 1 | 1.21mi |
| 2167 Graythorn Rd Middle River, MD | 3.0 | 1.5 | 1324 | $1,900 | $1.44 | 25d | 1 | 1.22mi |
| 28 Ebbing Ct Essex, MD | 3.0 | 2.5 | 1464 | $2,095 | $1.43 | 0d | 1 | 1.22mi |
| 2 Chelmsford Ct Middle River, MD | 3.0 | 1.5 | 1122 | $2,100 | $1.87 | 4d | 1 | 1.22mi |
| 303 Holly Dr Middle River, MD | 1.0–2.0 | 1.0 | 739 | $1,510 | $2.04 | 0d | 10 | 1.30mi |
| 2242 Graythorn Rd Middle River, MD | 3.0 | 1.5 | 1024 | $2,195 | $2.14 | 45d | 1 | 1.30mi |
| 2128 Cockspur Rd Middle River, MD | 3.0 | 1.5 | 1272 | $2,100 | $1.65 | 25d | 1 | 1.37mi |
| 706 Seawall Rd Essex, MD | 3.0 | 1.0 | 1114 | $1,900 | $1.71 | 7d | 1 | 1.40mi |
| 1402 Nicolay Way Unit 1 Essex, MD | 3.0 | 1.5 | 1432 | $1,925 | $1.34 | 7d | 1 | 1.43mi |
| 1402 Nicolay Way Essex, MD | 3.0 | 2.0 | 1432 | $1,925 | $1.34 | 5d | 1 | 1.43mi |
| 1409 Nicolay Way Essex, MD | 3.0 | 2.0 | 1008 | $1,950 | $1.93 | 7d | 1 | 1.45mi |
| 846 Brunswick Rd Essex, MD | 1.0–2.0 | 1.0–2.0 | 500 | $1,241 | $2.48 | 4d | 49 | 1.47mi |
| 846 Brunswick Rd Essex, MD | 2.0 | 1.0 | 500 | $1,272 | $2.54 | 45d | 42 | 1.47mi |
Listing history 5 events
-
2026-06-13statusdays on market $200,000 Pending 5 DOM
-
2026-06-09days on market $200,000 Active 4 DOM
-
2026-06-08days on market $200,000 Active 3 DOM
-
2026-06-07remarks 699-char remark
-
2026-06-07$200,000 Active 2 DOM
ⓘ Source: listings_history table (triggers on properties + properties_extension) + one-shot
backfill from property_details.listing_events for pre-trigger history.
Tax reassessment forecast MD · Partial reset (capped growth)
- Current annual tax
- $3,079 · $257/mo
- Projected year-2 tax
- $3,079 · $257/mo
- Expected delta
- $0/yr ($0/mo · 0.0%)
ⓘ Screening estimate from a state-policy table — verify with the county assessor before closing.
Climate risk First Street
- Flood 1/10 Low FEMA zone X (unshaded) · 0% chance over 30 yrs
- Wildfire 1/10 Low
- Heat 8/10 Severe 7 d/yr ≥104°F today · 15 d/yr by 30 yrs out
- Wind 6/10 Major 27% chance of damaging wind over 30 yrs
- Air quality 5/10 Major 6 unhealthy d/yr today · 8 by 30 yrs out
Nearby sold comps map
Loading sold comps map…
Walkable amenities ~0.75 mi
Loading nearby amenities…
Taxation est. · year 1
- Rental income
- $25,202
- − Mortgage interest
- −$11,203
- − Property taxes
- −$3,079
- − Insurance
- −$1,000
- − Repairs & maintenance
- −$2,016
- − Management
- −$2,016
- − Depreciation
- −$5,818
- Taxable income
- $69
- Est. tax owed @ 24.0%
- −$17
- After-tax cash flow
- $3,228/yr
For passive investors: Depreciation is non-cash, so a rental often shows a tax loss while cash-flowing — sheltering income. Rental losses are passive: they offset passive income freely, and up to $25,000/yr can offset ordinary (W-2) income if you actively participate and your MAGI is under $100k (phasing out to $0 by $150k); unused losses carry forward. On sale, claimed depreciation is recaptured at up to 25%, and gains may owe capital-gains tax (a 1031 exchange can defer both). Figures are a year-1 estimate at your 24.0% rate — not tax advice; consult a CPA.
Schools (NCES district)
- District
- Baltimore County Public Schools
- NCES district ID
- 2400120
- Math proficiency
- 15% ▼ -16.00%
- Reading proficiency
- 34% ▼ -5.00%
- Median HH income
- $66,746
- Composite
- 23.17/100
- National rank
- #7948
- State rank
- #11 of 24 in MD
Livability — Essex
- Score
- 79/100
- State rank
- #60
- US rank
- #2277
Category grades
Schools grade is shown separately in the Schools card above.
Census & demographics
- Census place
- Essex, MD
- County
- Baltimore County · 769,527 people
- City population
- 43,487
- Metro
- Baltimore-Columbia-Towson, MD
- Population (ZIP)
- 43,487
- Household income
- $67,340
- Rent vs Own
- Severe rent burden
- 1757.0
Population outlook (Baltimore County) Hauer SSP2
- Today (2025)
- 885,518 people
- By 2030
- 909,272 · +2.7%
- By 2040
- 951,547 · +7.5%
- By 2050
- 990,955 · +11.9%
- By 2075
- 1,086,411 · +22.7%
- By 2100
- 1,135,078 · +28.2%
Race, ethnicity, and origin ACS 2023
- Neighborhood character
- Diverse neighborhood (Simpson 0.60)
- Race & ethnicity
- White 54% Black 32% Two or more races 7% Hispanic / Latino 7% Asian 1%
- Hispanic origin (detail)
- Mexican 2% Puerto Rican 1% Dominican 1%
- Common ancestry
- Romanian 5% Lithuanian 1% Slovak 1%
- Foreign-born
- 8% · Canada, China
- Languages at home
- 89% English-only · Spanish 6% French/Haitian/Cajun 1%
Political lean MEDSL · Baltimore
- 2024 margin
- Strong D (+24.5) · D 61.0% · R 36.5% · Other 2.5%
- 2008→2024 swing
- +9.9pp toward D · 2008: 14.6pp · 2024: 24.5pp
- All cycles
- 2024: D+24.5 2020: D+27.0 2016: D+17.4 2012: D+16.4 2008: D+14.6
Not yet ingested
- Civics
- —
Market trends
- HPI YoY
- ▼ -232.14%
- Current HPI
- 237.1069
- Rent YoY
- ▲ 1.08%
- Metro
- Baltimore-Columbia-Towson, MD
- State GDP YoY
- ▲ 2.97%
- F500 in state
- 12
Industry mix (Fortune 500 HQ in MD)
| Industry | F500 HQs | Revenue |
|---|---|---|
| Aerospace / Defense | 1 | $71B |
|
||
| Utilities | 1 | $25B |
|
||
| Hotels | 1 | $24B |
|
||
| Consumer Goods | 1 | $7B |
|
||
| Real Estate | 1 | $6B |
|
||
| Chemicals | 1 | $2B |
|
||
Price history
+440.5% since first listed23 events — show timeline
- 2026-06-05 Price Changed $200,000 BRIGHT MLS
- 2026-06-05 Relisted — BRIGHT MLS
- 2026-06-02 Listed $215,000 BRIGHT MLS
- 2026-06-02 Listing Removed — BRIGHT MLS
- 2025-12-02 Listing Removed — BRIGHT MLS
- 2025-08-27 Listing Removed — BRIGHT MLS
- 2025-08-27 Listed $219,900 BRIGHT MLS
- 2025-07-22 Listed $225,000 BRIGHT MLS
- 2020-08-17 Sold (Public Records) $146,000 Public Records
- 2020-07-31 Sold (MLS) $146,000 BRIGHT MLS
- 2020-06-26 Pending — BRIGHT MLS
- 2020-06-12 Relisted — BRIGHT MLS
- 2020-05-30 Listed $149,900 BRIGHT MLS
- 2020-05-30 Listing Removed — BRIGHT MLS
- 2007-05-09 Sold (Public Records) $165,000 Public Records
- 2007-04-30 Sold (MLS) $165,000 MRIS
- 2007-03-15 Delisted — MRIS
- 2006-11-22 Listed $167,000 MRIS
- 2005-11-04 Sold (Public Records) $135,000 Public Records
- 2005-10-28 Sold (MLS) $135,000 MRIS
- 2005-09-18 Delisted — MRIS
- 2005-09-15 Listed $135,000 MRIS
- 1988-06-22 Sold (Public Records) $37,000 Public Records
Property tax history
+4.5%/yrLatest (2025): $3,079 · +9.6% YoY. Source: county tax records.
Cash-flow waterfall
monthlySold comps — $/sqft
last 12 mo · ≤1 miLoading sold comps…