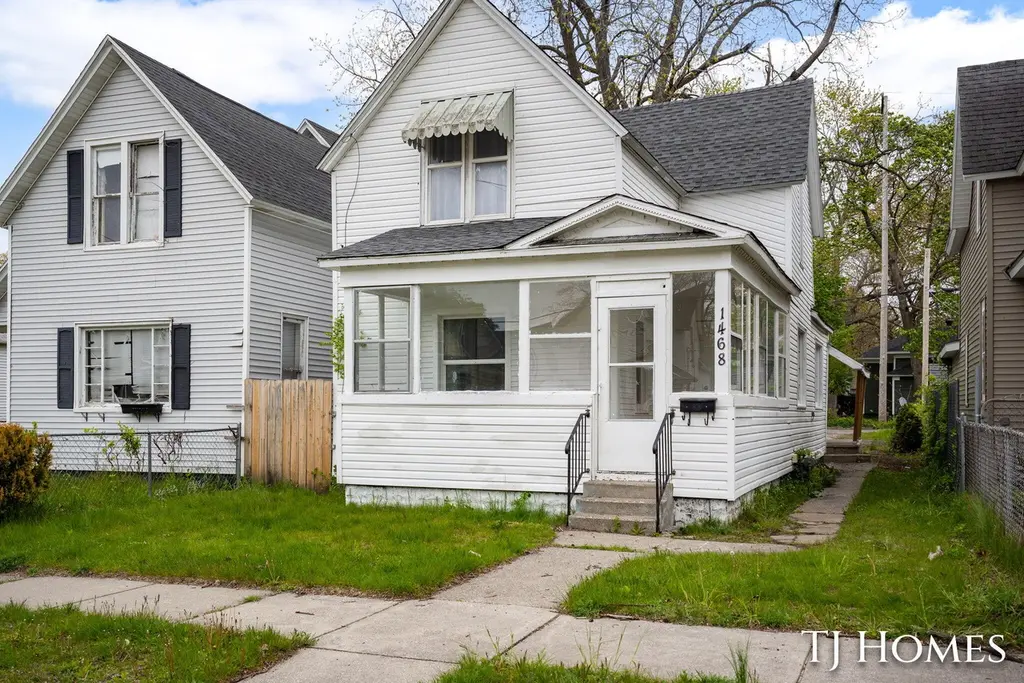
1468 Jiroch St · Muskegon, MI
Flood risk 1/10 · Minimal
- FEMA flood zone
- X (unshaded)
- Chance of flooding over 30 yrs
- 0.0%
- Est. flood insurance / yr
- $473 – $860
Fire risk 1/10 · Minimal
- Est. fire insurance / yr
- $784 – $1,456
Heat risk 2/10 · Minimal
- Hot days now (above 93°F)
- 7 days/yr
- Hot days in 30 yrs
- 15 days/yr
Wind risk 1/10 · Minimal
- Chance of severe wind over 30 yrs
- —
Air-quality risk 4/10 · Minor
- Unhealthy air days now
- 4 days/yr
- Unhealthy air days in 30 yrs
- 6 days/yr
Risk factors via First Street. Map © Google.
Why this score? — see what drove the B- grade
The composite is a weighted blend of 9 inputs, each scored 0–100. Each bar is that input's sub-score; the figure is the points it added to the 100-point composite (weight × sub-score).
- Cash flow +24.8/30.0
- ARV discount +15.0/15.0
- DSCR +8.0/10.0
- 1% rule +6.0/10.0
- Rent growth +4.6/5.0
- Livability +4.0/5.0
- Condition / age +2.5/5.0
- Schools +0.6/10.0
- Appreciation +0.0/10.0
$134,900
🖨 Deal sheet 📄 Offer letter ✓ Due diligence
Listing remarks MLS
Welcome to this beautifully updated 4-bedroom, 1-bath, 2-story home that's move-in ready and waiting for its next owner! Featuring a brand-new roof, fresh interior paint, and newer luxury vinyl plank flooring throughout, this home combines modern updates with comfortable living. The spacious kitchen offers stylish white shaker cabinets, stainless steel appliances, and an open-concept layout perfect for entertaining or everyday family life. With generous living spaces, plenty of natural light, and functional design, this property is ideal for first-time home buyers, growing families, or investors looking for a turnkey opportunity. Conveniently located near schools, parks, shopping, and major amenities, this updated home delivers both value and style. Don't miss your chance to make this house your home!
Key facts
- Brand new roof
- Fresh interior paint
- Open concept layout
Tags
Property features AI
Exterior
- Utilities: Public water
- Home design: Traditional style single-family home; Residential property
- Construction: Built in 1923; Vinyl siding; Shingle roof
- Exterior features: Sidewalk; Paved road access
Interior
- Kitchen: Kitchen (approx. 11.42 x 15.67); Microwave; Oven; Range; Refrigerator
- Bedrooms: Primary bedroom (approx. 12.7 x 11.5); Bedroom 2 (approx. 8.5 x 15.75); Bedroom 3 (approx. 11.83 x 13.58); Bedroom 4 (approx. 12.67 x 11.5)
- Bathrooms: One full bathroom
- Heating & cooling: Forced air heating
- Interior features: Nine total rooms; Full basement
- Laundry & utility: Basement utility space
Neighborhood map
What this means for you Summary
Snapshot
- This is a 3-bed/1.0-bath single-family listed at $135k.
Deal economics
- At list price, monthly cash flow is $284 ($3k/yr) — positive.
- The deal already cash-flows at list — no discount required.
- Meets the 1% rule at list price ($1k rent vs $135k).
- Recommended offer: $131k (3.0% below list) — sets the bar for market timing.
- Cap rate 8.8% vs local median 4.6% in Muskegon — top-decile yield for the area; either an underpriced asset or a hidden risk that comps aren't pricing in. Stress-test before assuming the spread holds.
Location & tenants
- Location reads 79/100 on livability (#92 in MI, #2,096 nationally) — a middle-class / working-renter tenant base. Strengths: amenities A+, commute A+, cost of living A+; Watch: schools D-, crime F, employment F.
- Muskegon Public Schools Of The City Of (urban): math 4% / reading 12% proficiency, ranked #534 of 540 in MI (top 99%) — low school quality limits family demand, transient renter base, plan for 1-2y turnover; 81% free/reduced lunch — lower-income household profile, screen leases tightly.
- Market conditions: Rents rising fast (+8.2%/yr); 289 active listings in the ZIP; 13 comparable units currently listed for rent nearby; rentals at typical pace (median 21d on market — plan ~3-4 weeks tenant-placement turnaround); 438 units permitted in Muskegon County in 2024 (115 in 5+ unit buildings).
- This rent runs 37% of the median local income ($49k/yr) — at the standard rent-burdened threshold; future hikes will face affordability resistance.
Forward outlook
- Local home prices are declining (-3.0%/yr); year-one equity from $933 of loan paydown is wiped out by about $4k of value loss. Plan a longer hold.
- Muskegon County population projected to shrink 8% by 2050 — rents likely to lag national; underwrite the cash flow, not the appreciation.
- At projected returns (-3.0% appreciation + 8.0% rent growth), your $38k cash investment doubles in ~8 years — after that, you're playing with house money.
Negotiation context
- It's been on market 35 days — a 3% lower offer ($131k) is reasonable based on typical stale-listing flexibility.
- 16 sale attempts since 28y ago with the ask held roughly flat each time — persistent listings suggest the price (not the market) is what's stuck; bring a comps-based counter.
- Current owner paid $14k; list at $135k implies a 881% gain — meaningful room to come down on a strong offer.
Risks & watch-outs
- Watch-outs: built in 1923 — expect roof / HVAC / electrical / plumbing capex.
Questions for the listing agent
- It's been on market 35 days. Have you received any prior offers? Is the seller open to a 3% concession, seller financing, or rate buy-down credit?
- Built in 1923 — when were the roof, HVAC, electrical panel, plumbing, and water heater last replaced?
- Is there a deadline driving the sale (1031 exchange, divorce, estate, relocation)? That informs how much negotiation room exists.
- Schools are D-rated, which usually means shorter tenancies and higher turnover. Who's the typical renter profile here, and what's been the actual vacancy rate?
- Crime grade is F in this area — have there been break-ins, vandalism, or insurance claims at this property in the last 3 years? What carrier currently insures it and at what premium?
- What's the average days-on-market for RENTAL listings here right now (not sales)? A rising rental-DOM trend means longer vacancies and softer asking-rent achievability than the comps imply.
- What's the recent tenant-quality profile in this submarket — average credit score on applications, eviction rate, late-payment / NSF rate, and stable-employment percentage? A property-management company in the area should have these aggregated.
- How much new for-sale + rental construction is in the pipeline within 1–3 miles? Heavy new supply typically softens prices + rents 12–24 months out; constrained supply supports both.
Investment metrics
- 1% rule
- 1.10% ✓
- Cap rate
- 8.82%
- Cash-on-cash
- 9.03%
- DSCR
- 1.40
- GRM
- 7.6
CMA / ARV
- ARV (on-the-fly)
- $163,280
- Comps found
- 12
Show comp detail 12 sales within ~0.75 mi
| Address | Dist | Beds/Ba | Sqft | Sold | Price | $/sf | Match |
|---|---|---|---|---|---|---|---|
| 1471 Leahy St | 0.03mi | 3/1.0 | 1,161 (-8%) | 1mo | $166,500 | $143 | 85 |
| 1532 Leahy St | 0.11mi | 3/1.0 | 1,376 (+10%) | 3mo | $118,850 | $86 | 77 |
| 257 Catherine Ave | 0.33mi | 3/1.0 | 1,311 (+4%) | 3mo | $108,000 | $82 | 75 |
| 1699 Sanford St | 0.36mi | 3/2.0 | 1,176 (-6%) | 1mo | $159,000 | $135 | 68 |
| 1499 Park St | 0.66mi | 3/1.0 | 1,186 (-6%) | 0mo | $150,048 | $127 | 60 |
| 1138 Sanford St | 0.45mi | 3/2.0 | 1,364 (+9%) | 2mo | $215,000 | $158 | 59 |
| 511 E Isabella Ave | 0.68mi | 4/1.0 (+1) | 1,204 (-4%) | 1mo | $175,000 | $145 | 56 |
| 1346 5th St | 0.42mi | 3/1.0 | 1,078 (-14%) | 2mo | $75,000 | $70 | 55 |
| 459 Ada Ave | 0.67mi | 4/2.0 (+1) | 1,307 (+4%) | 2mo | $141,900 | $109 | 52 |
| 1808 Mcilwraith St | 0.67mi | 3/1.0 | 1,100 (-12%) | 2mo | $143,500 | $130 | 46 |
| 2019 Leahy St | 0.74mi | 4/1.0 (+1) | 1,370 (+9%) | 3mo | $133,000 | $97 | 43 |
| 1907 Terrace St | 0.61mi | 4/2.0 (+1) | 1,080 (-14%) | 3mo | $170,000 | $157 | 37 |
Match score weights: distance 35% · size 25% · config 20% · recency 20%. Top-matched comps best support the ARV.
Projected returns pro-forma
-3.0% appreciation · 8.0% rent growth · sell at horizon
- IRR
- 2.7%
- Equity multiple
- 1.11×
- Total profit
- $4,079
- Equity at exit
- $20,114
- IRR
- 16.5%
- Equity multiple
- 2.65×
- Total profit
- $62,509
- Equity at exit
- $11,664
Cash invested: $37,772 (down + closing). Projections, not guarantees.
Landlord ↔ Tenant lean methodology
- Overall (STATE)
- 62 Landlord-Friendly
- State Michigan
- 62 Landlord-Friendly · EVEN
- County
- — inherits STATE
- City
- — inherits STATE
ZIP-level market 49442
- Rents YoY
- 8.2%
- Active inventory
- 289
- Price-to-rent
- 7.6×
Monthly cashflow live
- Estimated rent
- $1,483 high interval (Pro) →
- Mortgage (P&I)
- −$707
- Tax from tax record
- −$123 /mo · $1,480/yr
- Insurance
- −$56
- HOA
- −$0
- Vacancy / Maint / Mgmt
- −$311
- Net cashflow
- $284
Break-even live
UW: 25.0% down · 7.5% · 30yr · 1.5% tax · 5.0% vac · 8.0% maint · 8.0% mgmt
Financing live
Cash to close
- Down payment
- $33,725
- Closing costs
- $4,047
- Reserves months
- —
- Total cash needed
- —
Loan-product check · same deal, 3 products live
Conventional
25% down · 7.5% · 30yr
- Down + closing
- —
- Monthly P&I
- —
- Monthly cashflow
- —
- DSCR
- —
- Eligible?
- —
Personal DTI + credit; lowest rate.
DSCR
20% down · 8.5% · 30yr
- Down + closing
- —
- Monthly P&I
- —
- Monthly cashflow
- —
- DSCR
- —
- Eligible?
- —
No personal income docs; deal must DSCR.
Hard money
10% down · 12.0% · 12mo
- Down + closing
- —
- Monthly P&I
- —
- Monthly cashflow
- —
- DSCR
- —
- Eligible?
- —
Short-term bridge; refi at stabilization.
Rent comps 13 comps
| Address | Beds | Baths | Sqft | Rent | $/sqft | DOM | Units | Dist |
|---|---|---|---|---|---|---|---|---|
| 80 E Grand Ave Muskegon, MI | 3.0 | 1.5 | 1200 | $1,300 | $1.08 | 20d | 1 | 0.04mi |
| 1633 Peck St Unit 1 Muskegon, MI | 2.0 | 1.0 | 1184 | $1,150 | $0.97 | 20d | 1 | 0.26mi |
| 1206 Terrace St Unit 1 Muskegon, MI | 2.0 | 1.0 | 1200 | $1,975 | $1.65 | 20d | 1 | 0.32mi |
| 1188 Spring St Muskegon, MI | 3.0 | 1.0 | 1443 | $1,500 | $1.04 | 20d | 1 | 0.42mi |
| 384 Iona Ave Muskegon, MI | 3.0 | 1.0 | 1194 | $1,275 | $1.07 | 20d | 1 | 0.64mi |
| 449 Washington Ave Muskegon, MI | 3.0 | 2.0 | 1152 | $1,695 | $1.47 | 20d | 1 | 0.64mi |
| 310 Allen Ave Unit 2 Muskegon, MI | 3.0 | 3.0 | 1100 | $1,490 | $1.35 | 20d | 1 | 0.71mi |
| 488 W Muskegon Ave Muskegon, MI | 2.0 | 1.0 | 1008 | $1,150 | $1.14 | 20d | 1 | 0.75mi |
| 313 Orchard Ave Unit 1 Muskegon, MI | 3.0 | 3.0 | 1121 | $1,575 | $1.40 | 20d | 1 | 0.81mi |
| 313 Orchard Ave Unit 2 Muskegon, MI | 3.0 | 3.0 | 1279 | $1,475 | $1.15 | 20d | 1 | 0.81mi |
| 292 W Western Ave Muskegon, MI | 1.0–2.0 | 1.0–2.0 | 1062 | $2,450 | $2.31 | 20d | 1 | 0.89mi |
| 1644 Beidler St Muskegon, MI | 3.0 | 2.0 | 1228 | $1,700 | $1.38 | 20d | 1 | 0.97mi |
| 2065 Dowd St Muskegon, MI | 3.0 | 2.0 | 1228 | $1,695 | $1.38 | 20d | 1 | 1.50mi |
Listing history 46 events
-
2026-06-19days on market $134,900 Active 35 DOM
-
2026-06-18days on market $134,900 Active 34 DOM
-
2026-06-17days on market $134,900 Active 33 DOM
-
2026-06-16days on market $134,900 Active 32 DOM
-
2026-06-15days on market $134,900 Active 31 DOM
-
2026-06-14days on market $134,900 Active 29 DOM
-
2026-06-13days on market $134,900 Active 28 DOM
-
2026-06-10days on market $134,900 Active 26 DOM
-
2026-06-09days on market $134,900 Active 25 DOM
-
2026-06-08days on market $134,900 Active 24 DOM
-
2026-06-07days on market $134,900 Active 23 DOM
-
2026-06-05days on market $134,900 Active 20 DOM
-
2026-06-03days on market $134,900 Active 19 DOM
-
2026-06-02days on market $134,900 Active 18 DOM
-
2026-06-01days on market $134,900 Active 17 DOM
-
2026-05-31days on market $134,900 Active 16 DOM
-
2026-05-30days on market $134,900 Active 15 DOM
-
2026-05-15$139,900 Active
Show marketing remark (812 chars)
Welcome to this beautifully updated 4-bedroom, 1-bath, 2-story home that's move-in ready and waiting for its next owner! Featuring a brand-new roof, fresh interior paint, and newer luxury vinyl plank flooring throughout, this home combines modern updates with comfortable living. The spacious kitchen offers stylish white shaker cabinets, stainless steel appliances, and an open-concept layout perfect for entertaining or everyday family life. With generous living spaces, plenty of natural light, and functional design, this property is ideal for first-time home buyers, growing families, or investors looking for a turnkey opportunity. Conveniently located near schools, parks, shopping, and major amenities, this updated home delivers both value and style. Don't miss your chance to make this house your home!
-
2026-05-15$139,900 Active 812-char remark
Show marketing remark (812 chars)
Welcome to this beautifully updated 4-bedroom, 1-bath, 2-story home that's move-in ready and waiting for its next owner! Featuring a brand-new roof, fresh interior paint, and newer luxury vinyl plank flooring throughout, this home combines modern updates with comfortable living. The spacious kitchen offers stylish white shaker cabinets, stainless steel appliances, and an open-concept layout perfect for entertaining or everyday family life. With generous living spaces, plenty of natural light, and functional design, this property is ideal for first-time home buyers, growing families, or investors looking for a turnkey opportunity. Conveniently located near schools, parks, shopping, and major amenities, this updated home delivers both value and style. Don't miss your chance to make this house your home!
-
2018-06-12historical
-
2018-06-11historical
-
2018-06-11historical
-
2018-04-17price $49,900
-
2018-03-13$49,900
-
2018-03-13$59,900 Active
-
2018-03-13$49,900
-
2014-09-26historical
-
2014-09-24historical
-
2014-09-15historical
-
2007-06-30historical
-
2007-01-30$29,900
-
2007-01-30$29,900
-
2006-12-28historical
-
2006-06-28$29,900
-
2006-06-28$29,900
-
2004-09-27soldstatus $13,750
-
2003-11-07$19,000
-
2003-11-07$19,000
-
2003-03-05historical
-
2002-03-13$49,900
-
2002-03-13$49,900
-
1998-10-01soldstatus $22,900
-
1998-10-01soldstatus $22,900
-
1998-07-10$22,900
-
1998-07-10$22,900
ⓘ Source: listings_history table (triggers on properties + properties_extension) + one-shot
backfill from property_details.listing_events for pre-trigger history.
Tax reassessment forecast MI · Partial reset (capped growth)
- Current annual tax
- $1,480 · $123/mo
- Projected year-2 tax
- $1,779 · $148/mo
- Expected delta
- +$299/yr (+$25/mo · 20.2%)
ⓘ Screening estimate from a state-policy table — verify with the county assessor before closing.
Climate risk First Street
- Flood 1/10 Low FEMA zone X (unshaded) · 0% chance over 30 yrs
- Wildfire 1/10 Low
- Heat 2/10 Low 7 d/yr ≥93°F today · 15 d/yr by 30 yrs out
- Wind 1/10 Low
- Air quality 4/10 Moderate 4 unhealthy d/yr today · 6 by 30 yrs out
Nearby sold comps map
Loading sold comps map…
Walkable amenities ~0.75 mi
Loading nearby amenities…
Taxation est. · year 1
- Rental income
- $17,791
- − Mortgage interest
- −$7,556
- − Property taxes
- −$1,480
- − Insurance
- −$674
- − Repairs & maintenance
- −$1,423
- − Management
- −$1,423
- − Depreciation
- −$3,924
- Taxable income
- $1,310
- Est. tax owed @ 24.0%
- −$314
- After-tax cash flow
- $3,098/yr
For passive investors: Depreciation is non-cash, so a rental often shows a tax loss while cash-flowing — sheltering income. Rental losses are passive: they offset passive income freely, and up to $25,000/yr can offset ordinary (W-2) income if you actively participate and your MAGI is under $100k (phasing out to $0 by $150k); unused losses carry forward. On sale, claimed depreciation is recaptured at up to 25%, and gains may owe capital-gains tax (a 1031 exchange can defer both). Figures are a year-1 estimate at your 24.0% rate — not tax advice; consult a CPA.
Schools (NCES district)
- District
- Muskegon Public Schools Of The City Of
- NCES district ID
- 2624840
- Math proficiency
- 4% ▼ -9.00%
- Reading proficiency
- 12% ▼ -9.00%
- Median HH income
- $27,622
- Composite
- 5.8/100
- National rank
- #10017
- State rank
- #534 of 540 in MI
Livability — Muskegon
- Score
- 79/100
- State rank
- #92
- US rank
- #2096
Category grades
Schools grade is shown separately in the Schools card above.
Census & demographics
- Census place
- Muskegon, MI
- County
- Muskegon County · 107,917 people
- City population
- 44,766
- Metro
- Muskegon, MI
- Population (ZIP)
- 44,766
- Household income
- $48,563
- Rent vs Own
- Severe rent burden
- 1598.0
Population outlook (Muskegon County) Hauer SSP2
- Today (2025)
- 174,032 people
- By 2030
- 173,365 · -0.4%
- By 2040
- 168,877 · -3.0%
- By 2050
- 160,306 · -7.9%
- By 2075
- 134,426 · -22.8%
- By 2100
- 98,836 · -43.2%
Race, ethnicity, and origin ACS 2023
- Neighborhood character
- Diverse neighborhood (Simpson 0.56)
- Race & ethnicity
- White 63% Black 22% Two or more races 10% Hispanic / Latino 8%
- Hispanic origin (detail)
- Mexican 7%
- Common ancestry
- Iranian 5% Romanian 4% Lithuanian 3%
- Foreign-born
- 3% · Canada, South Korea
- Languages at home
- 95% English-only · Spanish 3%
Political lean MEDSL · Muskegon
- 2024 margin
- Toss-up / Even · D 48.4% · R 50.2% · Other 1.5%
- 2008→2024 swing
- -31.1pp toward R · 2008: 29.3pp · 2024: -1.8pp
- All cycles
- 2024: R+1.8 2020: D+0.6 2016: D+0.9 2012: D+17.8 2008: D+29.3
Not yet ingested
- Civics
- —
Market trends
- HPI YoY
- ▼ -174.87%
- Current HPI
- 287.0558
- Rent YoY
- ▲ 8.21%
- Metro
- Muskegon, MI
- State GDP YoY
- ▲ 1.37%
- F500 in state
- 28
Industry mix (Fortune 500 HQ in MI)
| Industry | F500 HQs | Revenue |
|---|---|---|
| Automotive Parts | 3 | $48B |
|
||
| Automotive | 2 | $372B |
|
||
| Chemicals | 1 | $45B |
|
||
| Automotive Retail | 1 | $29B |
|
||
| Healthcare / Medical Devices | 1 | $23B |
|
||
| Automotive Technology | 1 | $20B |
|
||
Price history
+510.9% since first listed29 events — show timeline
- 2026-05-15 Listed $139,900 REALCOMP
- 2026-05-15 Listed $139,900 MiRealSource-MiMLS
- 2026-05-15 Listed $139,900 SW Michigan MLS
- 2018-06-12 Listing Removed — SW Michigan MLS
- 2018-06-11 Listing Removed — MiRealSource-MiMLS
- 2018-06-11 Listing Removed — REALCOMP
- 2018-04-17 Price Changed $49,900 SW Michigan MLS
- 2018-03-13 Listed $49,900 MiRealSource-MiMLS
- 2018-03-13 Listed $59,900 SW Michigan MLS
- 2018-03-13 Listed $49,900 REALCOMP
- 2014-09-26 Listing Removed — SW Michigan MLS
- 2014-09-24 Listing Removed — SW Michigan MLS
- 2014-09-15 Listing Removed — SW Michigan MLS
- 2007-06-30 Listing Removed — REALCOMP
- 2007-01-30 Listed $29,900 REALCOMP
- 2007-01-30 Listed $29,900 SW Michigan MLS
- 2006-12-28 Listing Removed — REALCOMP
- 2006-06-28 Listed $29,900 REALCOMP
- 2006-06-28 Listed $29,900 SW Michigan MLS
- 2004-09-27 Sold (Public Records) $13,750 Public Records
- 2003-11-07 Listed $19,000 SW Michigan MLS
- 2003-11-07 Listed $19,000 REALCOMP
- 2003-03-05 Listing Removed — REALCOMP
- 2002-03-13 Listed $49,900 REALCOMP
- 2002-03-13 Listed $49,900 SW Michigan MLS
- 1998-10-01 Sold (MLS) $22,900 REALCOMP
- 1998-10-01 Sold (MLS) $22,900 SW Michigan MLS
- 1998-07-10 Listed $22,900 REALCOMP
- 1998-07-10 Listed $22,900 SW Michigan MLS
Property tax history
+4.5%/yrLatest (2025): $1,480 · +2.2% YoY. Source: county tax records.
Cash-flow waterfall
monthlySold comps — $/sqft
last 12 mo · ≤1 miLoading sold comps…