 🏗️ New Construction
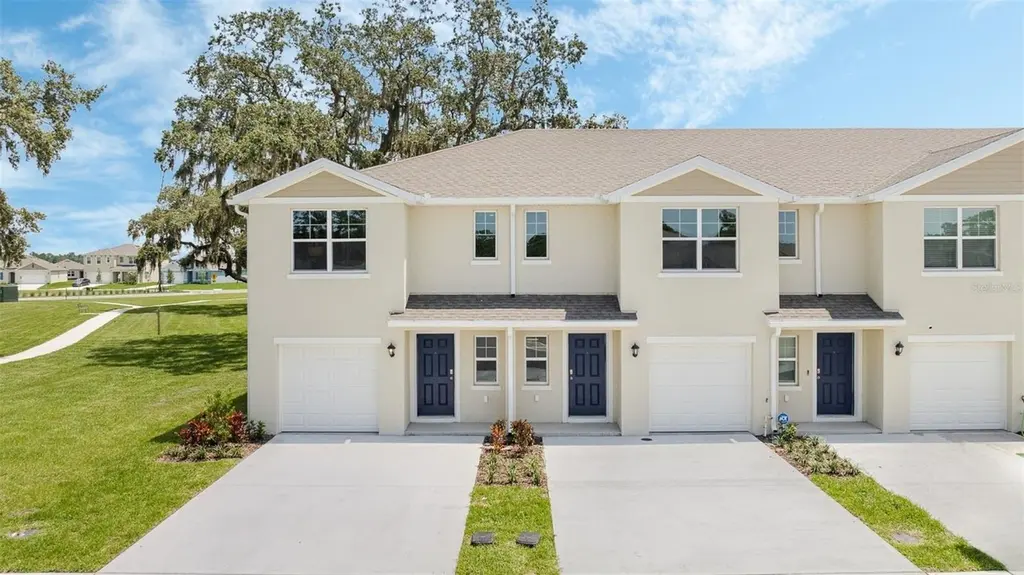
717 Preston Cove Dr · St. Cloud, FL
Flood risk 1/10 · Minimal
- FEMA flood zone
- X (unshaded)
- Chance of flooding over 30 yrs
- 0.0%
- Est. flood insurance / yr
- $507 – $1,088
Fire risk 7/10 · Major
- Est. fire insurance / yr
- $947 – $1,759
Heat risk 9/10 · Severe
- Hot days now (above 108°F)
- 7 days/yr
- Hot days in 30 yrs
- 23 days/yr
Wind risk 9/10 · Severe
- Chance of severe wind over 30 yrs
- 99.0%
Air-quality risk 2/10 · Minimal
- Unhealthy air days now
- 1 days/yr
- Unhealthy air days in 30 yrs
- 1 days/yr
Risk factors via First Street. Map © Google.
Why this score? — see what drove the F grade
The composite is a weighted blend of 9 inputs, each scored 0–100. Each bar is that input's sub-score; the figure is the points it added to the 100-point composite (weight × sub-score).
- Cash flow +8.8/30.0
- ARV discount +7.5/15.0
- Schools +3.6/10.0
- Rent growth +3.3/5.0
- Livability +2.5/5.0
- Condition / age +2.5/5.0
- DSCR +2.4/10.0
- 1% rule +2.3/10.0
- Appreciation +0.0/10.0
$335,990
🖨 Deal sheet (PDF) 📄 Offer letter ✓ Due diligence
Listing remarks
Under Construction. Introducing the Pearson townhome in Preston Cove, offering modern elegance and functionality. The spacious living area, gourmet kitchen, and three bedrooms provide comfort and style. Features include smart home technology and a one-car garage. Perfect for modern living, blending sophistication with everyday convenience. This home is open for self-touring 7 days a week. * Photos are of similar model but not that of exact house. Pictures, photographs, colors, features, and sizes are for illustration purposes only and will vary from the homes as built. Home and community information including pricing, included features, terms, availability and amenities are subject to chang
Key facts
- $90 HOA
- Garage
- Community pool
Property features AI
Finance
- Other: Home warranty included
- Financial info: Other annual assessment: $992; Total annual fees (multi-family field): $1,089.60; Lease restrictions apply
- HOA & community: Monthly HOA fee approximately $90.80; HOA amenities: fitness center, playground, pool; Association fee includes pool; Deed restrictions; Sidewalks and street lights in community; Pets allowed (cats and dogs)
Exterior
- Parking: Attached garage (1 car, approx. 10x20)
- Utilities: Public water; Public sewer; Cable available; Electricity available; Underground utilities; Water available
- Home design: Townhouse; Residential property; Two levels; Facing west; Under construction (projected completion: 2026-05-19)
- Construction: Block and stucco construction; Shingle roof; Slab foundation; Built by D.R. Horton (model: Pearson)
- Exterior features: Sidewalk; Sliding doors; Sprinkler (metered)
Interior
- Kitchen: Dishwasher; Disposal; Range
- Bedrooms: 3 bedrooms
- Flooring: Carpet; Laminate
- Bathrooms: 2 full bathrooms; 1 half bathroom
- Heating & cooling: Central heating (electric); Central air conditioning
- Interior features: Eat-in kitchen; Kitchen/family room combo; Living room/dining room combo; Open floorplan; Solid surface counters; Stone counters; Thermostat; Walk-in closet(s)
- Laundry & utility: Dedicated laundry room
Neighborhood map
What this means for you Summary
Snapshot
- This is a 3-bed/2.5-bath land listed at $336k.
Deal economics
- At list price, monthly cash flow is $-274 ($-3k/yr) — negative.
- To cash-flow at today's rent, offer at most $288k (14.4% below list).
- To meet the 1% rule (rent ≥ 1% of price), the offer needs to be $245k (27.1% below list).
- Recommended offer: $245k (27.1% below list) — sets the bar for 1% rule.
- Cap rate 5.3% vs local median 4.0% in St. Cloud — top-decile yield for the area; either an underpriced asset or a hidden risk that comps aren't pricing in. Stress-test before assuming the spread holds.
Location & tenants
- Location reads: area grade F — affects rentability + tenant quality, not the cash-flow math above.
- Osceola (suburban): math 39% / reading 45% proficiency, ranked #60 of 73 in FL (top 82%) — families likely to look elsewhere, expect single-tenant / working-renter base with shorter leases; 60% free/reduced lunch — lower-income household profile, screen leases tightly.
- Zoned schools: Narcoossee Elementary School (math 55% / reading 65%, grade B-, #680 of 2,144 statewide, top 32%, 1,467 students, 38% FRL); Narcoossee Middle School (math 55% / reading 57%, grade B-, #175 of 571 statewide, top 31%, 1,371 students, 46% FRL); Harmony High School (math 40% / reading 46%, grade F, #255 of 667 statewide, top 39%, 2,822 students, 42% FRL) — zoned schools average 42% FRL vs 60% district-wide (18 pts lower); this property's tenant base skews higher-income than the district average.
- Market conditions: Rents rising (+3.0%/yr); 1396 active listings in the ZIP; 24 comparable units currently listed for rent nearby; rentals at typical pace (median 17d on market — plan ~3-4 weeks tenant-placement turnaround); solid renter incomes; 8,813 units permitted in Osceola County in 2024 (3,072 in 5+ unit buildings).
- This rent runs 30% of the median local income ($97k/yr) — at the standard rent-burdened threshold; future hikes will face affordability resistance.
Forward outlook
- Local home prices are declining (-3.0%/yr); year-one equity from $2k of loan paydown is wiped out by about $10k of value loss. Plan a longer hold.
- Osceola County population projected at +73% by 2050 — long-run rental-demand tailwind backs the buy-and-hold thesis.
Negotiation context
- It's been on market 95 days — a 9% lower offer ($306k) is reasonable based on typical stale-listing flexibility.
Risks & watch-outs
- Climate carrying-cost: severe wind risk, 99% chance of damaging wind over 30y; major wildfire risk; extreme-heat days projected 7→23/yr by 2055 (HVAC capex compounding) — expect insurance premiums to compound above CPI over the hold.
Questions for the listing agent
- What do current leases actually rent for vs. the listed asking? Can we see a recent rent roll and the last 12 months of T-12 income?
- It's been on market 95 days. Have you received any prior offers? Is the seller open to a 27% concession, seller financing, or rate buy-down credit?
- What does the HOA fee cover, when was the last increase, and are there any pending special assessments or reserve-fund shortfalls?
- Why hasn't it sold? Are there any deal-killer items the seller is aware of (foundation, flood, title, zoning, code violations)?
- Is there a deadline driving the sale (1031 exchange, divorce, estate, relocation)? That informs how much negotiation room exists.
- The area grade is low — what's the realistic commute time and amenity access for the typical tenant pool here? Any planned neighborhood developments (good or bad) we should know about?
- What's the average days-on-market for RENTAL listings here right now (not sales)? A rising rental-DOM trend means longer vacancies and softer asking-rent achievability than the comps imply.
- What's the recent tenant-quality profile in this submarket — average credit score on applications, eviction rate, late-payment / NSF rate, and stable-employment percentage? A property-management company in the area should have these aggregated.
- How much new for-sale + rental construction is in the pipeline within 1–3 miles? Heavy new supply typically softens prices + rents 12–24 months out; constrained supply supports both.
Investment metrics
- 1% rule
- 0.73% ✗
- Cap rate
- 5.31%
- Cash-on-cash
- -3.50%
- DSCR
- 0.84
- GRM
- 11.4
CMA / ARV
No comps found within radius.
Projected returns pro-forma
-3.0% appreciation · 3.02% rent growth · sell at horizon
- IRR
- -22.2%
- Equity multiple
- 0.24×
- Total profit
- $-71,885
- Equity at exit
- $50,097
- IRR
- -16.2%
- Equity multiple
- 0.10×
- Total profit
- $-85,006
- Equity at exit
- $29,050
Cash invested: $94,077 (down + closing). Projections, not guarantees.
Landlord ↔ Tenant lean methodology
- Overall (STATE)
- 87 Strongly Landlord-Friendly
- State Florida
- 87 Strongly Landlord-Friendly · R+3
- County
- — inherits STATE
- City
- — inherits STATE
ZIP-level market 34771
- Home prices YoY
- -30.0%
- Rents YoY
- 3.0%
- Active inventory
- 1396
- Price-to-rent
- 11.4×
Monthly cashflow live
- Estimated rent
- $2,448 high interval (Pro) →
- Mortgage (P&I)
- −$1,762
- Tax from tax record
- −$216 /mo · $2,590/yr
- Insurance
- −$140
- HOA
- −$90
- Vacancy / Maint / Mgmt
- −$514
- Net cashflow
- $-274
Break-even live
Sensitivity live
| Price | -10% $-84 | -5% $-179 | +0% $-274 | +5% $-369 | +10% $-464 |
|---|---|---|---|---|---|
| Rent | -10% $-467 | -5% $-371 | +0% $-274 | +5% $-177 | +10% $-81 |
| Rate | -1.0pp $-105 | -0.5pp $-189 | base $-274 | +0.5pp $-361 | +1.0pp $-450 |
UW: 25.0% down · 7.5% · 30yr · 1.5% tax · 5.0% vac · 8.0% maint · 8.0% mgmt
Financing live
Cash to close
- Down payment
- $83,998
- Closing costs
- $10,080
- Reserves months
- —
- Total cash needed
- —
Loan-product check · same deal, 3 products live
Conventional
25% down · 7.5% · 30yr
- Down + closing
- —
- Monthly P&I
- —
- Monthly cashflow
- —
- DSCR
- —
- Eligible?
- —
Personal DTI + credit; lowest rate.
DSCR
20% down · 8.5% · 30yr
- Down + closing
- —
- Monthly P&I
- —
- Monthly cashflow
- —
- DSCR
- —
- Eligible?
- —
No personal income docs; deal must DSCR.
Hard money
10% down · 12.0% · 12mo
- Down + closing
- —
- Monthly P&I
- —
- Monthly cashflow
- —
- DSCR
- —
- Eligible?
- —
Short-term bridge; refi at stabilization.
Rent comps 24 comps
| Address | Beds | Baths | Sqft | Rent | $/sqft | DOM | Units | Dist |
|---|---|---|---|---|---|---|---|---|
| 760 Preston Cove Dr Saint Cloud, FL | 3.0 | 2.5 | 1464 | $2,150 | $1.47 | 0d | 1 | 0.08mi |
| 764 Preston Cove Dr Unit 1 St Cloud, FL | 3.0 | 2.5 | 1463 | $2,100 | $1.44 | 26d | 1 | 0.08mi |
| 5752 Anders Way Saint Cloud, FL | 3.0 | 2.5 | 1700 | $2,500 | $1.47 | 26d | 1 | 0.10mi |
| 588 Preston Cove Dr Saint Cloud, FL | 3.0 | 2.5 | 1553 | $2,250 | $1.45 | 5d | 1 | 0.14mi |
| 564 Preston Cove Dr Saint Cloud, FL | 3.0 | 2.5 | 1551 | $2,080 | $1.34 | 26d | 1 | 0.16mi |
| 5788 Freshwater Canyon Dr Saint Cloud, FL | 3.0 | 2.5 | 1705 | $2,250 | $1.32 | 16d | 1 | 0.18mi |
| 1166 Silo Dr Saint Cloud, FL | 3.0 | 3.0 | 1856 | $2,499 | $1.35 | 18d | 1 | 0.45mi |
| 358 Cadberry Pl Saint Cloud, FL | 3.0 | 2.5 | 1594 | $2,200 | $1.38 | 16d | 1 | 0.52mi |
| 5824 Bullock Pl Saint Cloud, FL | 3.0 | 2.0 | 1663 | $2,149 | $1.29 | 6d | 1 | 0.53mi |
| 600 Talisi Loop Saint Cloud, FL | 3.0 | 2.0 | 1676 | $2,450 | $1.46 | 6d | 1 | 0.61mi |
| 5837 Beefmaster Rd Saint Cloud, FL | 3.0 | 2.0 | 1663 | $2,040 | $1.23 | 0d | 1 | 0.61mi |
| 504 Enaya St Saint Cloud, FL | 4.0 | 2.0 | 1825 | $3,100 | $1.70 | 26d | 1 | 0.61mi |
| 399 Tanis Ave Saint Cloud, FL | 4.0 | 2.0 | 1846 | $2,375 | $1.29 | 26d | 1 | 0.63mi |
| 234 Polermo Ave Saint Cloud, FL | 4.0 | 2.0 | 1825 | $2,490 | $1.36 | 26d | 1 | 0.68mi |
| 1479 Silver Maple Dr Saint Cloud, FL | 3.0 | 2.5 | 1654 | $2,312 | $1.40 | 0d | 5 | 0.69mi |
| 5686 Stockade Blvd Saint Cloud, FL | 3.0 | 2.5 | 1496 | $2,150 | $1.44 | 9d | 1 | 0.90mi |
| 5327 Timberland Ave Saint Cloud, FL | 4.0 | 2.0 | 1828 | $2,550 | $1.39 | 26d | 1 | 0.93mi |
| 5614 Stockade Blvd Saint Cloud, FL | 3.0 | 2.5 | 1760 | $2,395 | $1.36 | 19d | 1 | 1.17mi |
| 5273 Luisa Ct Saint Cloud, FL | 4.0 | 2.5 | 1860 | $2,375 | $1.28 | 14d | 1 | 1.25mi |
| 5261 Luisa Ct Saint Cloud, FL | 4.0 | 2.5 | 1860 | $2,350 | $1.26 | 26d | 1 | 1.27mi |
| 1305 Stockwell Ave Saint Cloud, FL | 3.0 | 2.5 | 1704 | $2,169 | $1.27 | 6d | 1 | 1.33mi |
| 1260 Stockwell Ave Saint Cloud, FL | 4.0 | 3.0 | 1786 | $2,390 | $1.34 | 26d | 1 | 1.36mi |
| 1200 Wycliffe Way Saint Cloud, FL | 3.0 | 2.5 | 1524 | $2,490 | $1.63 | 0d | 1 | 1.41mi |
| 1610 Spray Ter Saint Cloud, FL | 3.0 | 2.0 | 1672 | $2,599 | $1.55 | 16d | 1 | 1.42mi |
HOA detail
- Monthly dues
- $90 · $1,080/yr
Listing history 17 events
-
2026-06-21days on market $335,990 Active 95 DOM
-
2026-06-18days on market $335,990 Active 92 DOM
-
2026-06-17days on market $335,990 Active 91 DOM
-
2026-06-16days on market $335,990 Active 90 DOM
-
2026-06-15days on market $335,990 Active 89 DOM
-
2026-06-13days on market $335,990 Active 87 DOM
-
2026-06-13days on market $335,990 Active 86 DOM
-
2026-06-09days on market $335,990 Active 83 DOM
-
2026-06-08days on market $335,990 Active 82 DOM
-
2026-06-07days on market $335,990 Active 81 DOM
-
2026-06-04days on market $335,990 Active 78 DOM
-
2026-06-03days on market $335,990 Active 77 DOM
-
2026-06-02days on market $335,990 Active 76 DOM
-
2026-06-02days on market $335,990 Active 75 DOM
-
2026-05-31days on market $335,990 Active 74 DOM
-
2026-03-18$335,990 Active
-
2025-06-16soldstatus $3,510,000
ⓘ Source: listings_history table (triggers on properties + properties_extension) + one-shot
backfill from property_details.listing_events for pre-trigger history.
Tax reassessment forecast FL · Resets to sale price
- Current annual tax
- $2,590 · $216/mo
- Projected year-2 tax
- $2,789 · $232/mo
- Expected delta
- +$198/yr (+$17/mo · 7.7%)
ⓘ Screening estimate from a state-policy table — verify with the county assessor before closing.
Climate risk First Street
- Flood 1/10 Low FEMA zone X (unshaded) · 0% chance over 30 yrs
- Wildfire 7/10 Severe
- Heat 9/10 Extreme 7 d/yr ≥108°F today · 23 d/yr by 30 yrs out
- Wind 9/10 Extreme 99% chance of damaging wind over 30 yrs
- Air quality 2/10 Low 1 unhealthy d/yr today · 1 by 30 yrs out
Nearby sold comps map
Loading sold comps map…
Walkable amenities ~0.75 mi
Loading nearby amenities…
Taxation est. · year 1
- Rental income
- $29,374
- − Mortgage interest
- −$18,821
- − Property taxes
- −$2,590
- − Insurance
- −$1,680
- − Repairs & maintenance
- −$2,350
- − Management
- −$2,350
- − HOA
- −$1,080
- − Depreciation
- −$9,774
- Taxable loss
- −$9,272
- Est. tax savings @ 24.0%
- +$2,225
- After-tax cash flow
- $-1,064/yr
For passive investors: Depreciation is non-cash, so a rental often shows a tax loss while cash-flowing — sheltering income. Rental losses are passive: they offset passive income freely, and up to $25,000/yr can offset ordinary (W-2) income if you actively participate and your MAGI is under $100k (phasing out to $0 by $150k); unused losses carry forward. On sale, claimed depreciation is recaptured at up to 25%, and gains may owe capital-gains tax (a 1031 exchange can defer both). Figures are a year-1 estimate at your 24.0% rate — not tax advice; consult a CPA.
Schools (NCES district)
- District
- Osceola
- NCES district ID
- 1201470
- Math proficiency
- 39% ▼ -9.00%
- Reading proficiency
- 45% ▼ -4.00%
- Median HH income
- $45,528
- Composite
- 35.7/100
- National rank
- #4865
- State rank
- #60 of 73 in FL
Livability — St. Cloud
No livability data for this city. (Only ~50 U.S. cities are tracked.)
Census & demographics
- County
- Osceola County · 410,217 people
- City population
- 29,247
- Metro
- Orlando-Kissimmee-Sanford, FL
- Population (ZIP)
- 35,257
- Household income
- $97,415
- Rent vs Own
- Severe rent burden
- 338.0
Population outlook (Osceola County) Hauer SSP2
- Today (2025)
- 447,624 people
- By 2030
- 511,823 · +14.3%
- By 2040
- 642,986 · +43.6%
- By 2050
- 774,552 · +73.0%
- By 2075
- 1,078,144 · +140.9%
- By 2100
- 1,269,660 · +183.6%
Race, ethnicity, and origin ACS 2023
- Neighborhood character
- Diverse neighborhood (Simpson 0.62)
- Race & ethnicity
- White 45% Hispanic / Latino 41% Two or more races 20% Black 9% Asian 2%
- Hispanic origin (detail)
- Mexican 3% Puerto Rican 26% Cuban 2% Dominican 4%
- Common ancestry
- Slovak 2% Romanian 2% Lithuanian 1%
- Foreign-born
- 14% · Canada, Jamaica
- Languages at home
- 64% English-only · Spanish 33% Other Indo-European 3%
Political lean MEDSL · Osceola
- 2024 margin
- Toss-up / Even · D 48.7% · R 50.2% · Other 1.1%
- 2008→2024 swing
- -21.2pp toward R · 2008: 19.7pp · 2024: -1.4pp
- All cycles
- 2024: R+1.4 2020: D+13.8 2016: D+25.0 2012: D+24.5 2008: D+19.7
Not yet ingested
- Civics
- —
Market trends
- HPI YoY
- ▼ -124.44%
- Current HPI
- 290.3095
- Rent YoY
- ▲ 3.02%
- Metro
- Orlando-Kissimmee-Sanford, FL
- State GDP YoY
- ▲ 3.28%
- F500 in state
- 36
Industry mix (Fortune 500 HQ in FL)
| Industry | F500 HQs | Revenue |
|---|---|---|
| Industrial Technology | 2 | $29B |
|
||
| Insurance | 2 | $17B |
|
||
| Retail | 1 | $60B |
|
||
| Technology Distribution | 1 | $58B |
|
||
| Homebuilding | 1 | $35B |
|
||
| Technology Manufacturing | 1 | $35B |
|
||
Price history
-90.4% since first listed2 events — show timeline
- 2026-03-18 Listed $335,990 Stellar MLS as Distributed by MLS Grid
- 2025-06-16 Sold (Public Records) $3,510,000 Public Records
Property tax history
+7.7%/yrLatest (2025): $2,590 · +16.2% YoY. Source: county tax records.
Cash-flow waterfall
monthlySold comps — $/sqft
last 12 mo · ≤1 miLoading sold comps…