621 William St · Effingham, KS
Flood risk 1/10 · Minimal
- FEMA flood zone
- X (unshaded)
- Chance of flooding over 30 yrs
- 0.0%
- Est. flood insurance / yr
- $473 – $860
Fire risk 3/10 · Minor
- Est. fire insurance / yr
- $1,154 – $2,142
Heat risk 3/10 · Minor
- Hot days now (above 108°F)
- 7 days/yr
- Hot days in 30 yrs
- 16 days/yr
Wind risk 2/10 · Minimal
- Chance of severe wind over 30 yrs
- —
Air-quality risk 2/10 · Minimal
- Unhealthy air days now
- 1 days/yr
- Unhealthy air days in 30 yrs
- 1 days/yr
Risk factors via First Street. Map © Google.
Why this score? — see what drove the B- grade
The composite is a weighted blend of 9 inputs, each scored 0–100. Each bar is that input's sub-score; the figure is the points it added to the 100-point composite (weight × sub-score).
- Cash flow +25.7/30.0
- DSCR +8.6/10.0
- Appreciation +8.0/10.0
- ARV discount +7.5/15.0
- 1% rule +7.4/10.0
- Livability +3.2/5.0
- Schools +2.6/10.0
- Rent growth +2.5/5.0
- Condition / age +2.5/5.0
$79,000
🖨 Deal sheet (PDF) 📄 Offer letter ✓ Due diligence
Key facts
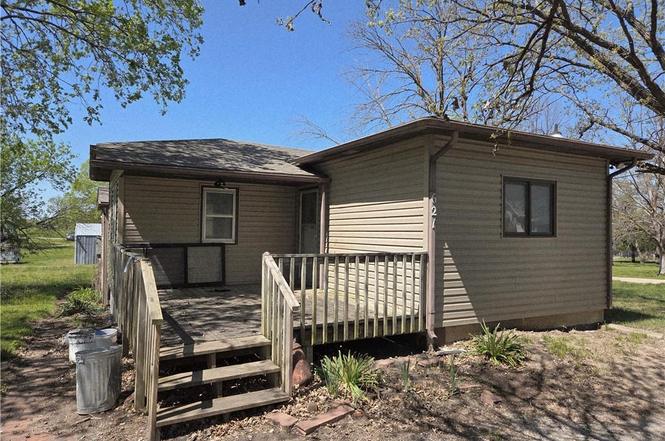
- Huge corner lot
- Nice size island
- Nice front deck
Tags
Property features AI
Finance
- Other: Located inside city limits
- HOA & community: No association fees
Exterior
- Parking: Built-in parking; Basement garage entrance; Carport; 1-car garage
- Utilities: Public water; Public sewer
- Home design: Single family residence; Residential property; Raised ranch floor plan
- Construction: Vinyl siding; Composition roof
- Exterior features: Deck; Shed(s); Corner lot
Interior
- Kitchen: Dishwasher; Disposal; Exhaust fan; Microwave; Refrigerator; Free-standing electric oven
- Bedrooms: 2 bedrooms (1st floor)
- Flooring: Vinyl
- Bathrooms: 2 full bathrooms (one with shower over tub on first floor; one with shower only in basement)
- Heating & cooling: Forced air heating; Electric cooling
- Interior features: Ceiling fan(s); Kitchen island; Eat-in kitchen and formal dining area
- Laundry & utility: Laundry located in bathroom
Neighborhood map
What this means for you Summary
Snapshot
- This is a 2-bed/2.0-bath single-family listed at $79k.
Deal economics
- At list price, monthly cash flow is $190 ($2k/yr) — positive.
- The deal already cash-flows at list — no discount required.
- Meets the 1% rule at list price ($978 rent vs $79k).
- Recommended offer: $70k (12.0% below list) — sets the bar for market timing.
Location & tenants
- Location reads 65/100 on livability (#299 in KS) — a middle-class / working-renter tenant base. Strengths: cost of living A+, housing A+, health & safety A+; Watch: employment C-, crime F, amenities F.
- Atchison County Community Schools (rural): math 24% / reading 36% proficiency, ranked #97 of 169 in KS (top 57%) — families likely to look elsewhere, expect single-tenant / working-renter base with shorter leases.
- Zoned schools: Atchison County Community Elementary School (math 37% / reading 57%, grade D-, #200 of 684 statewide, top 33%, 246 students, 39% FRL); Atchison County Community Jr/Sr High (math 12% / reading 17%, grade F, #267 of 327 statewide, top 84%, 264 students, 47% FRL) — zoned schools at 43% FRL track the district average.
- Market conditions: 9 active listings in the ZIP; 12 units permitted in Atchison County in 2024 (0 in 5+ unit buildings).
Forward outlook
- In year one you build about $5k of equity ($546 loan paydown + $5k appreciation (5.9% local appreciation)).
- Atchison County population projected at -14% by 2050 — secular population decline; favor cash flow + early exit over multi-decade hold.
- At projected returns (5.9% appreciation + 3.0% rent growth), your $22k cash investment doubles in ~3 years — after that, you're playing with house money.
- By year 7, paydown + projected appreciation supports a ~$34k cash-out refi (75% LTV) — recoverable capital for the next deal without selling this one.
Negotiation context
- It's been on market 191 days — a 12% lower offer ($70k) is reasonable based on typical stale-listing flexibility.
Questions for the listing agent
- It's been on market 191 days. Have you received any prior offers? Is the seller open to a 12% concession, seller financing, or rate buy-down credit?
- Built in 1975 — when were the roof, HVAC, electrical panel, plumbing, and water heater last replaced?
- Why hasn't it sold? Are there any deal-killer items the seller is aware of (foundation, flood, title, zoning, code violations)?
- Is there a deadline driving the sale (1031 exchange, divorce, estate, relocation)? That informs how much negotiation room exists.
- Schools are D-rated, which usually means shorter tenancies and higher turnover. Who's the typical renter profile here, and what's been the actual vacancy rate?
- Crime grade is F in this area — have there been break-ins, vandalism, or insurance claims at this property in the last 3 years? What carrier currently insures it and at what premium?
- What's the average days-on-market for RENTAL listings here right now (not sales)? A rising rental-DOM trend means longer vacancies and softer asking-rent achievability than the comps imply.
- What's the recent tenant-quality profile in this submarket — average credit score on applications, eviction rate, late-payment / NSF rate, and stable-employment percentage? A property-management company in the area should have these aggregated.
- How much new for-sale + rental construction is in the pipeline within 1–3 miles? Heavy new supply typically softens prices + rents 12–24 months out; constrained supply supports both.
Investment metrics
- 1% rule
- 1.24% ✓
- Cap rate
- 9.18%
- Cash-on-cash
- 10.30%
- DSCR
- 1.46
- GRM
- 6.7
CMA / ARV
- ARV (on-the-fly)
- $195,300
- Comps found
- 1
Show comp detail 1 sale within ~0.75 mi
| Address | Dist | Beds/Ba | Sqft | Sold | Price | $/sf | Match |
|---|---|---|---|---|---|---|---|
| 5483 Edwards Rd | 0.39mi | 3/2.0 (+1) | 1,232 (+10%) | 22mo | $215,000 | $175 | 41 |
Match score weights: distance 35% · size 25% · config 20% · recency 20%. Top-matched comps best support the ARV.
Projected returns pro-forma
5.94% appreciation · 3.0% rent growth · sell at horizon
- IRR
- 23.8%
- Equity multiple
- 2.57×
- Total profit
- $34,641
- Equity at exit
- $49,346
- IRR
- 22.5%
- Equity multiple
- 5.19×
- Total profit
- $92,579
- Equity at exit
- $89,215
Cash invested: $22,120 (down + closing). Projections, not guarantees.
Landlord ↔ Tenant lean methodology
- Overall (STATE)
- 83 Strongly Landlord-Friendly
- State Kansas
- 83 Strongly Landlord-Friendly · R+10
- County
- — inherits STATE
- City
- — inherits STATE
ZIP-level market 66023
- Home prices YoY
- 2.8%
- Active inventory
- 9
- Price-to-rent
- 6.7×
Monthly cashflow live
- Estimated rent
- $978 medium interval (Pro) →
- Mortgage (P&I)
- −$414
- Tax from tax record
- −$136 /mo · $1,630/yr
- Insurance
- −$33
- HOA
- −$0
- Vacancy / Maint / Mgmt
- −$205
- Net cashflow
- $190
Break-even live
Sensitivity live
| Price | -10% $235 | -5% $212 | +0% $190 | +5% $167 | +10% $145 |
|---|---|---|---|---|---|
| Rent | -10% $113 | -5% $151 | +0% $190 | +5% $228 | +10% $267 |
| Rate | -1.0pp $230 | -0.5pp $210 | base $190 | +0.5pp $169 | +1.0pp $149 |
UW: 25.0% down · 7.5% · 30yr · 1.5% tax · 5.0% vac · 8.0% maint · 8.0% mgmt
Financing live
Cash to close
- Down payment
- $19,750
- Closing costs
- $2,370
- Reserves months
- —
- Total cash needed
- —
Loan-product check · same deal, 3 products live
Conventional
25% down · 7.5% · 30yr
- Down + closing
- —
- Monthly P&I
- —
- Monthly cashflow
- —
- DSCR
- —
- Eligible?
- —
Personal DTI + credit; lowest rate.
DSCR
20% down · 8.5% · 30yr
- Down + closing
- —
- Monthly P&I
- —
- Monthly cashflow
- —
- DSCR
- —
- Eligible?
- —
No personal income docs; deal must DSCR.
Hard money
10% down · 12.0% · 12mo
- Down + closing
- —
- Monthly P&I
- —
- Monthly cashflow
- —
- DSCR
- —
- Eligible?
- —
Short-term bridge; refi at stabilization.
Listing history 15 events
-
2026-06-12statusdays on market $79,000 Pending 191 DOM
-
2026-06-09days on market $79,000 Active 189 DOM
-
2026-06-08days on market $79,000 Active 188 DOM
-
2026-06-07days on market $79,000 Active 187 DOM
-
2026-06-05days on market $79,000 Active 185 DOM
-
2026-06-04days on market $79,000 Active 183 DOM
-
2026-06-02days on market $79,000 Active 182 DOM
-
2026-06-01pricedays on market $79,000 Active 181 DOM
-
2026-05-31days on market $84,000 Active 180 DOM
-
2026-05-31days on market $84,000 Active 179 DOM
-
2026-04-13price $84,000
-
2026-03-20price $89,000
-
2026-02-05price $94,000
-
2025-12-29price $99,000
-
2025-12-02$102,000 Active
ⓘ Source: listings_history table (triggers on properties + properties_extension) + one-shot
backfill from property_details.listing_events for pre-trigger history.
Tax reassessment forecast KS · Resets to sale price
- Current annual tax
- $1,630 · $136/mo
- Projected year-2 tax
- $1,630 · $136/mo
- Expected delta
- $0/yr ($0/mo · 0.0%)
ⓘ Screening estimate from a state-policy table — verify with the county assessor before closing.
Climate risk First Street
- Flood 1/10 Low FEMA zone X (unshaded) · 0% chance over 30 yrs
- Wildfire 3/10 Moderate
- Heat 3/10 Moderate 7 d/yr ≥108°F today · 16 d/yr by 30 yrs out
- Wind 2/10 Low
- Air quality 2/10 Low 1 unhealthy d/yr today · 1 by 30 yrs out
Nearby sold comps map
Loading sold comps map…
Walkable amenities ~0.75 mi
Loading nearby amenities…
Taxation est. · year 1
- Rental income
- $11,740
- − Mortgage interest
- −$4,425
- − Property taxes
- −$1,630
- − Insurance
- −$395
- − Repairs & maintenance
- −$939
- − Management
- −$939
- − Depreciation
- −$2,298
- Taxable income
- $1,113
- Est. tax owed @ 24.0%
- −$267
- After-tax cash flow
- $2,011/yr
For passive investors: Depreciation is non-cash, so a rental often shows a tax loss while cash-flowing — sheltering income. Rental losses are passive: they offset passive income freely, and up to $25,000/yr can offset ordinary (W-2) income if you actively participate and your MAGI is under $100k (phasing out to $0 by $150k); unused losses carry forward. On sale, claimed depreciation is recaptured at up to 25%, and gains may owe capital-gains tax (a 1031 exchange can defer both). Figures are a year-1 estimate at your 24.0% rate — not tax advice; consult a CPA.
Schools (NCES district)
- District
- Atchison County Community Schools
- NCES district ID
- 2005700
- Math proficiency
- 24% ▲ 1.00%
- Reading proficiency
- 36% ▲ 5.00%
- Median HH income
- $48,523
- Composite
- 26.02/100
- National rank
- #7312
- State rank
- #97 of 169 in KS
Livability — Effingham
- Score
- 65/100
- State rank
- #299
- US rank
- #13237
Category grades
Schools grade is shown separately in the Schools card above.
Census & demographics
- Census place
- Effingham, KS
- Population (ZIP)
- 954
Population outlook (Atchison County) Hauer SSP2
- Today (2025)
- 16,056 people
- By 2030
- 15,610 · -2.8%
- By 2040
- 14,691 · -8.5%
- By 2050
- 13,856 · -13.7%
- By 2075
- 12,402 · -22.8%
- By 2100
- 10,883 · -32.2%
Race, ethnicity, and origin ACS 2023
- Neighborhood character
- Predominantly White (92%)
- Race & ethnicity
- White 92% Two or more races 7%
- Common ancestry
- Lithuanian 6% Slovak 4% Portuguese 1%
- Foreign-born
- 0%
Political lean MEDSL · Atchison
- 2024 margin
- Solid R (+37.4) · D 30.3% · R 67.7% · Other 2.0%
- 2008→2024 swing
- -29.7pp toward R · 2008: -7.7pp · 2024: -37.4pp
- All cycles
- 2024: R+37.4 2020: R+34.4 2016: R+31.8 2012: R+20.8 2008: R+7.7
Not yet ingested
- Civics
- —
Market trends
- HPI YoY
- ▲ 5.94%
- Current HPI
- 215.5132
- Rent YoY
- —
- Metro
- —
- State GDP YoY
- —
- F500 in state
- 0
Price history
-17.6% since first listed5 events — show timeline
- 2026-04-13 Price Changed $84,000 Heartland MLS as Distributed by MLS Grid
- 2026-03-20 Price Changed $89,000 Heartland MLS as Distributed by MLS Grid
- 2026-02-05 Price Changed $94,000 Heartland MLS as Distributed by MLS Grid
- 2025-12-29 Price Changed $99,000 Heartland MLS as Distributed by MLS Grid
- 2025-12-02 Listed $102,000 Heartland MLS as Distributed by MLS Grid
Property tax history
+8.1%/yrLatest (2025): $1,630 · +17.9% YoY. Source: county tax records.
Cash-flow waterfall
monthlySold comps — $/sqft
last 12 mo · ≤1 miLoading sold comps…