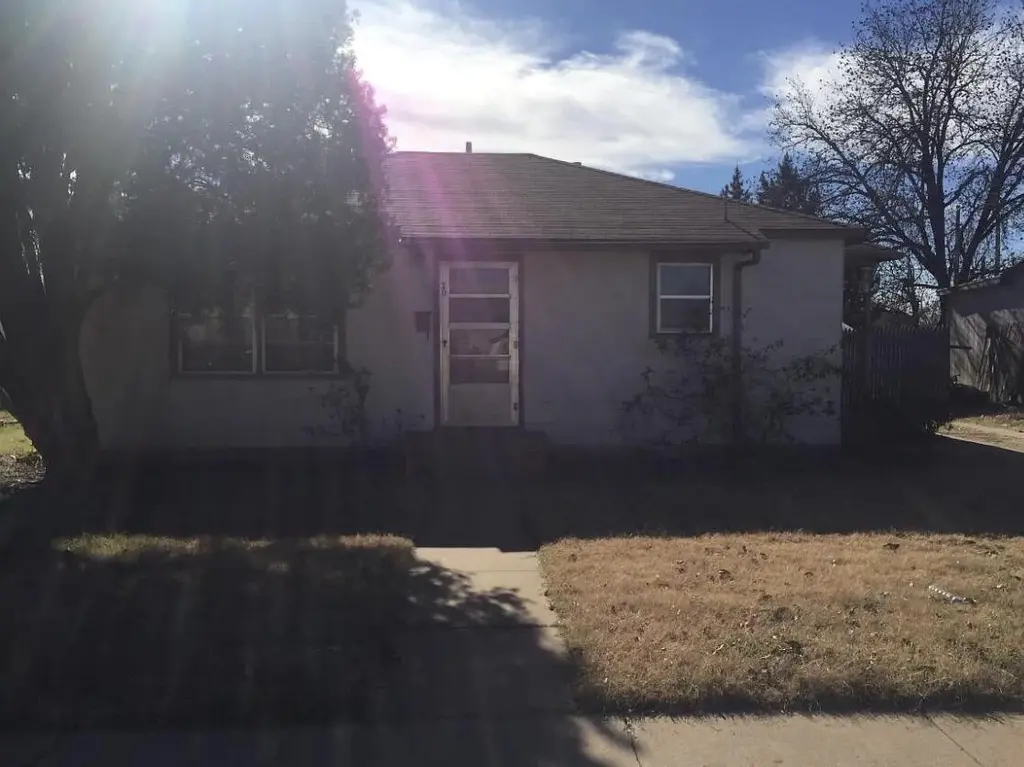
2011 37th St · Lubbock, TX
Flood risk 1/10 · Minimal
- FEMA flood zone
- X (unshaded)
- Chance of flooding over 30 yrs
- 0.0%
- Est. flood insurance / yr
- $507 – $1,088
Fire risk 1/10 · Minimal
- Est. fire insurance / yr
- $1,222 – $2,270
Heat risk 5/10 · Moderate
- Hot days now (above 99°F)
- 7 days/yr
- Hot days in 30 yrs
- 21 days/yr
Wind risk 2/10 · Minimal
- Chance of severe wind over 30 yrs
- —
Air-quality risk 2/10 · Minimal
- Unhealthy air days now
- 1 days/yr
- Unhealthy air days in 30 yrs
- 1 days/yr
Risk factors via First Street. Map © Google.
Why this score? — see what drove the C+ grade
The composite is a weighted blend of 9 inputs, each scored 0–100. Each bar is that input's sub-score; the figure is the points it added to the 100-point composite (weight × sub-score).
- Cash flow +21.9/30.0
- ARV discount +15.0/15.0
- DSCR +7.0/10.0
- 1% rule +6.3/10.0
- Livability +4.0/5.0
- Rent growth +3.5/5.0
- Schools +3.1/10.0
- Condition / age +2.5/5.0
- Appreciation +0.0/10.0
$82,000
🖨 Deal sheet 📄 Offer letter ✓ Due diligence
Listing remarks MLS
Great little house near Tech. This charming house is a smart buy at under 100k. Don't let this one go. Come take a look.
Key facts
- 7,288 sq ft lot
- Built 1957
- Listed 129 days
Neighborhood map
What this means for you Summary
Snapshot
- This is a 2-bed/1.0-bath single-family listed at $82k.
Deal economics
- At list price, monthly cash flow is $129 ($2k/yr) — positive.
- The deal already cash-flows at list — no discount required.
- Meets the 1% rule at list price ($929 rent vs $82k).
- Recommended offer: $72k (12.0% below list) — sets the bar for market timing.
Location & tenants
- Location reads 80/100 on livability (#37 in TX, #1,749 nationally) — a professional / high-income tenant draw. Strengths: commute A+, cost of living A+, housing A+; Watch: employment C-, schools D+, crime F.
- Lubbock ISD (urban): math 36% / reading 39% proficiency, ranked #481 of 826 in TX (top 58%) — families likely to look elsewhere, expect single-tenant / working-renter base with shorter leases; 60% free/reduced lunch — lower-income household profile, screen leases tightly.
- Market conditions: Rents rising (+3.9%/yr); 110 active listings in the ZIP; 40 comparable units currently listed for rent nearby; rentals at typical pace (median 21d on market — plan ~3-4 weeks tenant-placement turnaround); 2,219 units permitted in Lubbock County in 2024 (252 in 5+ unit buildings).
Forward outlook
- Local home prices are declining (-3.0%/yr); year-one equity from $567 of loan paydown is wiped out by about $2k of value loss. Plan a longer hold.
- Lubbock County population projected at +39% by 2050 — long-run rental-demand tailwind backs the buy-and-hold thesis.
Negotiation context
- It's been on market 129 days — a 12% lower offer ($72k) is reasonable based on typical stale-listing flexibility.
Risks & watch-outs
- Watch-outs: built in 1957 — expect roof / HVAC / electrical / plumbing capex.
- Climate carrying-cost: extreme-heat days projected 7→21/yr by 2055 (HVAC capex compounding) — expect insurance premiums to compound above CPI over the hold.
Questions for the listing agent
- It's been on market 129 days. Have you received any prior offers? Is the seller open to a 12% concession, seller financing, or rate buy-down credit?
- Built in 1957 — when were the roof, HVAC, electrical panel, plumbing, and water heater last replaced?
- Why hasn't it sold? Are there any deal-killer items the seller is aware of (foundation, flood, title, zoning, code violations)?
- Is there a deadline driving the sale (1031 exchange, divorce, estate, relocation)? That informs how much negotiation room exists.
- Schools are D-rated, which usually means shorter tenancies and higher turnover. Who's the typical renter profile here, and what's been the actual vacancy rate?
- Crime grade is F in this area — have there been break-ins, vandalism, or insurance claims at this property in the last 3 years? What carrier currently insures it and at what premium?
- What's the average days-on-market for RENTAL listings here right now (not sales)? A rising rental-DOM trend means longer vacancies and softer asking-rent achievability than the comps imply.
- What's the recent tenant-quality profile in this submarket — average credit score on applications, eviction rate, late-payment / NSF rate, and stable-employment percentage? A property-management company in the area should have these aggregated.
- How much new for-sale + rental construction is in the pipeline within 1–3 miles? Heavy new supply typically softens prices + rents 12–24 months out; constrained supply supports both.
Investment metrics
- 1% rule
- 1.13% ✓
- Cap rate
- 8.19%
- Cash-on-cash
- 6.76%
- DSCR
- 1.30
- GRM
- 7.4
CMA / ARV
- ARV (median comp)
- $132,051
- List price
- $82,000
- Delta
- -37.90%
- Verdict
- UNDERPRICED
- Comps
- 2 within 2.0 mi
Projected returns pro-forma
-3.0% appreciation · 3.87% rent growth · sell at horizon
- IRR
- -4.8%
- Equity multiple
- 0.82×
- Total profit
- $-4,195
- Equity at exit
- $12,226
- IRR
- 5.9%
- Equity multiple
- 1.46×
- Total profit
- $10,528
- Equity at exit
- $7,090
Cash invested: $22,960 (down + closing). Projections, not guarantees.
Landlord ↔ Tenant lean methodology
- Overall (STATE)
- 87 Strongly Landlord-Friendly
- State Texas
- 87 Strongly Landlord-Friendly · R+5
- County
- — inherits STATE
- City
- — inherits STATE
ZIP-level market 79412
- Home prices YoY
- -15.3%
- Rents YoY
- 3.9%
- Active inventory
- 110
- Price-to-rent
- 7.4×
Monthly cashflow live
- Estimated rent
- $929 high interval (Pro) →
- Mortgage (P&I)
- −$430
- Tax from tax record
- −$140 /mo · $1,683/yr
- Insurance
- −$34
- HOA
- −$0
- Vacancy / Maint / Mgmt
- −$195
- Net cashflow
- $129
Break-even live
UW: 25.0% down · 7.5% · 30yr · 1.5% tax · 5.0% vac · 8.0% maint · 8.0% mgmt
Financing live
Cash to close
- Down payment
- $20,500
- Closing costs
- $2,460
- Reserves months
- —
- Total cash needed
- —
Loan-product check · same deal, 3 products live
Conventional
25% down · 7.5% · 30yr
- Down + closing
- —
- Monthly P&I
- —
- Monthly cashflow
- —
- DSCR
- —
- Eligible?
- —
Personal DTI + credit; lowest rate.
DSCR
20% down · 8.5% · 30yr
- Down + closing
- —
- Monthly P&I
- —
- Monthly cashflow
- —
- DSCR
- —
- Eligible?
- —
No personal income docs; deal must DSCR.
Hard money
10% down · 12.0% · 12mo
- Down + closing
- —
- Monthly P&I
- —
- Monthly cashflow
- —
- DSCR
- —
- Eligible?
- —
Short-term bridge; refi at stabilization.
Rent comps 40 comps
| Address | Beds | Baths | Sqft | Rent | $/sqft | DOM | Units | Dist |
|---|---|---|---|---|---|---|---|---|
| 2108 38th St Lubbock, TX | 3.0 | 2.0 | 1124 | $900 | $0.80 | 43d | 1 | 0.09mi |
| 2011 35th St Lubbock, TX | 2.0 | 1.0 | 810 | $800 | $0.99 | 43d | 1 | 0.16mi |
| 2107 35th St Unit A Lubbock, TX | 2.0 | 1.0 | 1025 | $800 | $0.78 | 43d | 1 | 0.17mi |
| 1919 34th St Lubbock, TX | 2.0 | 2.0 | 1463 | $1,100 | $0.75 | 13d | 1 | 0.19mi |
| 2208 35th St Unit B Lubbock, TX | 2.0 | 1.0 | 767 | $750 | $0.98 | 43d | 1 | 0.27mi |
| 2103 33rd St Lubbock, TX | 2.0 | 1.0 | 1075 | $700 | $0.65 | 13d | 1 | 0.28mi |
| 2217 36th St Lubbock, TX | 3.0 | 1.0 | 1284 | $1,109 | $0.86 | 13d | 1 | 0.28mi |
| 2304 39th St Lubbock, TX | 2.0 | 1.0 | 830 | $1,150 | $1.39 | 21d | 1 | 0.32mi |
| 2211 33rd St Unit A Lubbock, TX | 3.0 | 1.5 | 1293 | $1,200 | $0.93 | 43d | 1 | 0.33mi |
| 2302 40th St Lubbock, TX | 2.0 | 1.0 | 793 | $749 | $0.94 | 21d | 1 | 0.33mi |
| 1712 42nd St Unit B Lubbock, TX | 3.0 | 1.0 | 899 | $695 | $0.77 | 21d | 1 | 0.34mi |
| 2003 32nd St Unit A Lubbock, TX | 2.0 | 2.0 | 1228 | $1,150 | $0.94 | 43d | 1 | 0.35mi |
| 2119 32nd St Lubbock, TX | 2.0 | 1.0 | 1055 | $950 | $0.90 | 43d | 1 | 0.36mi |
| 2106 32nd St Lubbock, TX | 3.0 | 1.0 | 1398 | $695 | $0.50 | 21d | 1 | 0.38mi |
| 2106 32nd St Lubbock, TX | 3.0 | 1.0 | 1398 | $925 | $0.66 | 43d | 1 | 0.38mi |
| 1920 45th St Lubbock, TX | 3.0 | 1.0 | 1200 | $1,200 | $1.00 | 21d | 1 | 0.45mi |
| 2315 32nd St Lubbock, TX | 2.0 | 1.0 | 900 | $995 | $1.11 | 21d | 1 | 0.48mi |
| 2408 35th St Lubbock, TX | 2.0 | 1.0 | 1072 | $995 | $0.93 | 21d | 1 | 0.50mi |
| 1710 45th St Unit A Lubbock, TX | 2.0 | 1.0 | 714 | $595 | $0.83 | 13d | 1 | 0.52mi |
| 2420 33rd St Lubbock, TX | 2.0 | 1.0 | 800 | $799 | $1.00 | 21d | 1 | 0.57mi |
| 2506 37th St Lubbock, TX | 3.0 | 1.0 | 1053 | $1,550 | $1.47 | 21d | 1 | 0.58mi |
| 2120 47th St Lubbock, TX | 2.0 | 1.0 | 793 | $795 | $1.00 | 21d | 1 | 0.59mi |
| 2508 37th St Lubbock, TX | 3.0 | 2.5 | 1495 | $1,700 | $1.14 | 43d | 1 | 0.59mi |
| 2411 31st St Lubbock, TX | 3.0 | 1.0 | 1003 | $1,000 | $1.00 | 21d | 1 | 0.60mi |
| 1604 45th St Lubbock, TX | 1.0 | 1.0 | 700 | $650 | $0.93 | 43d | 1 | 0.61mi |
| 2201 28th St Lubbock, TX | 3.0 | 1.0 | 1246 | $995 | $0.80 | 21d | 1 | 0.63mi |
| 2419 31st St Apt B Lubbock, TX | 2.0 | 1.0 | 878 | $795 | $0.91 | 13d | 1 | 0.63mi |
| 2400 44th St Lubbock, TX | 1.0–3.0 | 1.0–2.0 | 1015 | $1,010 | $1.00 | 13d | 23 | 0.63mi |
| 1312 40th St Lubbock, TX | 3.0 | 1.0 | 940 | $795 | $0.85 | 21d | 1 | 0.64mi |
| 1717 47th St Unit B Lubbock, TX | 3.0 | 1.0 | 830 | $775 | $0.93 | 21d | 1 | 0.64mi |
| 2401 45th St Lubbock, TX | 1.0–2.0 | 1.0 | 680 | $845 | $1.24 | 13d | 3 | 0.66mi |
| 2402 46th St Unit B Lubbock, TX | 2.0 | 1.0 | 942 | $745 | $0.79 | 21d | 1 | 0.66mi |
| 2514 42nd St Lubbock, TX | 3.0 | 1.0 | 943 | $950 | $1.01 | 13d | 1 | 0.67mi |
| 2409 45th St Unit 8 Lubbock, TX | 2.0 | 1.0 | 800 | $895 | $1.12 | 43d | 1 | 0.67mi |
| 2406 46th St Unit A Lubbock, TX | 2.0 | 1.0 | 943 | $775 | $0.82 | 21d | 1 | 0.67mi |
| 2521 40th St Lubbock, TX | 2.0 | 1.0 | 902 | $1,195 | $1.32 | 21d | 1 | 0.68mi |
| 2504 44th St Lubbock, TX | 2.0 | 1.0 | 939 | $995 | $1.06 | 43d | 1 | 0.68mi |
| 2007 27th St Lubbock, TX | 2.0 | 1.0 | 1044 | $1,250 | $1.20 | 43d | 1 | 0.69mi |
| 2316 47th St Lubbock, TX | 3.0 | 2.0 | 1285 | $1,400 | $1.09 | 21d | 1 | 0.69mi |
| 2115 27th St Unit A Lubbock, TX | 2.0 | 1.0 | 1148 | $875 | $0.76 | 21d | 1 | 0.69mi |
Listing history 21 events
-
2026-06-18days on market $82,000 Active 129 DOM
-
2026-06-17days on market $82,000 Active 128 DOM
-
2026-06-16days on market $82,000 Active 127 DOM
-
2026-06-15days on market $82,000 Active 126 DOM
-
2026-06-14days on market $82,000 Active 124 DOM
-
2026-06-13days on market $82,000 Active 123 DOM
-
2026-06-10days on market $82,000 Active 121 DOM
-
2026-06-09days on market $82,000 Active 120 DOM
-
2026-06-08days on market $82,000 Active 119 DOM
-
2026-06-07days on market $82,000 Active 118 DOM
-
2026-06-05days on market $82,000 Active 115 DOM
-
2026-06-03days on market $82,000 Active 114 DOM
-
2026-06-02days on market $82,000 Active 113 DOM
-
2026-06-01days on market $82,000 Active 112 DOM
-
2026-05-31days on market $82,000 Active 111 DOM
-
2026-05-30days on market $82,000 Active 110 DOM
-
2026-03-12price $84,000 120-char remark
Show marketing remark (120 chars)
Great little house near Tech. This charming house is a smart buy at under 100k. Don't let this one go. Come take a look.
-
2026-03-07price $85,900 120-char remark
Show marketing remark (120 chars)
Great little house near Tech. This charming house is a smart buy at under 100k. Don't let this one go. Come take a look.
-
2026-02-10$89,990 Active 120-char remark
Show marketing remark (120 chars)
Great little house near Tech. This charming house is a smart buy at under 100k. Don't let this one go. Come take a look.
-
2017-08-31soldstatus
-
1991-06-01soldstatus
ⓘ Source: listings_history table (triggers on properties + properties_extension) + one-shot
backfill from property_details.listing_events for pre-trigger history.
Tax reassessment forecast TX · Resets to sale price
- Current annual tax
- $1,683 · $140/mo
- Projected year-2 tax
- $1,683 · $140/mo
- Expected delta
- $0/yr ($0/mo · 0.0%)
ⓘ Screening estimate from a state-policy table — verify with the county assessor before closing.
Climate risk First Street
- Flood 1/10 Low FEMA zone X (unshaded) · 0% chance over 30 yrs
- Wildfire 1/10 Low
- Heat 5/10 Major 7 d/yr ≥99°F today · 21 d/yr by 30 yrs out
- Wind 2/10 Low
- Air quality 2/10 Low 1 unhealthy d/yr today · 1 by 30 yrs out
Nearby sold comps map
Loading sold comps map…
Walkable amenities ~0.75 mi
Loading nearby amenities…
Taxation est. · year 1
- Rental income
- $11,145
- − Mortgage interest
- −$4,593
- − Property taxes
- −$1,683
- − Insurance
- −$410
- − Repairs & maintenance
- −$892
- − Management
- −$892
- − Depreciation
- −$2,385
- Taxable income
- $290
- Est. tax owed @ 24.0%
- −$70
- After-tax cash flow
- $1,482/yr
For passive investors: Depreciation is non-cash, so a rental often shows a tax loss while cash-flowing — sheltering income. Rental losses are passive: they offset passive income freely, and up to $25,000/yr can offset ordinary (W-2) income if you actively participate and your MAGI is under $100k (phasing out to $0 by $150k); unused losses carry forward. On sale, claimed depreciation is recaptured at up to 25%, and gains may owe capital-gains tax (a 1031 exchange can defer both). Figures are a year-1 estimate at your 24.0% rate — not tax advice; consult a CPA.
Schools (NCES district)
- District
- Lubbock ISD
- NCES district ID
- 4828500
- Math proficiency
- 36% ▼ -8.00%
- Reading proficiency
- 39% ▼ -1.00%
- Median HH income
- $39,820
- Composite
- 31.44/100
- National rank
- #5984
- State rank
- #481 of 826 in TX
Livability — Lubbock
- Score
- 80/100
- State rank
- #37
- US rank
- #1749
Category grades
Schools grade is shown separately in the Schools card above.
Census & demographics
- Census place
- Lubbock, TX
- County
- Lubbock County · 293,542 people
- City population
- 283,030
- Metro
- Lubbock, TX
- Population (ZIP)
- 15,018
- Household income
- $48,878
- Rent vs Own
- Severe rent burden
- 676.0
Population outlook (Lubbock County) Hauer SSP2
- Today (2025)
- 345,960 people
- By 2030
- 371,449 · +7.4%
- By 2040
- 424,539 · +22.7%
- By 2050
- 481,150 · +39.1%
- By 2075
- 633,467 · +83.1%
- By 2100
- 746,853 · +115.9%
Race, ethnicity, and origin ACS 2023
- Neighborhood character
- Diverse neighborhood (Simpson 0.56)
- Race & ethnicity
- Hispanic / Latino 61% Two or more races 25% White 25% Black 10%
- Hispanic origin (detail)
- Mexican 51% Puerto Rican 2%
- Common ancestry
- Lithuanian 1% Serbian 1% Italian 1%
- Foreign-born
- 5% · Canada
- Languages at home
- 67% English-only · Spanish 32% Arabic 1%
Political lean MEDSL · Lubbock
- 2024 margin
- Solid R (+39.5) · D 29.7% · R 69.2% · Other 1.0%
- 2008→2024 swing
- -2.8pp toward R · 2008: -36.7pp · 2024: -39.5pp
- All cycles
- 2024: R+39.5 2020: R+32.2 2016: R+38.4 2012: R+40.9 2008: R+36.7
Not yet ingested
- Civics
- —
Market trends
- HPI YoY
- ▼ -33.95%
- Current HPI
- 188.4033
- Rent YoY
- ▲ 3.87%
- Metro
- Lubbock, TX
- State GDP YoY
- ▲ 3.95%
- F500 in state
- 110
Industry mix (Fortune 500 HQ in TX)
| Industry | F500 HQs | Revenue |
|---|---|---|
| Energy | 16 | $1,198B |
|
||
| Technology | 5 | $198B |
|
||
| Engineering / Construction | 4 | $72B |
|
||
| Energy Services | 3 | $60B |
|
||
| Utilities | 3 | $41B |
|
||
| Healthcare | 2 | $330B |
|
||
Price history
-6.7% since first listed5 events — show timeline
- 2026-03-12 Price Changed $84,000 LARMLS
- 2026-03-07 Price Changed $85,900 LARMLS
- 2026-02-10 Listed $89,990 LARMLS
- 2017-08-31 Sold (Public Records) — Public Records
- 1991-06-01 Sold (Public Records) — Public Records
Property tax history
+5.1%/yrLatest (2025): $1,683 · -5.2% YoY. Source: county tax records.
Cash-flow waterfall
monthlySold comps — $/sqft
last 12 mo · ≤1 miLoading sold comps…