 🏷️ Likely Rental
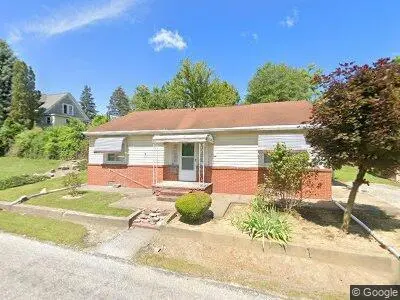
1071 Tenney Ave · Amherst, OH
Flood risk 4/10 · Minor
- FEMA flood zone
- X (unshaded)
- Chance of flooding over 30 yrs
- 0.24%
- Est. flood insurance / yr
- $473 – $860
Fire risk 1/10 · Minimal
- Est. fire insurance / yr
- $713 – $1,323
Heat risk 3/10 · Minor
- Hot days now (above 98°F)
- 7 days/yr
- Hot days in 30 yrs
- 16 days/yr
Wind risk 1/10 · Minimal
- Chance of severe wind over 30 yrs
- —
Air-quality risk 3/10 · Minor
- Unhealthy air days now
- 3 days/yr
- Unhealthy air days in 30 yrs
- 4 days/yr
Risk factors via First Street. Map © Google.
Why this score? — see what drove the B- grade
The composite is a weighted blend of 9 inputs, each scored 0–100. Each bar is that input's sub-score; the figure is the points it added to the 100-point composite (weight × sub-score).
- Cash flow +24.4/30.0
- ARV discount +15.0/15.0
- DSCR +7.9/10.0
- 1% rule +5.9/10.0
- Schools +5.9/10.0
- Livability +4.0/5.0
- Rent growth +2.5/5.0
- Condition / age +2.5/5.0
- Appreciation +0.0/10.0
$125,000
🖨 Deal sheet 📄 Offer letter ✓ Due diligence
Listing remarks MLS
Amherst Township Ranch, 3 Bedroom, 1 bath, 1204 Sq. Ft. Amherst utilities, new furnace 2026. Located off Park Ave. Taylor St. Close to All major highways. Tenant occupied until April 15, 2026.
Key facts
- Built 1900
- Listed 37 days
Neighborhood map
What this means for you Summary
Snapshot
- This is a 3-bed/1.0-bath single-family listed at $125k.
Deal economics
- At list price, monthly cash flow is $253 ($3k/yr) — positive.
- The deal already cash-flows at list — no discount required.
- Meets the 1% rule at list price ($1k rent vs $125k).
- Recommended offer: $121k (3.0% below list) — sets the bar for market timing.
- Cap rate 8.7% vs local median 3.9% in Amherst — top-decile yield for the area; either an underpriced asset or a hidden risk that comps aren't pricing in. Stress-test before assuming the spread holds.
Location & tenants
- Location reads 81/100 on livability (#100 in OH, #1,523 nationally) — a professional / high-income tenant draw. Strengths: schools A+, cost of living A+, housing A+; Watch: amenities D-, commute F.
- Amherst Exempted Village (suburban): math 66% / reading 69% proficiency, ranked #160 of 656 in OH (top 24%) — acceptable for families but not a draw, mixed tenant base, ~2y average lease; only 18% free/reduced lunch — higher-income household profile.
- Market conditions: 116 active listings in the ZIP; 4 comparable units currently listed for rent nearby; rentals leasing fast (median 2d on market — plan ~1-2 weeks tenant-placement turnaround); solid renter incomes; 1,098 units permitted in Lorain County in 2024 (20 in 5+ unit buildings).
Forward outlook
- Local home prices are declining (-3.0%/yr); year-one equity from $864 of loan paydown is wiped out by about $4k of value loss. Plan a longer hold.
Negotiation context
- It's been on market 37 days — a 3% lower offer ($121k) is reasonable based on typical stale-listing flexibility.
- 3 sale attempts since 30y ago; this cycle's ask is 4% above the opening price — seller raised mid-cycle; expect resistance to lowballs.
Risks & watch-outs
- Watch-outs: built in 1900 — expect roof / HVAC / electrical / plumbing capex.
Questions for the listing agent
- It's been on market 37 days. Have you received any prior offers? Is the seller open to a 3% concession, seller financing, or rate buy-down credit?
- Built in 1900 — when were the roof, HVAC, electrical panel, plumbing, and water heater last replaced?
- Is there a deadline driving the sale (1031 exchange, divorce, estate, relocation)? That informs how much negotiation room exists.
- Schools are A-rated — typically a magnet for longer-tenancy family renters. What's the average tenant stay here, and is there a school-zone premium baked into asking?
- What's the average days-on-market for RENTAL listings here right now (not sales)? A rising rental-DOM trend means longer vacancies and softer asking-rent achievability than the comps imply.
- What's the recent tenant-quality profile in this submarket — average credit score on applications, eviction rate, late-payment / NSF rate, and stable-employment percentage? A property-management company in the area should have these aggregated.
- How much new for-sale + rental construction is in the pipeline within 1–3 miles? Heavy new supply typically softens prices + rents 12–24 months out; constrained supply supports both.
Investment metrics
- 1% rule
- 1.09% ✓
- Cap rate
- 8.73%
- Cash-on-cash
- 8.69%
- DSCR
- 1.39
- GRM
- 7.6
CMA / ARV
- ARV (on-the-fly)
- $228,760
- Comps found
- 12
Show comp detail 12 sales within ~0.75 mi
| Address | Dist | Beds/Ba | Sqft | Sold | Price | $/sf | Match |
|---|---|---|---|---|---|---|---|
| 1071 Tenney Ave | 0.00mi | 3/1.0 | 1,204 (0%) | 2mo | $119,900 | $100 | 98 |
| 165 Woodhill Dr | 0.20mi | 3/2.0 | 1,216 (+1%) | 2mo | $269,900 | $222 | 84 |
| 1150 Woodside Dr | 0.21mi | 2/1.0 (-1) | 1,291 (+7%) | 1mo | $229,000 | $177 | 72 |
| 133 Forest St | 0.45mi | 3/1.5 | 1,201 (-0%) | 5mo | $235,000 | $196 | 72 |
| 154 Walnut Dr | 0.28mi | 3/2.5 | 1,216 (+1%) | 10mo | $270,000 | $222 | 71 |
| 380 Broadway St | 0.19mi | 2/1.0 (-1) | 1,320 (+10%) | 0mo | $196,000 | $148 | 70 |
| 179 Jackson St | 0.21mi | 2/1.0 (-1) | 1,280 (+6%) | 7mo | $185,000 | $145 | 69 |
| 145 Pearl St | 0.38mi | 4/3.0 (+1) | 1,198 (-0%) | 2mo | $210,000 | $175 | 67 |
| 147 Central Dr | 0.34mi | 3/1.5 | 1,100 (-9%) | 1mo | $235,000 | $214 | 67 |
| 613 Jackson St | 0.46mi | 3/1.5 | 1,078 (-10%) | 2mo | $205,000 | $190 | 58 |
| 135 Ridgeland Dr | 0.55mi | 3/2.0 | 1,300 (+8%) | 4mo | $262,500 | $202 | 54 |
| 46580 Middle Rdg | 0.74mi | 3/1.5 | 1,364 (+13%) | 3mo | $234,000 | $172 | 39 |
Match score weights: distance 35% · size 25% · config 20% · recency 20%. Top-matched comps best support the ARV.
Projected returns pro-forma
-3.0% appreciation · 3.0% rent growth · sell at horizon
- IRR
- -3.1%
- Equity multiple
- 0.88×
- Total profit
- $-4,112
- Equity at exit
- $18,638
- IRR
- 6.6%
- Equity multiple
- 1.49×
- Total profit
- $17,201
- Equity at exit
- $10,808
Cash invested: $35,000 (down + closing). Projections, not guarantees.
Landlord ↔ Tenant lean methodology
- Overall (STATE)
- 73 Landlord-Friendly
- State Ohio
- 73 Landlord-Friendly · R+6
- County
- — inherits STATE
- City
- — inherits STATE
ZIP-level market 44001
- Active inventory
- 116
- Price-to-rent
- 7.6×
Monthly cashflow live
- Estimated rent
- $1,368 medium interval (Pro) →
- Mortgage (P&I)
- −$656
- Tax from tax record
- −$120 /mo · $1,435/yr
- Insurance
- −$52
- HOA
- −$0
- Vacancy / Maint / Mgmt
- −$287
- Net cashflow
- $253
Break-even live
UW: 25.0% down · 7.5% · 30yr · 1.5% tax · 5.0% vac · 8.0% maint · 8.0% mgmt
Financing live
Cash to close
- Down payment
- $31,250
- Closing costs
- $3,750
- Reserves months
- —
- Total cash needed
- —
Loan-product check · same deal, 3 products live
Conventional
25% down · 7.5% · 30yr
- Down + closing
- —
- Monthly P&I
- —
- Monthly cashflow
- —
- DSCR
- —
- Eligible?
- —
Personal DTI + credit; lowest rate.
DSCR
20% down · 8.5% · 30yr
- Down + closing
- —
- Monthly P&I
- —
- Monthly cashflow
- —
- DSCR
- —
- Eligible?
- —
No personal income docs; deal must DSCR.
Hard money
10% down · 12.0% · 12mo
- Down + closing
- —
- Monthly P&I
- —
- Monthly cashflow
- —
- DSCR
- —
- Eligible?
- —
Short-term bridge; refi at stabilization.
Rent comps 4 comps
| Address | Beds | Baths | Sqft | Rent | $/sqft | DOM | Units | Dist |
|---|---|---|---|---|---|---|---|---|
| 352 Broadway St Amherst, OH | 2.0 | 1.0 | 756 | $1,095 | $1.45 | 1d | 1 | 0.07mi |
| 566 Jackson St Amherst, OH | 3.0 | 2.0 | 1303 | $1,595 | $1.22 | 1d | 1 | 0.40mi |
| 275 Cornell Ave Amherst, OH | 3.0 | 1.5 | 1201 | $1,873 | $1.56 | 7d | 1 | 0.68mi |
| 1120 Red Thimbleberry Dr Elyria, OH | 2.0 | 2.0 | 1457 | $2,152 | $1.48 | 1d | 23 | 1.47mi |
Listing history 21 events
-
2026-06-18days on market $125,000 Active 37 DOM
-
2026-06-17days on market $125,000 Active 36 DOM
-
2026-06-16days on market $125,000 Active 35 DOM
-
2026-06-15days on market $125,000 Active 34 DOM
-
2026-06-13days on market $125,000 Active 32 DOM
-
2026-06-13days on market $125,000 Active 31 DOM
-
2026-06-09days on market $125,000 Active 28 DOM
-
2026-06-08days on market $125,000 Active 27 DOM
-
2026-06-07days on market $125,000 Active 26 DOM
-
2026-06-03days on market $125,000 Active 22 DOM
-
2026-06-02days on market $125,000 Active 21 DOM
-
2026-06-01days on market $125,000 Active 20 DOM
-
2026-05-31days on market $125,000 Active 19 DOM
-
2026-05-13price $125,000 47-char remark
-
2026-05-12$120,000 Active 47-char remark
-
2026-04-13soldstatus $119,900 Closed 193-char remark
Show marketing remark (193 chars)
Amherst Township Ranch, 3 Bedroom, 1 bath, 1204 Sq. Ft. Amherst utilities, new furnace 2026. Located off Park Ave. Taylor St. Close to All major highways. Tenant occupied until April 15, 2026.
-
2026-04-02status Pending 193-char remark
Show marketing remark (193 chars)
Amherst Township Ranch, 3 Bedroom, 1 bath, 1204 Sq. Ft. Amherst utilities, new furnace 2026. Located off Park Ave. Taylor St. Close to All major highways. Tenant occupied until April 15, 2026.
-
2026-03-24$119,900 Active 193-char remark
Show marketing remark (193 chars)
Amherst Township Ranch, 3 Bedroom, 1 bath, 1204 Sq. Ft. Amherst utilities, new furnace 2026. Located off Park Ave. Taylor St. Close to All major highways. Tenant occupied until April 15, 2026.
-
1997-03-17soldstatus $60,000
Show marketing remark (124 chars)
Best Value In Amherst!newer Roof & Hot Water Tank Needs Some Finishing/No Fha Or Va Please Call 1-800-974-4161 To Show
-
1997-02-28soldstatus $60,000
-
1996-12-19$73,500
Show marketing remark (124 chars)
Best Value In Amherst!newer Roof & Hot Water Tank Needs Some Finishing/No Fha Or Va Please Call 1-800-974-4161 To Show
ⓘ Source: listings_history table (triggers on properties + properties_extension) + one-shot
backfill from property_details.listing_events for pre-trigger history.
Tax reassessment forecast OH · Partial reset (capped growth)
- Current annual tax
- $1,435 · $120/mo
- Projected year-2 tax
- $1,692 · $141/mo
- Expected delta
- +$258/yr (+$21/mo · 17.9%)
ⓘ Screening estimate from a state-policy table — verify with the county assessor before closing.
Climate risk First Street
- Flood 4/10 Moderate FEMA zone X (unshaded) · 24% chance over 30 yrs
- Wildfire 1/10 Low
- Heat 3/10 Moderate 7 d/yr ≥98°F today · 16 d/yr by 30 yrs out
- Wind 1/10 Low
- Air quality 3/10 Moderate 3 unhealthy d/yr today · 4 by 30 yrs out
Nearby sold comps map
Loading sold comps map…
Walkable amenities ~0.75 mi
Loading nearby amenities…
Taxation est. · year 1
- Rental income
- $16,415
- − Mortgage interest
- −$7,002
- − Property taxes
- −$1,435
- − Insurance
- −$625
- − Repairs & maintenance
- −$1,313
- − Management
- −$1,313
- − Depreciation
- −$3,636
- Taxable income
- $1,091
- Est. tax owed @ 24.0%
- −$262
- After-tax cash flow
- $2,780/yr
For passive investors: Depreciation is non-cash, so a rental often shows a tax loss while cash-flowing — sheltering income. Rental losses are passive: they offset passive income freely, and up to $25,000/yr can offset ordinary (W-2) income if you actively participate and your MAGI is under $100k (phasing out to $0 by $150k); unused losses carry forward. On sale, claimed depreciation is recaptured at up to 25%, and gains may owe capital-gains tax (a 1031 exchange can defer both). Figures are a year-1 estimate at your 24.0% rate — not tax advice; consult a CPA.
Schools (NCES district)
- District
- Amherst Exempted Village
- NCES district ID
- 3904519
- Math proficiency
- 66% ▼ -15.00%
- Reading proficiency
- 69% ▼ -11.00%
- Median HH income
- $63,459
- Composite
- 58.58/100
- National rank
- #988
- State rank
- #160 of 656 in OH
Livability — Amherst
- Score
- 81/100
- State rank
- #100
- US rank
- #1523
Category grades
Schools grade is shown separately in the Schools card above.
Census & demographics
- County
- Lorain · 305,041 people
- Metro
- Cleveland, OH
- Population (ZIP)
- 21,123
- Household income
- $91,050
- Rent vs Own
- Severe rent burden
- 11.6
Population outlook (Lorain County) Hauer SSP2
- Today (2025)
- 314,924 people
- By 2030
- 317,546 · +0.8%
- By 2040
- 317,962 · +1.0%
- By 2050
- 312,872 · -0.7%
- By 2075
- 301,806 · -4.2%
- By 2100
- 278,271 · -11.6%
Race, ethnicity, and origin ACS 2023
- Neighborhood character
- Predominantly White (87%)
- Race & ethnicity
- White 87% Hispanic / Latino 6% Two or more races 6% Asian 2% Black 1%
- Hispanic origin (detail)
- Mexican 2% Puerto Rican 3%
- Common ancestry
- Romanian 10% Slovak 3% Lithuanian 2%
- Foreign-born
- 3% · Canada, China
- Languages at home
- 96% English-only · Spanish 1% Chinese 1% Other Indo-European 1%
Political lean MEDSL · Lorain
- 2024 margin
- Lean R (+5.7) · D 46.7% · R 52.4%
- 2008→2024 swing
- -23.6pp toward R · 2008: 17.9pp · 2024: -5.7pp
- All cycles
- 2024: R+5.7 2020: R+2.5 2016: R+0.3 2012: D+14.4 2008: D+17.9
Not yet ingested
- Civics
- —
Market trends
- HPI YoY
- ▼ -113.43%
- Current HPI
- 194.6753
- Rent YoY
- —
- Metro
- —
- State GDP YoY
- ▲ 1.98%
- F500 in state
- 48
Industry mix (Fortune 500 HQ in OH)
| Industry | F500 HQs | Revenue |
|---|---|---|
| Insurance | 3 | $145B |
|
||
| Industrial Machinery | 3 | $49B |
|
||
| Financial Services | 3 | $24B |
|
||
| Consumer Goods | 2 | $93B |
|
||
| Aerospace / Defense | 2 | $47B |
|
||
| Utilities | 2 | $33B |
|
||
Price history
+70.1% since first listed8 events — show timeline
- 2026-05-13 Price Changed $125,000 FSBO.com
- 2026-05-12 Listed $120,000 FSBO.com
- 2026-04-13 Sold (MLS) $119,900 MLSNOW
- 2026-04-02 Pending — MLSNOW
- 2026-03-24 Listed $119,900 MLSNOW
- 1997-03-17 Sold (MLS) $60,000 MLSNOW
- 1997-02-28 Sold (Public Records) $60,000 Public Records
- 1996-12-19 Listed $73,500 MLSNOW
Property tax history
+5.3%/yrLatest (2025): $1,435 · +4.0% YoY. Source: county tax records.
Cash-flow waterfall
monthlySold comps — $/sqft
last 12 mo · ≤1 miLoading sold comps…