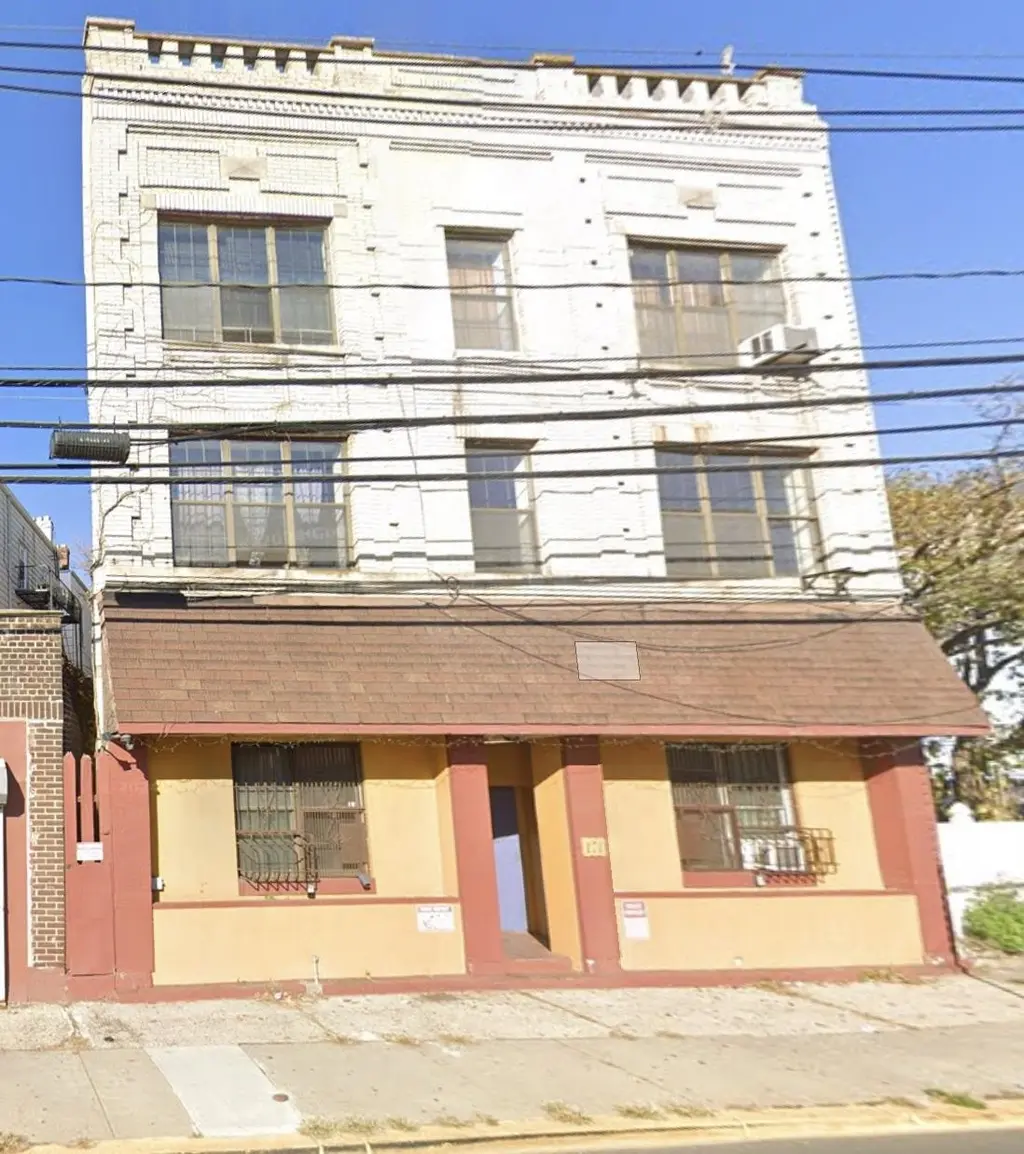
171 OLD BERGEN Rd #202 · Jersey City, NJ
Flood risk 1/10 · Minimal
- FEMA flood zone
- X (unshaded)
- Chance of flooding over 30 yrs
- 0.0%
- Est. flood insurance / yr
- $507 – $1,088
Fire risk 1/10 · Minimal
- Est. fire insurance / yr
- $526 – $976
Heat risk 7/10 · Major
- Hot days now (above 98°F)
- 7 days/yr
- Hot days in 30 yrs
- 15 days/yr
Wind risk 6/10 · Moderate
- Chance of severe wind over 30 yrs
- 27.0%
Air-quality risk 4/10 · Minor
- Unhealthy air days now
- 5 days/yr
- Unhealthy air days in 30 yrs
- 6 days/yr
Risk factors via First Street. Map © Google.
Why this score? — see what drove the D+ grade
The composite is a weighted blend of 9 inputs, each scored 0–100. Each bar is that input's sub-score; the figure is the points it added to the 100-point composite (weight × sub-score).
- Cash flow +15.2/30.0
- ARV discount +7.5/15.0
- 1% rule +6.6/10.0
- DSCR +4.7/10.0
- Livability +3.9/5.0
- Rent growth +2.9/5.0
- Condition / age +2.5/5.0
- Schools +2.4/10.0
- Appreciation +0.0/10.0
$195,000
🖨 Deal sheet 📄 Offer letter ✓ Due diligence
Listing remarks
Great opportunity to purchase a 2 bedroom, 1 bath condo near public transportation, easy access to the city. Hardwood floors, updated kitchen and bath.
Key facts
- Updated bath
- Updated kitchen
- Hardwood floors
Tags
Property features AI
Exterior
- Parking: No parking available
- Home design: Condominium unit (lot #38)
- Exterior features: Near train, bus, parks, and schools; Pets not allowed
Interior
- Kitchen: One kitchen
- Bedrooms: Two bedrooms
- Bathrooms: One full bathroom
- Heating & cooling: Baseboard heating; Gas heat
- Interior features: Gas oven/range; Building has a shared washer/dryer room; Lead paint disclosure provided
- Laundry & utility: Access to a common washer/dryer room
Neighborhood map
What this means for you Summary
Snapshot
- This is a 2-bed/1.0-bath condo listed at $195k.
Deal economics
- At list price, monthly cash flow is $68 ($815/yr) — positive.
- The deal already cash-flows at list — no discount required.
- Meets the 1% rule at list price ($2k rent vs $195k).
- Recommended offer: $192k (1.5% below list) — sets the bar for market timing.
- Cap rate 6.7% vs local median 1.8% in Jersey City — top-decile yield for the area; either an underpriced asset or a hidden risk that comps aren't pricing in. Stress-test before assuming the spread holds.
Location & tenants
- Location reads 77/100 on livability (#116 in NJ, #2,955 nationally) — a middle-class / working-renter tenant base. Strengths: amenities A+, commute A+, employment A+; Watch: crime F, cost of living F.
- Jersey City Public Schools (urban): math 16% / reading 38% proficiency, ranked #369 of 472 in NJ (top 78%) — low school quality limits family demand, transient renter base, plan for 1-2y turnover; 69% free/reduced lunch — lower-income household profile, screen leases tightly.
- Market conditions: Rents rising (+1.6%/yr); 248 active listings in the ZIP; 40 comparable units currently listed for rent nearby; rentals at typical pace (median 25d on market — plan ~3-4 weeks tenant-placement turnaround); solid renter incomes; 5,310 units permitted in Hudson County in 2024 (4,154 in 5+ unit buildings).
- This rent runs 36% of the median local income ($77k/yr) — at the standard rent-burdened threshold; future hikes will face affordability resistance.
Forward outlook
- Local home prices are declining (-3.0%/yr); year-one equity from $1k of loan paydown is wiped out by about $6k of value loss. Plan a longer hold.
- Hudson County population projected at +29% by 2050 — long-run rental-demand tailwind backs the buy-and-hold thesis.
Negotiation context
- It's been on market 24 days — a 2% lower offer ($192k) is reasonable based on typical stale-listing flexibility.
- 2 sale attempts since 2y ago with the ask held roughly flat each time — persistent listings suggest the price (not the market) is what's stuck; bring a comps-based counter.
- Current owner paid $80k; list at $195k implies a 142% gain — meaningful room to come down on a strong offer.
Risks & watch-outs
- Watch-outs: built in 1900 — expect roof / HVAC / electrical / plumbing capex.
- Climate carrying-cost: major wind risk, 27% chance of damaging wind over 30y; extreme-heat days projected 7→15/yr by 2055 (HVAC capex compounding) — expect insurance premiums to compound above CPI over the hold.
Questions for the listing agent
- Built in 1900 — when were the roof, HVAC, electrical panel, plumbing, and water heater last replaced?
- What does the HOA fee cover, when was the last increase, and are there any pending special assessments or reserve-fund shortfalls?
- Any open or pending special assessments — roof, HVAC, plumbing, elevator, façade? What's the per-unit balance and payoff schedule, and is the seller paying it off at close or rolling it to the buyer?
- Is there a deadline driving the sale (1031 exchange, divorce, estate, relocation)? That informs how much negotiation room exists.
- Schools are B-rated — typically a magnet for longer-tenancy family renters. What's the average tenant stay here, and is there a school-zone premium baked into asking?
- Crime grade is F in this area — have there been break-ins, vandalism, or insurance claims at this property in the last 3 years? What carrier currently insures it and at what premium?
- The area grade is low — what's the realistic commute time and amenity access for the typical tenant pool here? Any planned neighborhood developments (good or bad) we should know about?
- What's the average days-on-market for RENTAL listings here right now (not sales)? A rising rental-DOM trend means longer vacancies and softer asking-rent achievability than the comps imply.
- What's the recent tenant-quality profile in this submarket — average credit score on applications, eviction rate, late-payment / NSF rate, and stable-employment percentage? A property-management company in the area should have these aggregated.
- How much new apartment / multifamily construction is in the pipeline within 1–3 miles? Heavy new supply (>2% of stock underway) typically softens rents 12–24 months out; light construction supports rent growth.
Investment metrics
- 1% rule
- 1.16% ✓
- Cap rate
- 6.71%
- Cash-on-cash
- 1.49%
- DSCR
- 1.07
- GRM
- 7.2
CMA / ARV
No comps found within radius.
Projected returns pro-forma
-3.0% appreciation · 1.61% rent growth · sell at horizon
- IRR
- -15.8%
- Equity multiple
- 0.45×
- Total profit
- $-30,131
- Equity at exit
- $29,075
- IRR
- -10.4%
- Equity multiple
- 0.41×
- Total profit
- $-32,060
- Equity at exit
- $16,860
Cash invested: $54,600 (down + closing). Projections, not guarantees.
Landlord ↔ Tenant lean methodology
- Overall (CITY)
- 6 Strongly Tenant-Friendly
- State New Jersey
- 21 Tenant-Leaning · D+6
- County
- — inherits STATE
- City Jersey City
- 6 Strongly Tenant-Friendly · D+34
ZIP-level market 07305
- Rents YoY
- 1.6%
- Active inventory
- 248
- Price-to-rent
- 7.2×
Monthly cashflow live
- Estimated rent
- $2,264 high interval (Pro) →
- Mortgage (P&I)
- −$1,023
- Tax from tax record
- −$288 /mo · $3,456/yr
- Insurance
- −$81
- HOA est. from 3 same-building comps
- −$329
- Vacancy / Maint / Mgmt
- −$475
- Net cashflow
- $68
Break-even live
UW: 25.0% down · 7.5% · 30yr · 1.5% tax · 5.0% vac · 8.0% maint · 8.0% mgmt
Financing live
Cash to close
- Down payment
- $48,750
- Closing costs
- $5,850
- Reserves months
- —
- Total cash needed
- —
Loan-product check · same deal, 3 products live
Conventional
25% down · 7.5% · 30yr
- Down + closing
- —
- Monthly P&I
- —
- Monthly cashflow
- —
- DSCR
- —
- Eligible?
- —
Personal DTI + credit; lowest rate.
DSCR
20% down · 8.5% · 30yr
- Down + closing
- —
- Monthly P&I
- —
- Monthly cashflow
- —
- DSCR
- —
- Eligible?
- —
No personal income docs; deal must DSCR.
Hard money
10% down · 12.0% · 12mo
- Down + closing
- —
- Monthly P&I
- —
- Monthly cashflow
- —
- DSCR
- —
- Eligible?
- —
Short-term bridge; refi at stabilization.
Rent comps 40 comps
| Address | Beds | Baths | Sqft | Rent | $/sqft | DOM | Units | Dist |
|---|---|---|---|---|---|---|---|---|
| 42 Greenville Ave Unit 2 Jersey City, NJ | 3.0 | 1.0 | 1100 | $2,500 | $2.27 | 22d | 1 | 0.11mi |
| 144 Old Bergen Rd Unit B4 Jersey City, NJ | 1.0 | 1.0 | 629 | $1,600 | $2.54 | 24d | 1 | 0.13mi |
| 29 Bartholdi Ave Jersey City, NJ | 3.0 | 1.0 | 1000 | $2,500 | $2.50 | 24d | 1 | 0.14mi |
| 195 Winfield Ave Unit 1 Jersey City, NJ | 3.0 | 1.0 | 950 | $2,100 | $2.21 | 24d | 1 | 0.16mi |
| 196 Danforth Ave Jersey City, NJ | 3.0 | 1.0 | 850 | $2,299 | $2.70 | 24d | 1 | 0.18mi |
| 98 Old Bergen Rd Jersey City, NJ | 2.0 | 1.0 | 800 | $2,000 | $2.50 | 24d | 1 | 0.25mi |
| 215 Seaview Ave Jersey City, NJ | 3.0 | 1.0 | 1100 | $2,400 | $2.18 | 7d | 1 | 0.26mi |
| 93 Ocean Ave Unit 2 Jersey City, NJ | 3.0 | 1.0 | 900 | $2,100 | $2.33 | 24d | 1 | 0.28mi |
| 283 Winfield Ave Unit 1 Jersey City, NJ | 2.0 | 1.0 | 800 | $1,950 | $2.44 | 24d | 1 | 0.30mi |
| 40 Lembeck Ave Unit 202 Jersey City, NJ | 2.0 | 1.0 | 750 | $2,400 | $3.20 | 7d | 1 | 0.32mi |
| 40 Lembeck Ave Jersey City, NJ | 2.0 | 1.0 | 800 | $2,400 | $3.00 | 20d | 1 | 0.32mi |
| 40 Lembeck Ave Jersey City, NJ | 3.0 | 2.0 | 1000 | $2,900 | $2.90 | 22d | 1 | 0.32mi |
| 1542 John F. Kennedy Blvd Unit 514 Jersey City, NJ | 2.0 | 1.0 | 986 | $2,250 | $2.28 | 22d | 1 | 0.32mi |
| 224 Garfield Ave Unit 3D Jersey City, NJ | 3.0 | 2.0 | 1031 | $2,775 | $2.69 | 24d | 1 | 0.33mi |
| 158 Greenville Ave Unit 1A Jersey City, NJ | 2.0 | 1.0 | 700 | $2,000 | $2.86 | 24d | 1 | 0.39mi |
| 63 Wade St Jersey City, NJ | 3.0 | 1.0 | 1000 | $2,600 | $2.60 | 24d | 1 | 0.42mi |
| 341 Lembeck Ave Unit 2 Jersey City, NJ | 2.0 | 1.0 | 800 | $1,850 | $2.31 | 4d | 1 | 0.43mi |
| 300 Cator Ave Unit 2 Jersey City, NJ | 2.0 | 1.0 | 1100 | $2,200 | $2.00 | 24d | 1 | 0.43mi |
| 80 McAdoo Ave Jersey City, NJ | 1.0 | 1.0 | 1000 | $1,750 | $1.75 | 22d | 1 | 0.45mi |
| 50 Gates Ave Jersey City, NJ | 3.0 | 1.0 | 1000 | $2,400 | $2.40 | 24d | 1 | 0.46mi |
| 53 Terhune Ave Unit 3 Jersey City, NJ | 2.0 | 1.0 | 1000 | $1,895 | $1.90 | 24d | 1 | 0.47mi |
| 9 Exeter Rd Unit 1 Jersey City, NJ | 2.0 | 1.0 | 881 | $2,200 | $2.50 | 17d | 1 | 0.47mi |
| 339 Danforth Ave Unit 1F Jersey City, NJ | 1.0 | 1.0 | 600 | $1,900 | $3.17 | 24d | 1 | 0.48mi |
| 101 Stevens Ave Unit 1 Jersey City, NJ | 3.0 | 1.0 | 900 | $2,300 | $2.56 | 12d | 1 | 0.48mi |
| 115 McAdoo Ave #1 Jersey City, NJ | 3.0 | 1.5 | 1000 | $2,500 | $2.50 | 17d | 1 | 0.50mi |
| 115 McAdoo Ave Unit 2 Jersey City, NJ | 3.0 | 1.5 | 1000 | $2,500 | $2.50 | 24d | 1 | 0.50mi |
| 15 Suburbia Dr Unit 2 Jersey City, NJ | 3.0 | 1.0 | 950 | $2,400 | $2.53 | 14d | 1 | 0.51mi |
| 144 Stevens Ave Unit TOP FL Jersey City, NJ | 3.0 | 1.0 | 1000 | $2,250 | $2.25 | 4d | 1 | 0.53mi |
| 181 Princeton Ave Jersey City, NJ | 3.0 | 1.0 | 1000 | $1,995 | $2.00 | 24d | 1 | 0.53mi |
| 36 Crossgate Rd Unit 1 Jersey City, NJ | 2.0 | 1.0 | 550 | $2,200 | $4.00 | 24d | 1 | 0.54mi |
| 30 Briarwood Rd Unit 2 Jersey City, NJ | 2.0 | 1.0 | 950 | $2,000 | $2.11 | 24d | 1 | 0.54mi |
| 377 Danforth Ave Unit 4 Jersey City, NJ | 1.0 | 1.0 | 525 | $1,820 | $3.47 | 7d | 1 | 0.57mi |
| 207 Armstrong Ave Jersey City, NJ | 3.0 | 1.0 | 1000 | $2,550 | $2.55 | 22d | 1 | 0.59mi |
| 374 Cator Ave #2 Jersey City, NJ | 2.0 | 1.0 | 950 | $2,300 | $2.42 | 11d | 1 | 0.60mi |
| 16 Bergen Ave Apt 4 Jersey City, NJ | 2.0 | 1.0 | 900 | $1,975 | $2.19 | 24d | 1 | 0.61mi |
| 16 Bergen Ave Unit 11 Jersey City, NJ | 2.0 | 1.0 | 900 | $1,900 | $2.11 | 24d | 1 | 0.61mi |
| 239 Fulton Ave Unit 1 Jersey City, NJ | 2.0 | 1.0 | 850 | $2,250 | $2.65 | 24d | 1 | 0.70mi |
| 5 Van Houten Ave Unit 33 Jersey City, NJ | 1.0 | 1.0 | 700 | $1,895 | $2.71 | 24d | 1 | 0.82mi |
| 499 Ocean Ave Unit 2 Jersey City, NJ | 3.0 | 2.0 | 1000 | $2,350 | $2.35 | 20d | 1 | 0.86mi |
| 499 Ocean Ave Unit 1 Jersey City, NJ | 3.0 | 2.0 | 1000 | $2,400 | $2.40 | 20d | 1 | 0.86mi |
HOA detail condo
- Monthly dues
- $0 · $0/yr
- Assessments
- None detected in remarks — confirm with the listing agent.
Listing history 18 events
-
2026-06-18days on market $195,000 Active 24 DOM
-
2026-06-17days on market $195,000 Active 23 DOM
-
2026-06-16days on market $195,000 Active 22 DOM
-
2026-06-15days on market $195,000 Active 21 DOM
-
2026-06-13days on market $195,000 Active 19 DOM
-
2026-06-13days on market $195,000 Active 18 DOM
-
2026-06-09days on market $195,000 Active 15 DOM
-
2026-06-08days on market $195,000 Active 14 DOM
-
2026-06-07days on market $195,000 Active 13 DOM
-
2026-06-04days on market $195,000 Active 10 DOM
-
2026-06-03days on market $195,000 Active 9 DOM
-
2026-06-02days on market $195,000 Active 8 DOM
-
2026-06-01days on market $195,000 Active 7 DOM
-
2026-05-31days on market $195,000 Active 6 DOM
-
2026-05-25$195,000 Active
-
2024-12-05historical
-
2024-06-27$295,000 Active
-
2004-03-25soldstatus $80,500
ⓘ Source: listings_history table (triggers on properties + properties_extension) + one-shot
backfill from property_details.listing_events for pre-trigger history.
Tax reassessment forecast NJ · Partial reset (capped growth)
- Current annual tax
- $3,456 · $288/mo
- Projected year-2 tax
- $4,156 · $346/mo
- Expected delta
- +$700/yr (+$58/mo · 20.3%)
ⓘ Screening estimate from a state-policy table — verify with the county assessor before closing.
Climate risk First Street
- Flood 1/10 Low FEMA zone X (unshaded) · 0% chance over 30 yrs
- Wildfire 1/10 Low
- Heat 7/10 Severe 7 d/yr ≥98°F today · 15 d/yr by 30 yrs out
- Wind 6/10 Major 27% chance of damaging wind over 30 yrs
- Air quality 4/10 Moderate 5 unhealthy d/yr today · 6 by 30 yrs out
Nearby sold comps map
Loading sold comps map…
Walkable amenities ~0.75 mi
Loading nearby amenities…
Taxation est. · year 1
- Rental income
- $27,171
- − Mortgage interest
- −$10,923
- − Property taxes
- −$3,456
- − Insurance
- −$975
- − Repairs & maintenance
- −$2,174
- − Management
- −$2,174
- − HOA
- −$3,948
- − Depreciation
- −$5,673
- Taxable loss
- −$2,151
- Est. tax savings @ 24.0%
- +$516
- After-tax cash flow
- $1,331/yr
For passive investors: Depreciation is non-cash, so a rental often shows a tax loss while cash-flowing — sheltering income. Rental losses are passive: they offset passive income freely, and up to $25,000/yr can offset ordinary (W-2) income if you actively participate and your MAGI is under $100k (phasing out to $0 by $150k); unused losses carry forward. On sale, claimed depreciation is recaptured at up to 25%, and gains may owe capital-gains tax (a 1031 exchange can defer both). Figures are a year-1 estimate at your 24.0% rate — not tax advice; consult a CPA.
Schools (NCES district)
- District
- Jersey City Public Schools
- NCES district ID
- 3407830
- Math proficiency
- 16% ▼ -17.00%
- Reading proficiency
- 38% ▼ -11.00%
- Median HH income
- $58,431
- Composite
- 24.43/100
- National rank
- #7678
- State rank
- #369 of 472 in NJ
Livability — Jersey City
- Score
- 77/100
- State rank
- #116
- US rank
- #2955
Category grades
Schools grade is shown separately in the Schools card above.
Census & demographics
- Census place
- Jersey City, NJ
- County
- Hudson County · 718,323 people
- City population
- 294,078
- Metro
- New York-Newark-Jersey City, NY-NJ-PA
- Population (ZIP)
- 72,161
- Household income
- $76,527
- Rent vs Own
- Severe rent burden
- 4975.0
Population outlook (Hudson County) Hauer SSP2
- Today (2025)
- 771,834 people
- By 2030
- 818,028 · +6.0%
- By 2040
- 907,866 · +17.6%
- By 2050
- 994,480 · +28.8%
- By 2075
- 1,163,301 · +50.7%
- By 2100
- 1,254,703 · +62.6%
Race, ethnicity, and origin ACS 2023
- Neighborhood character
- Highly diverse neighborhood (Simpson 0.73)
- Race & ethnicity
- Black 40% Hispanic / Latino 27% Asian 15% Two or more races 13% White 12%
- Hispanic origin (detail)
- Puerto Rican 11% Dominican 9%
- Common ancestry
- Swedish 1% Hispanic 1% Romanian 1%
- Foreign-born
- 33% · Canada, China, Jamaica
- Languages at home
- 58% English-only · Spanish 21% Tagalog/Filipino 7% Arabic 3%
Political lean MEDSL · Hudson
- 2024 margin
- Strong D (+28.1) · D 62.6% · R 34.6% · Other 2.8%
- 2008→2024 swing
- -18.7pp toward R · 2008: 46.7pp · 2024: 28.1pp
- All cycles
- 2024: D+28.1 2020: D+46.2 2016: D+51.8 2012: D+55.7 2008: D+46.7
Not yet ingested
- Civics
- —
Market trends
- HPI YoY
- ▼ -181.89%
- Current HPI
- 299.991
- Rent YoY
- ▲ 1.61%
- Metro
- New York-Newark-Jersey City, NY-NJ-PA
- State GDP YoY
- ▲ 2.05%
- F500 in state
- 34
Industry mix (Fortune 500 HQ in NJ)
| Industry | F500 HQs | Revenue |
|---|---|---|
| Consumer Goods | 3 | $31B |
|
||
| Pharmaceuticals | 2 | $153B |
|
||
| Technology | 2 | $21B |
|
||
| Insurance | 2 | $20B |
|
||
| Healthcare | 2 | $19B |
|
||
| Financial Services | 1 | $70B |
|
||
Price history
+142.2% since first listed4 events — show timeline
- 2026-05-25 Listed $195,000 HCMLS
- 2024-12-05 Listing Removed — HCMLS
- 2024-06-27 Listed $295,000 HCMLS
- 2004-03-25 Sold (Public Records) $80,500 Public Records
Property tax history
+3.1%/yrLatest (2025): $3,456 · +4.6% YoY. Source: county tax records.
Cash-flow waterfall
monthlySold comps — $/sqft
last 12 mo · ≤1 miLoading sold comps…