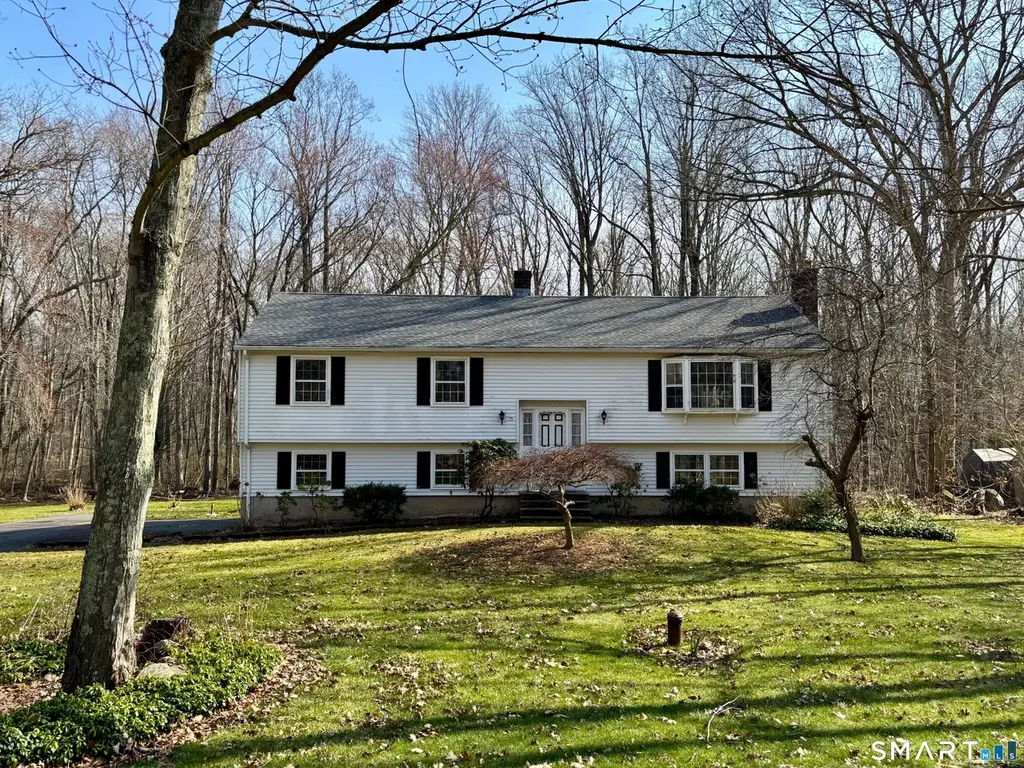
15 Stepping Stone Ln · Guilford Center, CT
Flood risk 1/10 · Minimal
- FEMA flood zone
- X (unshaded)
- Chance of flooding over 30 yrs
- 0.0%
- Est. flood insurance / yr
- $507 – $1,088
Fire risk 3/10 · Minor
- Est. fire insurance / yr
- $829 – $1,539
Heat risk 5/10 · Moderate
- Hot days now (above 93°F)
- 7 days/yr
- Hot days in 30 yrs
- 17 days/yr
Wind risk 6/10 · Moderate
- Chance of severe wind over 30 yrs
- 67.0%
Air-quality risk 5/10 · Moderate
- Unhealthy air days now
- 5 days/yr
- Unhealthy air days in 30 yrs
- 8 days/yr
Risk factors via First Street. Map © Google.
Why this score? — see what drove the D+ grade
The composite is a weighted blend of 9 inputs, each scored 0–100. Each bar is that input's sub-score; the figure is the points it added to the 100-point composite (weight × sub-score).
- ARV discount +13.1/15.0
- Cash flow +10.9/30.0
- Schools +6.6/10.0
- Livability +4.1/5.0
- DSCR +3.2/10.0
- 1% rule +3.1/10.0
- Rent growth +2.5/5.0
- Condition / age +2.5/5.0
- Appreciation +0.0/10.0
$459,500
🖨 Deal sheet 📄 Offer letter ✓ Due diligence
Listing remarks
PLS SUBMIT HIGHEST & BEST OFFER BY NOON 4/7/26. Situated in a quiet, desirable neighborhood, this inviting 4-bedroom raised ranch sits on over 1.25 acres with a lovely, spacious and level backyard-ideal for outdoor living and entertaining. The main level features an open layout with an eat-in kitchen, dining area, and living room, along with four bedrooms and a full hall bath, all on one level. A large deck conveniently located off the dining room and kitchen overlooks the private yard. The walkout lower level offers a comfortable family room with a cozy fireplace, sliders to the backyard, and a convenient half bath with laundry. Recent updates include a new roof (2020) and water heat
Key facts
- 1.25 acre lot
- 2 garage spots
- Built 1974
Property features AI
Finance
- Other: Living area recorded as 1,346 (public record)
Exterior
- Parking: Under-house garage; Two-car garage
- Utilities: Private well water; Septic sewage
- Home design: Single-family home
- Construction: Built with frame construction; Vinyl siding; Concrete foundation; Asphalt shingle roof
- Exterior features: Deck; Level lot; Water access
Interior
- Kitchen: Oven/Range; Refrigerator; Dishwasher
- Bedrooms: Four bedrooms
- Bathrooms: One full bathroom; One half bathroom
- Heating & cooling: Hot water heat; Oil-fired heat (oil tank located in garage)
- Interior features: Six total rooms; One fireplace; Full basement that is partially finished with a hatchway; Attic with pull-down stairs
- Laundry & utility: Washer and dryer; Laundry located on the lower level
Neighborhood map
What this means for you Summary
Snapshot
- This is a 4-bed/1.5-bath single-family listed at $460k.
Deal economics
- At list price, monthly cash flow is $-202 ($-2k/yr) — negative.
- To cash-flow at today's rent, offer at most $424k (7.8% below list).
- To meet the 1% rule (rent ≥ 1% of price), the offer needs to be $372k (19.0% below list).
- Recommended offer: $372k (19.0% below list) — sets the bar for 1% rule.
- Cap rate 5.8% vs local median 3.1% in Guilford Center — top-decile yield for the area; either an underpriced asset or a hidden risk that comps aren't pricing in. Stress-test before assuming the spread holds.
Location & tenants
- Location reads 82/100 on livability (#10 in CT, #1,186 nationally) — a professional / high-income tenant draw. Strengths: crime A+, employment A+, health & safety A+; Watch: cost of living F.
- Madison School District (suburban): math 69% / reading 75% proficiency, ranked #10 of 153 in CT (top 6%) — strong family-tenant draw, lease renewals of 3-5y typical; only 3% free/reduced lunch — higher-income household profile.
- Zoned schools: Daniel Hand High School (math 69% / reading 86%, grade A-, #8 of 194 statewide, top 4%, 828 students, 5% FRL) — zoned schools at 5% FRL track the district average.
- Market conditions: 105 active listings in the ZIP; 1,059 units permitted in South Central Connecticut Planning Region in 2024 (779 in 5+ unit buildings).
Forward outlook
- Local home prices are declining (-3.0%/yr); year-one equity from $3k of loan paydown is wiped out by about $14k of value loss. Plan a longer hold.
Negotiation context
- It's been on market 51 days — a 3% lower offer ($446k) is reasonable based on typical stale-listing flexibility.
Risks & watch-outs
- Climate carrying-cost: major wind risk, 67% chance of damaging wind over 30y; extreme-heat days projected 7→17/yr by 2055 (HVAC capex compounding) — expect insurance premiums to compound above CPI over the hold.
Questions for the listing agent
- What do current leases actually rent for vs. the listed asking? Can we see a recent rent roll and the last 12 months of T-12 income?
- It's been on market 51 days. Have you received any prior offers? Is the seller open to a 19% concession, seller financing, or rate buy-down credit?
- Built in 1974 — when were the roof, HVAC, electrical panel, plumbing, and water heater last replaced?
- Is there a deadline driving the sale (1031 exchange, divorce, estate, relocation)? That informs how much negotiation room exists.
- Schools are A-rated — typically a magnet for longer-tenancy family renters. What's the average tenant stay here, and is there a school-zone premium baked into asking?
- The area grade is low — what's the realistic commute time and amenity access for the typical tenant pool here? Any planned neighborhood developments (good or bad) we should know about?
- What's the average days-on-market for RENTAL listings here right now (not sales)? A rising rental-DOM trend means longer vacancies and softer asking-rent achievability than the comps imply.
- What's the recent tenant-quality profile in this submarket — average credit score on applications, eviction rate, late-payment / NSF rate, and stable-employment percentage? A property-management company in the area should have these aggregated.
- How much new for-sale + rental construction is in the pipeline within 1–3 miles? Heavy new supply typically softens prices + rents 12–24 months out; constrained supply supports both.
Investment metrics
- 1% rule
- 0.81% ✗
- Cap rate
- 5.77%
- Cash-on-cash
- -1.88%
- DSCR
- 0.92
- GRM
- 10.3
CMA / ARV
- ARV (on-the-fly)
- $524,940
- Comps found
- 3
Show comp detail 3 sales within ~0.75 mi
| Address | Dist | Beds/Ba | Sqft | Sold | Price | $/sf | Match |
|---|---|---|---|---|---|---|---|
| 15 Stepping Stone Ln | 0.00mi | 4/1.5 | 1,346 (0%) | 1mo | $525,000 | $390 | 99 |
| 24 Deepwood Dr | 0.56mi | 3/1.5 (-1) | 1,200 (-11%) | 10mo | $475,000 | $396 | 43 |
| 436 Opening Hill Rd | 0.46mi | 3/1.5 (-1) | 1,144 (-15%) | 15mo | $348,000 | $304 | 36 |
Match score weights: distance 35% · size 25% · config 20% · recency 20%. Top-matched comps best support the ARV.
Projected returns pro-forma
-3.0% appreciation · 3.0% rent growth · sell at horizon
- IRR
- -19.4%
- Equity multiple
- 0.32×
- Total profit
- $-87,279
- Equity at exit
- $68,513
- IRR
- -12.1%
- Equity multiple
- 0.28×
- Total profit
- $-92,412
- Equity at exit
- $39,729
Cash invested: $128,660 (down + closing). Projections, not guarantees.
Landlord ↔ Tenant lean methodology
- Overall (STATE)
- 27 Tenant-Leaning
- State Connecticut
- 27 Tenant-Leaning · D+7
- County
- — inherits STATE
- City
- — inherits STATE
ZIP-level market 06443
- Active inventory
- 105
- Price-to-rent
- 10.3×
Monthly cashflow live
- Estimated rent
- $3,720 medium interval (Pro) →
- Mortgage (P&I)
- −$2,410
- Tax from tax record
- −$540 /mo · $6,477/yr
- Insurance
- −$191
- HOA
- −$0
- Vacancy / Maint / Mgmt
- −$781
- Net cashflow
- $-202
Break-even live
UW: 25.0% down · 7.5% · 30yr · 1.5% tax · 5.0% vac · 8.0% maint · 8.0% mgmt
Financing live
Cash to close
- Down payment
- $114,875
- Closing costs
- $13,785
- Reserves months
- —
- Total cash needed
- —
Loan-product check · same deal, 3 products live
Conventional
25% down · 7.5% · 30yr
- Down + closing
- —
- Monthly P&I
- —
- Monthly cashflow
- —
- DSCR
- —
- Eligible?
- —
Personal DTI + credit; lowest rate.
DSCR
20% down · 8.5% · 30yr
- Down + closing
- —
- Monthly P&I
- —
- Monthly cashflow
- —
- DSCR
- —
- Eligible?
- —
No personal income docs; deal must DSCR.
Hard money
10% down · 12.0% · 12mo
- Down + closing
- —
- Monthly P&I
- —
- Monthly cashflow
- —
- DSCR
- —
- Eligible?
- —
Short-term bridge; refi at stabilization.
Listing history 4 events
-
2026-05-23status Under Contract
-
2026-04-07historical Under Contract - Continue to Show
-
2026-04-03$459,500 Active
-
2026-03-31historical $459,500
ⓘ Source: listings_history table (triggers on properties + properties_extension) + one-shot
backfill from property_details.listing_events for pre-trigger history.
Tax reassessment forecast CT · Partial reset (capped growth)
- Current annual tax
- $6,477 · $540/mo
- Projected year-2 tax
- $8,155 · $680/mo
- Expected delta
- +$1,678/yr (+$140/mo · 25.9%)
ⓘ Screening estimate from a state-policy table — verify with the county assessor before closing.
Climate risk First Street
- Flood 1/10 Low FEMA zone X (unshaded) · 0% chance over 30 yrs
- Wildfire 3/10 Moderate
- Heat 5/10 Major 7 d/yr ≥93°F today · 17 d/yr by 30 yrs out
- Wind 6/10 Major 67% chance of damaging wind over 30 yrs
- Air quality 5/10 Major 5 unhealthy d/yr today · 8 by 30 yrs out
Nearby sold comps map
Loading sold comps map…
Walkable amenities ~0.75 mi
Loading nearby amenities…
Taxation est. · year 1
- Rental income
- $44,644
- − Mortgage interest
- −$25,739
- − Property taxes
- −$6,477
- − Insurance
- −$2,298
- − Repairs & maintenance
- −$3,571
- − Management
- −$3,571
- − Depreciation
- −$13,367
- Taxable loss
- −$10,380
- Est. tax savings @ 24.0%
- +$2,491
- After-tax cash flow
- $69/yr
For passive investors: Depreciation is non-cash, so a rental often shows a tax loss while cash-flowing — sheltering income. Rental losses are passive: they offset passive income freely, and up to $25,000/yr can offset ordinary (W-2) income if you actively participate and your MAGI is under $100k (phasing out to $0 by $150k); unused losses carry forward. On sale, claimed depreciation is recaptured at up to 25%, and gains may owe capital-gains tax (a 1031 exchange can defer both). Figures are a year-1 estimate at your 24.0% rate — not tax advice; consult a CPA.
Schools (NCES district)
- District
- Madison School District
- NCES district ID
- 0902280
- Math proficiency
- 69% ▲ 1.00%
- Reading proficiency
- 75% ▲ 2.00%
- Median HH income
- $103,788
- Composite
- 66.15/100
- National rank
- #435
- State rank
- #10 of 153 in CT
Livability — Guilford Center
- Score
- 82/100
- State rank
- #10
- US rank
- #1186
Category grades
Schools grade is shown separately in the Schools card above.
Census & demographics
- Population (ZIP)
- 17,577
Population outlook (South Central Connecticut County) Hauer SSP2
- By 2040
- 608,362
Race, ethnicity, and origin ACS 2023
- Neighborhood character
- Predominantly White (88%)
- Race & ethnicity
- White 88% Two or more races 5% Asian 4% Hispanic / Latino 3%
- Common ancestry
- Romanian 5% Lithuanian 3% Slovak 2%
- Foreign-born
- 9% · Canada, China
- Languages at home
- 92% English-only · Other Indo-European 2% Spanish 2% German/W. Germanic 1%
Political lean MEDSL · South Central Connecticut
- 2024 margin
- Strong D (+20.1) · D 59.0% · R 38.9% · Other 2.1%
- All cycles
- 2024: D+20.1
Not yet ingested
- Civics
- —
Market trends
- HPI YoY
- ▼ -375.58%
- Current HPI
- 242.8467
- Rent YoY
- —
- Metro
- —
- State GDP YoY
- ▲ 1.06%
- F500 in state
- 38
Industry mix (Fortune 500 HQ in CT)
| Industry | F500 HQs | Revenue |
|---|---|---|
| Industrial Machinery | 4 | $38B |
|
||
| Insurance | 3 | $71B |
|
||
| Financial Services | 2 | $25B |
|
||
| Transportation / Logistics | 2 | $18B |
|
||
| Healthcare | 1 | $247B |
|
||
| Telecommunications | 1 | $55B |
|
||
Price history
+0.0% since first listed4 events — show timeline
- 2026-05-23 Pending — Smart MLS
- 2026-04-07 Contingent — Smart MLS
- 2026-04-03 Listed $459,500 Smart MLS
- 2026-03-31 Coming Soon $459,500 Smart MLS
Property tax history
+2.0%/yrLatest (2023): $6,477 · +1.9% YoY. Source: county tax records.
Cash-flow waterfall
monthlySold comps — $/sqft
last 12 mo · ≤1 miLoading sold comps…