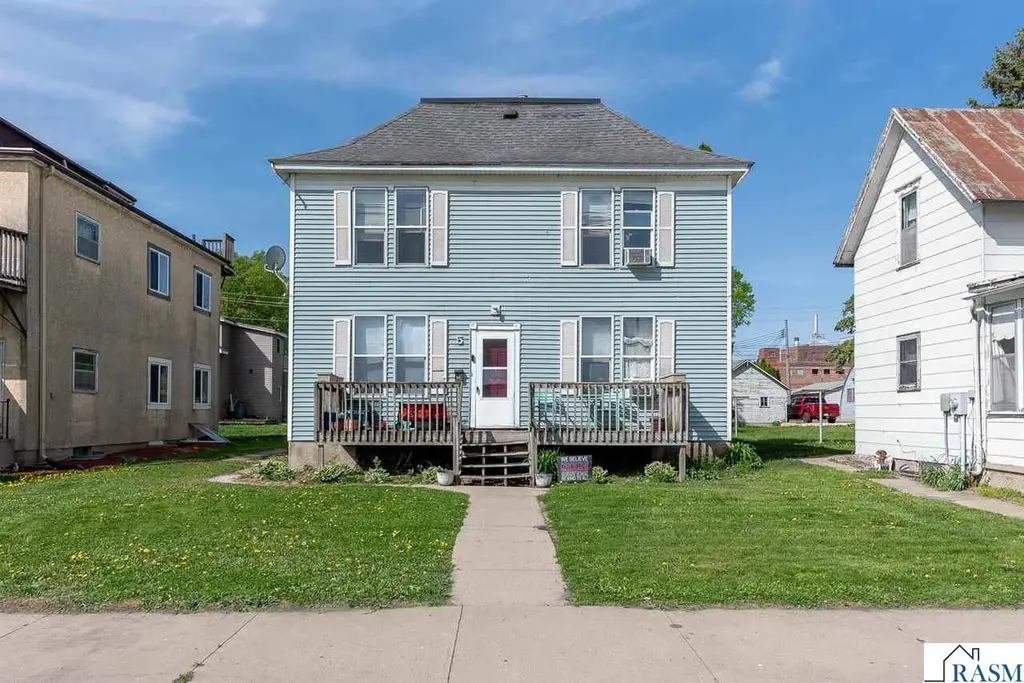
5 N Front St · New Ulm, MN
Flood risk 1/10 · Minimal
- FEMA flood zone
- X (unshaded)
- Chance of flooding over 30 yrs
- 0.0%
- Est. flood insurance / yr
- $473 – $860
Fire risk 5/10 · Moderate
- Est. fire insurance / yr
- $888 – $1,650
Heat risk 2/10 · Minimal
- Hot days now (above 100°F)
- 7 days/yr
- Hot days in 30 yrs
- 15 days/yr
Wind risk 2/10 · Minimal
- Chance of severe wind over 30 yrs
- —
Air-quality risk 1/10 · Minimal
- Unhealthy air days now
- 0 days/yr
- Unhealthy air days in 30 yrs
- 0 days/yr
Risk factors via First Street. Map © Google.
Why this score? — see what drove the B+ grade
The composite is a weighted blend of 9 inputs, each scored 0–100. Each bar is that input's sub-score; the figure is the points it added to the 100-point composite (weight × sub-score).
- Cash flow +30.0/30.0
- ARV discount +15.0/15.0
- 1% rule +10.0/10.0
- DSCR +10.0/10.0
- Schools +4.4/10.0
- Livability +4.1/5.0
- Rent growth +2.5/5.0
- Condition / age +2.5/5.0
- Appreciation +0.0/10.0
$74,900
🖨 Deal sheet (PDF) 📄 Offer letter ✓ Due diligence
Listing remarks
Historic duplex with unlimited potential in New Ulm! This 1903 duplex is the perfect project for a fixed asset win. Situated on a full city lot, you are less than a block away from Riverside Park on the Minnesota River and 3 blocks away from all the charm of downtown New Ulm. There are 2 bedrooms and one bathroom in both the upper and lower units. Gas and electric are split between units and water and sewer are shared. Put in your best offer, roll up your sleeves, and make this your next revenue stream.
Key facts
- 8,276 sq ft lot
- Built 1920
- Listed 26 days
Property features AI
Exterior
- Utilities: Public water; Public sewer
- Home design: Residential income property (multi-family)
- Construction: Vinyl siding construction
- Exterior features: Asphalt and rubber roofing; Vinyl siding; Publicly maintained road access
Interior
- Kitchen: Refrigerator
- Bathrooms: 2 full bathrooms
- Heating & cooling: Electric and natural gas forced air heating; Window air conditioning units
- Interior features: Refrigerator included; Full unfinished basement with sump pump
Neighborhood map
What this means for you Summary
Snapshot
- This is a 4-bed/2.0-bath single-family listed at $75k.
Deal economics
- At list price, monthly cash flow is $844 ($10k/yr) — positive.
- The deal already cash-flows at list — no discount required.
- Meets the 1% rule at list price ($2k rent vs $75k).
- Recommended offer: $74k (1.5% below list) — sets the bar for market timing.
- Cap rate 19.8% vs local median 4.2% in New Ulm — top-decile yield for the area; either an underpriced asset or a hidden risk that comps aren't pricing in. Stress-test before assuming the spread holds.
Location & tenants
- Location reads 82/100 on livability (#39 in MN, #1,102 nationally) — a professional / high-income tenant draw. Strengths: crime A+, cost of living A+, housing A+; Watch: commute F.
- New Ulm Public School District (town): math 51% / reading 51% proficiency, ranked #104 of 301 in MN (top 35%) — acceptable for families but not a draw, mixed tenant base, ~2y average lease.
- Market conditions: 85 active listings in the ZIP; 1 comparable units currently listed for rent nearby; 41 units permitted in Brown County in 2024 (18 in 5+ unit buildings).
Forward outlook
- Local home prices are declining (-3.0%/yr); year-one equity from $518 of loan paydown is wiped out by about $2k of value loss. Plan a longer hold.
- Brown County population projected at -14% by 2050 — secular population decline; favor cash flow + early exit over multi-decade hold.
- At projected returns (-3.0% appreciation + 3.0% rent growth), your $21k cash investment doubles in ~3 years — after that, you're playing with house money.
Negotiation context
- It's been on market 26 days — a 2% lower offer ($74k) is reasonable based on typical stale-listing flexibility.
- 3 sale attempts since 21y ago with the ask held roughly flat each time — persistent listings suggest the price (not the market) is what's stuck; bring a comps-based counter.
Risks & watch-outs
- Watch-outs: built in 1920 — expect roof / HVAC / electrical / plumbing capex.
- Climate carrying-cost: moderate wildfire risk — expect insurance premiums to compound above CPI over the hold.
Questions for the listing agent
- Built in 1920 — when were the roof, HVAC, electrical panel, plumbing, and water heater last replaced?
- Is there a deadline driving the sale (1031 exchange, divorce, estate, relocation)? That informs how much negotiation room exists.
- Schools are B-rated — typically a magnet for longer-tenancy family renters. What's the average tenant stay here, and is there a school-zone premium baked into asking?
- What's the average days-on-market for RENTAL listings here right now (not sales)? A rising rental-DOM trend means longer vacancies and softer asking-rent achievability than the comps imply.
- What's the recent tenant-quality profile in this submarket — average credit score on applications, eviction rate, late-payment / NSF rate, and stable-employment percentage? A property-management company in the area should have these aggregated.
- How much new for-sale + rental construction is in the pipeline within 1–3 miles? Heavy new supply typically softens prices + rents 12–24 months out; constrained supply supports both.
Investment metrics
- 1% rule
- 2.40% ✓
- Cap rate
- 19.82%
- Cash-on-cash
- 48.29%
- DSCR
- 3.15
- GRM
- 3.5
CMA / ARV
- ARV (median comp)
- $121,941
- List price
- $74,900
- Delta
- -38.58%
- Verdict
- UNDERPRICED
- Comps
- 1 within 2.0 mi
Show comp detail 12 sales within ~0.75 mi
| Address | Dist | Beds/Ba | Sqft | Sold | Price | $/sf | Match |
|---|---|---|---|---|---|---|---|
| 10 S Front St | 0.06mi | 3/2.0 (-1) | 1,916 (-0%) | 6mo | $170,000 | $89 | 86 |
| 108 South Broadway St | 0.45mi | 3/2.0 (-1) | 1,921 (+0%) | 5mo | $100,000 | $52 | 70 |
| 418 N Front St | 0.36mi | 3/1.5 (-1) | 1,965 (+2%) | 8mo | $215,000 | $109 | 66 |
| 521 S Valley St | 0.50mi | 4/1.0 | 1,936 (+1%) | 6mo | $214,000 | $111 | 66 |
| 327 N Broadway St | 0.51mi | 4/1.5 | 1,766 (-8%) | 1mo | $175,000 | $99 | 60 |
| 520 N Minnesota St | 0.54mi | 3/2.5 (-1) | 2,023 (+5%) | 4mo | $196,000 | $97 | 56 |
| 409 N German St | 0.41mi | 4/2.0 | 2,120 (+10%) | 10mo | $299,900 | $141 | 55 |
| 403 N Franklin St | 0.74mi | 4/2.5 | 2,105 (+10%) | 2mo | $215,000 | $102 | 46 |
| 421 S Washington St | 0.69mi | 3/2.5 (-1) | 2,027 (+6%) | 12mo | $295,000 | $146 | 42 |
| 122 N Washington St | 0.56mi | 3/2.0 (-1) | 1,694 (-12%) | 12mo | $240,000 | $142 | 39 |
| 618 N State St | 0.69mi | 4/1.5 | 1,676 (-13%) | 7mo | $205,000 | $122 | 38 |
| 507 N Washington St | 0.71mi | 3/1.5 (-1) | 2,144 (+12%) | 10mo | $278,000 | $130 | 32 |
Match score weights: distance 35% · size 25% · config 20% · recency 20%. Top-matched comps best support the ARV.
Projected returns pro-forma
-3.0% appreciation · 3.0% rent growth · sell at horizon
- IRR
- 45.8%
- Equity multiple
- 2.99×
- Total profit
- $41,683
- Equity at exit
- $11,168
- IRR
- 51.7%
- Equity multiple
- 6.04×
- Total profit
- $105,776
- Equity at exit
- $6,476
Cash invested: $20,972 (down + closing). Projections, not guarantees.
Landlord ↔ Tenant lean methodology
- Overall (STATE)
- 46 Balanced
- State Minnesota
- 46 Balanced · D+2
- County
- — inherits STATE
- City
- — inherits STATE
ZIP-level market 56073
- Active inventory
- 85
- Price-to-rent
- 3.5×
Monthly cashflow live
- Estimated rent
- $1,800 medium interval (Pro) →
- Mortgage (P&I)
- −$393
- Tax from tax record
- −$154 /mo · $1,848/yr
- Insurance
- −$31
- HOA
- −$0
- Vacancy / Maint / Mgmt
- −$378
- Net cashflow
- $844
Break-even live
Sensitivity live
| Price | -10% $886 | -5% $865 | +0% $844 | +5% $823 | +10% $802 |
|---|---|---|---|---|---|
| Rent | -10% $702 | -5% $773 | +0% $844 | +5% $915 | +10% $986 |
| Rate | -1.0pp $882 | -0.5pp $863 | base $844 | +0.5pp $825 | +1.0pp $805 |
UW: 25.0% down · 7.5% · 30yr · 1.5% tax · 5.0% vac · 8.0% maint · 8.0% mgmt
Financing live
Cash to close
- Down payment
- $18,725
- Closing costs
- $2,247
- Reserves months
- —
- Total cash needed
- —
Loan-product check · same deal, 3 products live
Conventional
25% down · 7.5% · 30yr
- Down + closing
- —
- Monthly P&I
- —
- Monthly cashflow
- —
- DSCR
- —
- Eligible?
- —
Personal DTI + credit; lowest rate.
DSCR
20% down · 8.5% · 30yr
- Down + closing
- —
- Monthly P&I
- —
- Monthly cashflow
- —
- DSCR
- —
- Eligible?
- —
No personal income docs; deal must DSCR.
Hard money
10% down · 12.0% · 12mo
- Down + closing
- —
- Monthly P&I
- —
- Monthly cashflow
- —
- DSCR
- —
- Eligible?
- —
Short-term bridge; refi at stabilization.
Rent comps 1 comps
| Address | Beds | Baths | Sqft | Rent | $/sqft | DOM | Units | Dist |
|---|---|---|---|---|---|---|---|---|
| 811 Center St New Ulm, MN | 3.0 | 2.0 | 1606 | $1,800 | $1.12 | 44d | 1 | 0.60mi |
Listing history 18 events
-
2026-06-14status $74,900 Pending 26 DOM
-
2026-06-13days on market $74,900 Active Under Contract 26 DOM
-
2026-06-12days on market $74,900 Active Under Contract 25 DOM
-
2026-06-09days on market $74,900 Active Under Contract 22 DOM
-
2026-06-08days on market $74,900 Active Under Contract 21 DOM
-
2026-06-07days on market $74,900 Active Under Contract 20 DOM
-
2026-06-07days on market $74,900 Active Under Contract 19 DOM
-
2026-06-04days on market $74,900 Active Under Contract 16 DOM
-
2026-06-03status $74,900 Active Under Contract 15 DOM
-
2026-06-02days on market $74,900 Active 15 DOM
-
2026-06-01days on market $74,900 Active 14 DOM
-
2026-05-31days on market $74,900 Active 13 DOM
-
2026-05-31days on market $74,900 Active 12 DOM
-
2026-05-06historical $74,900 559-char remark
-
2011-07-05$84,900
-
2005-05-16soldstatus $77,900
-
2005-05-11historical
-
2005-04-07$79,900
ⓘ Source: listings_history table (triggers on properties + properties_extension) + one-shot
backfill from property_details.listing_events for pre-trigger history.
Tax reassessment forecast MN · Partial reset (capped growth)
- Current annual tax
- $1,848 · $154/mo
- Projected year-2 tax
- $1,848 · $154/mo
- Expected delta
- $0/yr ($0/mo · 0.0%)
ⓘ Screening estimate from a state-policy table — verify with the county assessor before closing.
Climate risk First Street
- Flood 1/10 Low FEMA zone X (unshaded) · 0% chance over 30 yrs
- Wildfire 5/10 Major
- Heat 2/10 Low 7 d/yr ≥100°F today · 15 d/yr by 30 yrs out
- Wind 2/10 Low
- Air quality 1/10 Low 0 unhealthy d/yr today · 0 by 30 yrs out
Nearby sold comps map
Loading sold comps map…
Walkable amenities ~0.75 mi
Loading nearby amenities…
Taxation est. · year 1
- Rental income
- $21,600
- − Mortgage interest
- −$4,196
- − Property taxes
- −$1,848
- − Insurance
- −$374
- − Repairs & maintenance
- −$1,728
- − Management
- −$1,728
- − Depreciation
- −$2,179
- Taxable income
- $9,547
- Est. tax owed @ 24.0%
- −$2,291
- After-tax cash flow
- $7,837/yr
For passive investors: Depreciation is non-cash, so a rental often shows a tax loss while cash-flowing — sheltering income. Rental losses are passive: they offset passive income freely, and up to $25,000/yr can offset ordinary (W-2) income if you actively participate and your MAGI is under $100k (phasing out to $0 by $150k); unused losses carry forward. On sale, claimed depreciation is recaptured at up to 25%, and gains may owe capital-gains tax (a 1031 exchange can defer both). Figures are a year-1 estimate at your 24.0% rate — not tax advice; consult a CPA.
Schools (NCES district)
- District
- New Ulm Public School District
- NCES district ID
- 2723490
- Math proficiency
- 51% ▼ -3.00%
- Reading proficiency
- 51% ▼ -7.00%
- Median HH income
- $53,171
- Composite
- 43.93/100
- National rank
- #2906
- State rank
- #104 of 301 in MN
Livability — New Ulm
- Score
- 82/100
- State rank
- #39
- US rank
- #1102
Category grades
Schools grade is shown separately in the Schools card above.
Census & demographics
- Census place
- New Ulm, MN
- City population
- 17,325
- Population (ZIP)
- 17,325
Population outlook (Brown County) Hauer SSP2
- Today (2025)
- 24,403 people
- By 2030
- 23,790 · -2.5%
- By 2040
- 22,309 · -8.6%
- By 2050
- 20,948 · -14.2%
- By 2075
- 19,038 · -22.0%
- By 2100
- 16,658 · -31.7%
Race, ethnicity, and origin ACS 2023
- Neighborhood character
- Predominantly White (94%)
- Race & ethnicity
- White 94% Hispanic / Latino 3% Two or more races 2%
- Common ancestry
- Portuguese 9% Lithuanian 2% Romanian 2%
- Foreign-born
- 2% · Canada, Vietnam
- Languages at home
- 96% English-only · Spanish 2% German/W. Germanic 1%
Political lean MEDSL · Brown
- 2024 margin
- Solid R (+35.2) · D 31.5% · R 66.7% · Other 1.8%
- 2008→2024 swing
- -23.1pp toward R · 2008: -12.1pp · 2024: -35.2pp
- All cycles
- 2024: R+35.2 2020: R+32.8 2016: R+36.2 2012: R+16.6 2008: R+12.1
Not yet ingested
- Civics
- —
Market trends
- HPI YoY
- ▼ -166.22%
- Current HPI
- 192.7295
- Rent YoY
- —
- Metro
- —
- State GDP YoY
- ▲ 2.41%
- F500 in state
- 34
Industry mix (Fortune 500 HQ in MN)
| Industry | F500 HQs | Revenue |
|---|---|---|
| Healthcare | 2 | $407B |
|
||
| Retail | 2 | $150B |
|
||
| Consumer Goods | 2 | $32B |
|
||
| Industrial Machinery | 2 | $6B |
|
||
| Agriculture | 1 | $40B |
|
||
| Healthcare / Medical Devices | 1 | $32B |
|
||
Price history
-6.3% since first listed8 events — show timeline
- 2026-06-14 Pending — RASM
- 2026-06-03 Contingent — RASM
- 2026-05-19 Listed $74,900 RASM
- 2026-05-06 Coming Soon $74,900 RASM
- 2011-07-05 Listed $84,900 NORTHSTARMLS as Distributed by MLS Grid
- 2005-05-16 Sold (MLS) $77,900 NORTHSTARMLS as Distributed by MLS Grid
- 2005-05-11 Listing Removed — NORTHSTARMLS as Distributed by MLS Grid
- 2005-04-07 Listed $79,900 NORTHSTARMLS as Distributed by MLS Grid
Property tax history
+3.3%/yrLatest (2025): $1,848 · +6.7% YoY. Source: county tax records.
Cash-flow waterfall
monthlySold comps — $/sqft
last 12 mo · ≤1 miLoading sold comps…