716 Pioneering Loop · Liberty Hill, TX
Flood risk No data
- FEMA flood zone
- —
- Chance of flooding over 30 yrs
- —
- Est. flood insurance / yr
- —
Fire risk No data
- Est. fire insurance / yr
- —
Heat risk No data
- Hot days now (above threshold)
- —
- Hot days in 30 yrs
- —
Wind risk No data
- Chance of severe wind over 30 yrs
- —
Air-quality risk No data
- Unhealthy air days now
- —
- Unhealthy air days in 30 yrs
- —
Risk factors via First Street. Map © Google.
Why this score? — see what drove the B grade
The composite is a weighted blend of 9 inputs, each scored 0–100. Each bar is that input's sub-score; the figure is the points it added to the 100-point composite (weight × sub-score).
- Cash flow +30.0/30.0
- 1% rule +10.0/10.0
- DSCR +10.0/10.0
- ARV discount +7.5/15.0
- Schools +4.4/10.0
- Condition / age +4.0/5.0
- Livability +3.4/5.0
- Rent growth +2.0/5.0
- Appreciation +0.0/10.0
$103,999
🖨 Deal sheet 📄 Offer letter ✓ Due diligence
Listing remarks MLS
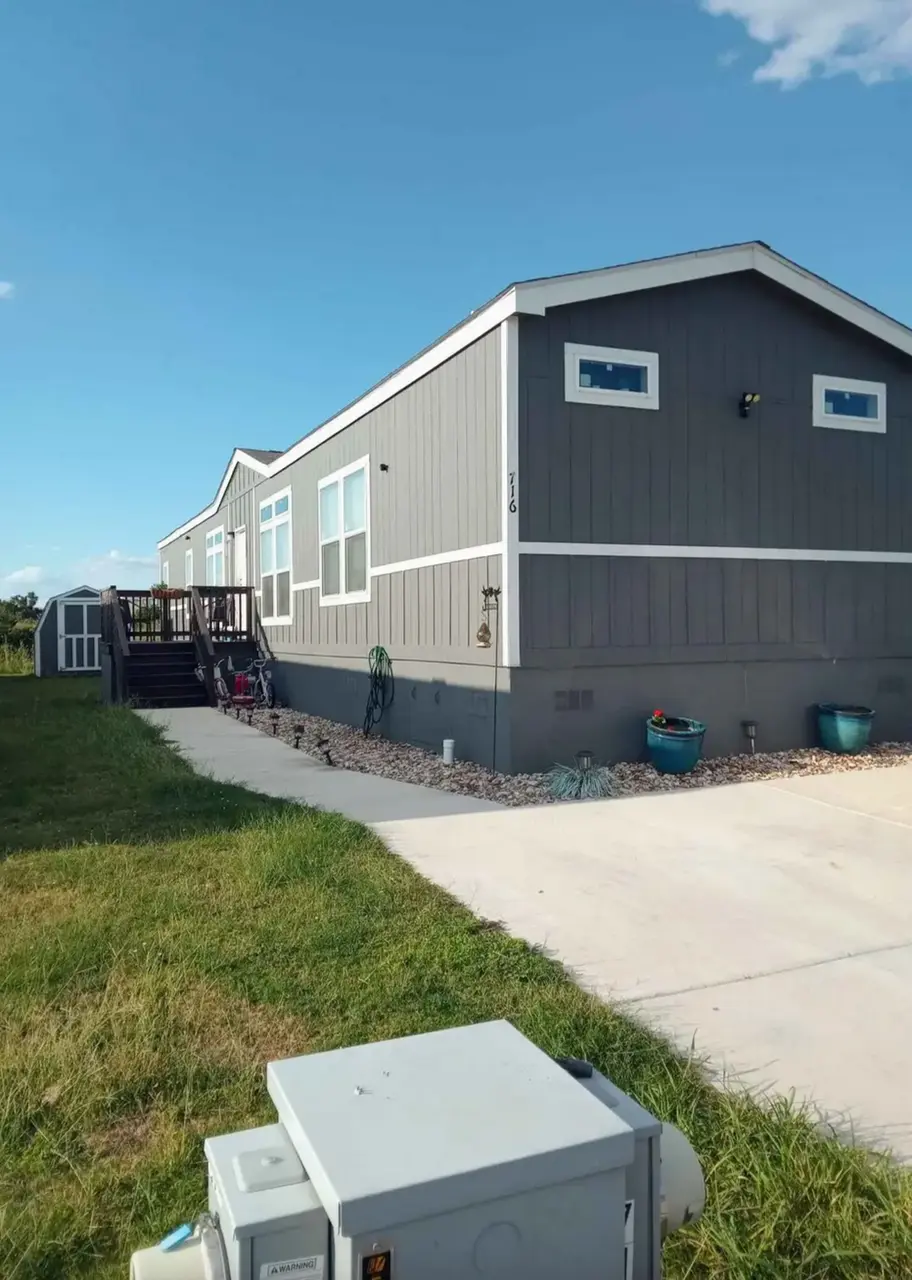
Beautiful 2022 Palm harbor Santa Fe style 3 bedroom 2 bath home at Grand oaks moved in ready or can be moved $103,999
Key facts
- Built 2022
- Listed 170 days
Neighborhood map
What this means for you Summary
Snapshot
- This is a 3-bed/2.0-bath single-family listed at $104k. Condition is rated good.
Deal economics
- At list price, monthly cash flow is $881 ($11k/yr) — positive.
- The deal already cash-flows at list — no discount required.
- Meets the 1% rule at list price ($2k rent vs $104k).
- Recommended offer: $92k (12.0% below list) — sets the bar for market timing.
- Cap rate 16.5% vs local median 2.8% in Liberty Hill — top-decile yield for the area; either an underpriced asset or a hidden risk that comps aren't pricing in. Stress-test before assuming the spread holds.
Location & tenants
- Location reads 68/100 on livability (#495 in TX) — a middle-class / working-renter tenant base. Strengths: cost of living A+, housing A+, crime A; Watch: schools C-, employment D+, amenities F.
- Liberty Hill ISD (rural): math 43% / reading 52% proficiency, ranked #160 of 826 in TX (top 19%) — families likely to look elsewhere, expect single-tenant / working-renter base with shorter leases.
- Market conditions: Rents soft (-1.9%/yr); 1496 active listings in the ZIP; 22 comparable units currently listed for rent nearby; rentals at typical pace (median 18d on market — plan ~3-4 weeks tenant-placement turnaround); high-income renter base; 7,543 units permitted in Williamson County in 2024 (1,425 in 5+ unit buildings).
Forward outlook
- Local home prices are declining (-3.0%/yr); year-one equity from $719 of loan paydown is wiped out by about $3k of value loss. Plan a longer hold.
- Williamson County population projected at +69% by 2050 — long-run rental-demand tailwind backs the buy-and-hold thesis.
- At projected returns (-3.0% appreciation + 0.0% rent growth), your $29k cash investment doubles in ~4 years — after that, you're playing with house money.
Negotiation context
- It's been on market 170 days — a 12% lower offer ($92k) is reasonable based on typical stale-listing flexibility.
Questions for the listing agent
- It's been on market 170 days. Have you received any prior offers? Is the seller open to a 12% concession, seller financing, or rate buy-down credit?
- Why hasn't it sold? Are there any deal-killer items the seller is aware of (foundation, flood, title, zoning, code violations)?
- Is there a deadline driving the sale (1031 exchange, divorce, estate, relocation)? That informs how much negotiation room exists.
- What's the average days-on-market for RENTAL listings here right now (not sales)? A rising rental-DOM trend means longer vacancies and softer asking-rent achievability than the comps imply.
- What's the recent tenant-quality profile in this submarket — average credit score on applications, eviction rate, late-payment / NSF rate, and stable-employment percentage? A property-management company in the area should have these aggregated.
- How much new for-sale + rental construction is in the pipeline within 1–3 miles? Heavy new supply typically softens prices + rents 12–24 months out; constrained supply supports both.
Investment metrics
- 1% rule
- 1.95% ✓
- Cap rate
- 16.45%
- Cash-on-cash
- 36.29%
- DSCR
- 2.61
- GRM
- 4.3
CMA / ARV
- ARV (median comp)
- $368,814
- List price
- $103,999
- Delta
- -71.80%
- Verdict
- UNDERPRICED
- Comps
- 13 within 1.0 mi
Projected returns pro-forma
-3.0% appreciation · 0.0% rent growth · sell at horizon
- IRR
- 28.6%
- Equity multiple
- 2.14×
- Total profit
- $33,332
- Equity at exit
- $15,507
- IRR
- 34.2%
- Equity multiple
- 3.69×
- Total profit
- $78,441
- Equity at exit
- $8,992
Cash invested: $29,120 (down + closing). Projections, not guarantees.
Landlord ↔ Tenant lean methodology
- Overall (STATE)
- 87 Strongly Landlord-Friendly
- State Texas
- 87 Strongly Landlord-Friendly · R+5
- County
- — inherits STATE
- City
- — inherits STATE
ZIP-level market 78642
- Home prices YoY
- -32.4%
- Rents YoY
- -1.9%
- Active inventory
- 1496
- Price-to-rent
- 4.3×
Monthly cashflow live
- Estimated rent
- $2,024 high interval (Pro) →
- Mortgage (P&I)
- −$545
- Tax est. 1.5%
- −$130 /mo · $1,560/yr
- Insurance
- −$43
- HOA
- −$0
- Vacancy / Maint / Mgmt
- −$425
- Net cashflow
- $881
Break-even live
UW: 25.0% down · 7.5% · 30yr · 1.5% tax · 5.0% vac · 8.0% maint · 8.0% mgmt
Financing live
Cash to close
- Down payment
- $26,000
- Closing costs
- $3,120
- Reserves months
- —
- Total cash needed
- —
Loan-product check · same deal, 3 products live
Conventional
25% down · 7.5% · 30yr
- Down + closing
- —
- Monthly P&I
- —
- Monthly cashflow
- —
- DSCR
- —
- Eligible?
- —
Personal DTI + credit; lowest rate.
DSCR
20% down · 8.5% · 30yr
- Down + closing
- —
- Monthly P&I
- —
- Monthly cashflow
- —
- DSCR
- —
- Eligible?
- —
No personal income docs; deal must DSCR.
Hard money
10% down · 12.0% · 12mo
- Down + closing
- —
- Monthly P&I
- —
- Monthly cashflow
- —
- DSCR
- —
- Eligible?
- —
Short-term bridge; refi at stabilization.
Rent comps 22 comps
| Address | Beds | Baths | Sqft | Rent | $/sqft | DOM | Units | Dist |
|---|---|---|---|---|---|---|---|---|
| 100 Grand Oak Cir Liberty Hill, TX | 3.0 | 1.0–2.0 | 1148 | $1,550 | $1.35 | 1d | 1 | 0.27mi |
| 632 Independence Ave Liberty Hill, TX | 3.0 | 2.0 | 1530 | $1,925 | $1.26 | 12d | 1 | 1.01mi |
| 149 Proclamation Ave Liberty Hill, TX | 4.0 | 2.5 | 1818 | $1,775 | $0.98 | 43d | 1 | 1.07mi |
| 149 Proclamation Ave Liberty Hill, TX | 4.0 | 2.5 | 1818 | $1,775 | $0.98 | 44d | 1 | 1.07mi |
| 132 Presidential Path Liberty Hill, TX | 3.0 | 2.0 | 1535 | $1,685 | $1.10 | 43d | 1 | 1.08mi |
| 256 Tequilana Pass Leander, TX | 4.0 | 2.0 | 1746 | $1,995 | $1.14 | 17d | 1 | 1.12mi |
| 509 Washington Dr Liberty Hill, TX | 4.0 | 2.0 | 1793 | $1,850 | $1.03 | 17d | 1 | 1.17mi |
| 252 Mount Vernon Way Liberty Hill, TX | 3.0 | 2.5 | 1414 | $1,700 | $1.20 | 43d | 1 | 1.24mi |
| 252 Mount Vernon Way Liberty Hill, TX | 3.0 | 3.0 | 1414 | $1,700 | $1.20 | 14d | 1 | 1.24mi |
| 136 Constitution St Liberty Hill, TX | 3.0 | 2.0 | 1566 | $1,850 | $1.18 | 10d | 1 | 1.25mi |
| 1201 Seward Junction Loop Liberty Hill, TX | 1.0–3.0 | 1.0–2.0 | 977 | $2,777 | $2.84 | 1d | 1 | 1.28mi |
| 112 Declaration Ln Unit 112 Liberty Hill, TX | 3.0 | 2.0 | 1525 | $1,945 | $1.28 | 43d | 1 | 1.31mi |
| 112 Declaration Ln Liberty Hill, TX | 3.0 | 2.0 | 1525 | $1,750 | $1.15 | 2d | 1 | 1.31mi |
| 151 Shawii Pass Liberty Hill, TX | 4.0 | 2.0 | 1734 | $2,000 | $1.15 | 20d | 1 | 1.31mi |
| 112 Shawi Pass Leander, TX | 4.0 | 2.0 | 1734 | $1,995 | $1.15 | 17d | 1 | 1.31mi |
| 218 Cascata Way Liberty Hill, TX | 3.0 | 2.5 | 1798 | $2,195 | $1.22 | 17d | 1 | 1.33mi |
| 737 Drystone Trl Liberty Hill, TX | 3.0 | 2.0 | 1457 | $2,295 | $1.58 | 11d | 1 | 1.34mi |
| 117 Chickadee Ln Leander, TX | 4.0 | 2.5 | 1831 | $1,985 | $1.08 | 24d | 1 | 1.39mi |
| 273 La Dera Dr Liberty Hill, TX | 3.0 | 2.0 | 1590 | $1,950 | $1.23 | 43d | 1 | 1.47mi |
| 91 Pacific Loon St Leander, TX | 3.0 | 2.5 | 1837 | $2,075 | $1.13 | 14d | 1 | 1.47mi |
| 86 Pacific Loon St Leander, TX | 3.0 | 2.0 | 1515 | $1,995 | $1.32 | 2d | 1 | 1.48mi |
| 9975 W State Highway 29 Liberty Hill, TX | 1.0–3.0 | 1.0–2.0 | 977 | $2,912 | $2.98 | 3d | 1 | 1.49mi |
Listing history 14 events
-
2026-06-18days on market $103,999 Active 170 DOM
-
2026-06-17days on market $103,999 Active 169 DOM
-
2026-06-16days on market $103,999 Active 168 DOM
-
2026-06-15days on market $103,999 Active 167 DOM
-
2026-06-13days on market $103,999 Active 165 DOM
-
2026-06-09days on market $103,999 Active 161 DOM
-
2026-06-08days on market $103,999 Active 160 DOM
-
2026-06-07days on market $103,999 Active 159 DOM
-
2026-06-05days on market $103,999 Active 156 DOM
-
2026-06-03days on market $103,999 Active 155 DOM
-
2026-06-02days on market $103,999 Active 154 DOM
-
2026-06-01days on market $103,999 Active 153 DOM
-
2026-05-31days on market $103,999 Active 152 DOM
-
2025-12-30$103,999 Active 117-char remark
Show marketing remark (117 chars)
Beautiful 2022 Palm harbor Santa Fe style 3 bedroom 2 bath home at Grand oaks moved in ready or can be moved $103,999
ⓘ Source: listings_history table (triggers on properties + properties_extension) + one-shot
backfill from property_details.listing_events for pre-trigger history.
Nearby sold comps map
Loading sold comps map…
Walkable amenities ~0.75 mi
Loading nearby amenities…
Taxation est. · year 1
- Rental income
- $24,294
- − Mortgage interest
- −$5,826
- − Property taxes
- −$1,560
- − Insurance
- −$520
- − Repairs & maintenance
- −$1,943
- − Management
- −$1,943
- − Depreciation
- −$3,025
- Taxable income
- $9,476
- Est. tax owed @ 24.0%
- −$2,274
- After-tax cash flow
- $8,293/yr
For passive investors: Depreciation is non-cash, so a rental often shows a tax loss while cash-flowing — sheltering income. Rental losses are passive: they offset passive income freely, and up to $25,000/yr can offset ordinary (W-2) income if you actively participate and your MAGI is under $100k (phasing out to $0 by $150k); unused losses carry forward. On sale, claimed depreciation is recaptured at up to 25%, and gains may owe capital-gains tax (a 1031 exchange can defer both). Figures are a year-1 estimate at your 24.0% rate — not tax advice; consult a CPA.
Condition & rehab AI · 10 photos
This 2022 Palm Harbor Santa Fe style home is in excellent condition and move-in ready, with modern finishes and a well-maintained exterior. It offers a good return on investment with potential for further updates to enhance its value.
Value-add opportunities
- Both Painting the exterior and interior walls — Fresh paint can enhance curb appeal and interior aesthetics.
- Both Updating the flooring in the bathrooms — Replacing old tile with a more modern material can improve both resale and rental value.
- Both Upgrading the kitchen appliances — Modernizing the kitchen can attract more buyers and renters.
- Both Adding smart home features — Smart home technology can increase the home's appeal and marketability.
- Both Landscaping improvements — Enhancing the landscaping can make the home more inviting and increase its curb appeal.
Renovation cost estimate screening
Value-add ROI direction
- Both Painting the exterior and interior walls — Fresh paint can enhance curb appeal and interior aesthetics. ↑
- Both Updating the flooring in the bathrooms — Replacing old tile with a more modern material can improve both resale and rental value. ↑
- Both Upgrading the kitchen appliances — Modernizing the kitchen can attract more buyers and renters. ↑
- Both Adding smart home features — Smart home technology can increase the home's appeal and marketability. ↑
- Both Landscaping improvements — Enhancing the landscaping can make the home more inviting and increase its curb appeal. ↑
ⓘ Cost ranges are severity-bucket heuristics (US national rule-of-thumb). Get contractor quotes + a written scope before underwriting a rehab budget.
Schools (NCES district)
- District
- Liberty Hill ISD
- NCES district ID
- 4827420
- Math proficiency
- 43% ▼ -20.00%
- Reading proficiency
- 52% ▼ -11.00%
- Median HH income
- $81,084
- Composite
- 43.65/100
- National rank
- #2965
- State rank
- #160 of 826 in TX
Livability — Liberty Hill
- Score
- 68/100
- State rank
- #495
- US rank
- #9892
Category grades
Schools grade is shown separately in the Schools card above.
Census & demographics
- Census place
- Liberty Hill, TX
- County
- Williamson County · 680,029 people
- City population
- 26,434
- Metro
- Austin-Round Rock-Georgetown, TX
- Population (ZIP)
- 26,434
- Household income
- $132,958
- Rent vs Own
- Severe rent burden
- 220.0
Population outlook (Williamson County) Hauer SSP2
- Today (2025)
- 699,027 people
- By 2030
- 795,537 · +13.8%
- By 2040
- 990,683 · +41.7%
- By 2050
- 1,184,292 · +69.4%
- By 2075
- 1,623,825 · +132.3%
- By 2100
- 1,924,153 · +175.3%
Race, ethnicity, and origin ACS 2023
- Neighborhood character
- Predominantly White (65%)
- Race & ethnicity
- White 65% Hispanic / Latino 27% Two or more races 14% Asian 2% Black 2%
- Hispanic origin (detail)
- Mexican 25% Puerto Rican 1%
- Common ancestry
- Slovak 3% Romanian 3% Lithuanian 3%
- Foreign-born
- 9% · Canada
- Languages at home
- 81% English-only · Spanish 15% Other Asian/Pacific 1% Tagalog/Filipino 1%
Political lean MEDSL · Williamson
- 2024 margin
- Toss-up / Even · D 48.0% · R 50.4% · Other 1.6%
- 2008→2024 swing
- +10.6pp toward D · 2008: -13.0pp · 2024: -2.5pp
- All cycles
- 2024: R+2.5 2020: D+1.4 2016: R+9.9 2012: R+21.5 2008: R+13.0
Not yet ingested
- Civics
- —
Market trends
- HPI YoY
- ▼ -109.62%
- Current HPI
- 228.5772
- Rent YoY
- ▼ -1.89%
- Metro
- Austin-Round Rock-Georgetown, TX
- State GDP YoY
- ▲ 3.95%
- F500 in state
- 110
Industry mix (Fortune 500 HQ in TX)
| Industry | F500 HQs | Revenue |
|---|---|---|
| Energy | 16 | $1,198B |
|
||
| Technology | 5 | $198B |
|
||
| Engineering / Construction | 4 | $72B |
|
||
| Energy Services | 3 | $60B |
|
||
| Utilities | 3 | $41B |
|
||
| Healthcare | 2 | $330B |
|
||
Price history
1 event — show timeline
- 2025-12-30 Listed $103,999 ForSaleByOwner.com
Cash-flow waterfall
monthlySold comps — $/sqft
last 12 mo · ≤1 miLoading sold comps…