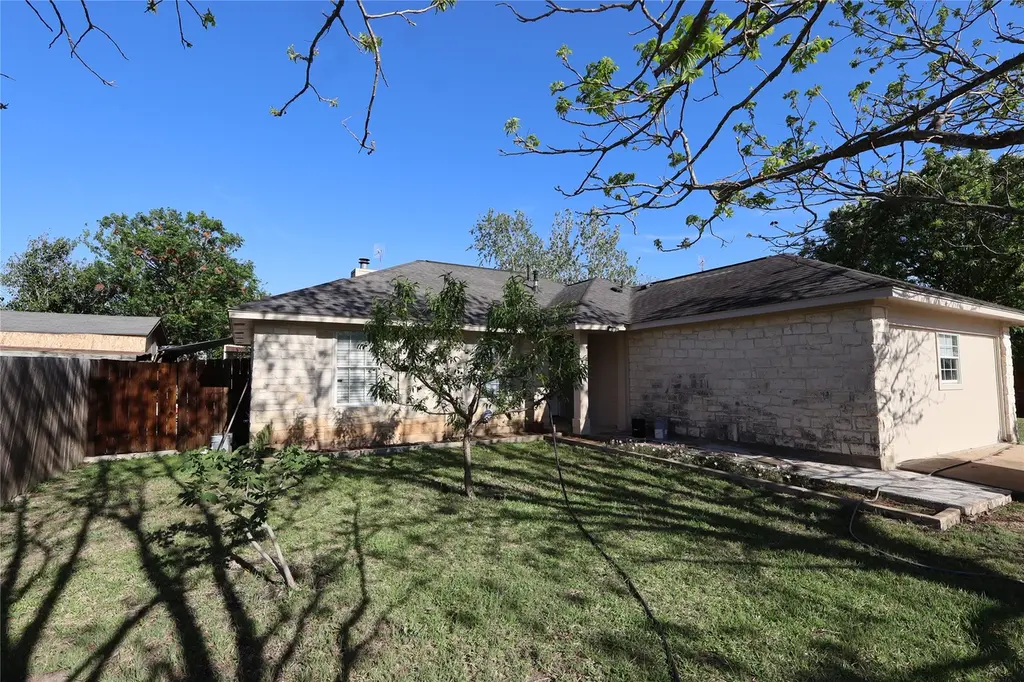
7003 Apperson St · Austin, TX
Flood risk 1/10 · Minimal
- FEMA flood zone
- X (unshaded)
- Chance of flooding over 30 yrs
- 0.0%
- Est. flood insurance / yr
- $507 – $1,088
Fire risk 5/10 · Moderate
- Est. fire insurance / yr
- $1,222 – $2,270
Heat risk 8/10 · Major
- Hot days now (above 110°F)
- 7 days/yr
- Hot days in 30 yrs
- 23 days/yr
Wind risk 8/10 · Major
- Chance of severe wind over 30 yrs
- 80.0%
Air-quality risk 1/10 · Minimal
- Unhealthy air days now
- 0 days/yr
- Unhealthy air days in 30 yrs
- 0 days/yr
Risk factors via First Street. Map © Google.
Why this score? — see what drove the D grade
The composite is a weighted blend of 9 inputs, each scored 0–100. Each bar is that input's sub-score; the figure is the points it added to the 100-point composite (weight × sub-score).
- ARV discount +15.0/15.0
- Cash flow +6.8/30.0
- Livability +4.1/5.0
- Appreciation +3.4/10.0
- 1% rule +3.2/10.0
- Condition / age +2.5/5.0
- Rent growth +2.4/5.0
- Schools +1.9/10.0
- DSCR +1.1/10.0
$249,000
🖨 Deal sheet 📄 Offer letter ✓ Due diligence
Listing remarks MLS
Step into this beautifully updated home featuring stylish tile flooring and a renovated kitchen complete with elegant granite countertops and refreshed cabinetry. The spacious open-concept layout flows effortlessly into the inviting family room, highlighted by a charming gas-log fireplace — perfect for relaxing evenings. Enjoy meals in the cozy kitchen dining area, all located in a highly desirable neighborhood you’ll love coming home to. This home features a thoughtfully converted garage creating a private additional living space complete with a bedroom, kitchenette, and full bath with shower — perfect for guests, extended family, or rental income. Currently tenant-occupied and generating $800/month, offering immediate cash-flow potential for investors or homeowners alike.
Key facts
- Renovated kitchen
- Updated home
- Refreshed cabinetry
Tags
Neighborhood map
What this means for you Summary
Snapshot
- This is a 4-bed/2.0-bath single-family listed at $249k.
Deal economics
- At list price, monthly cash flow is $-382 ($-5k/yr) — negative.
- To cash-flow at today's rent, offer at most $181k (27.1% below list).
- To meet the 1% rule (rent ≥ 1% of price), the offer needs to be $203k (18.4% below list).
- Recommended offer: $181k (27.1% below list) — sets the bar for cash-flow.
- Cap rate 4.5% vs local median 1.8% in Austin — top-decile yield for the area; either an underpriced asset or a hidden risk that comps aren't pricing in. Stress-test before assuming the spread holds.
Location & tenants
- Location reads 82/100 on livability (#16 in TX, #1,208 nationally) — a professional / high-income tenant draw. Strengths: amenities A+, commute A+, employment A+; Watch: cost of living D, crime F.
- Del Valle ISD (rural): math 19% / reading 26% proficiency, ranked #749 of 826 in TX (top 91%) — low school quality limits family demand, transient renter base, plan for 1-2y turnover; 77% free/reduced lunch — lower-income household profile, screen leases tightly.
- Market conditions: Rents soft (-0.4%/yr); 246 active listings in the ZIP; 22 comparable units currently listed for rent nearby; rentals at typical pace (median 24d on market — plan ~3-4 weeks tenant-placement turnaround); 41% of comp listings sitting > 30 days — soft ceiling on asking rent; 17,121 units permitted in Travis County in 2024 (11,963 in 5+ unit buildings).
- This rent runs 34% of the median local income ($72k/yr) — at the standard rent-burdened threshold; future hikes will face affordability resistance.
Forward outlook
- Local home prices are declining (-3.0%/yr); year-one equity from $2k of loan paydown is wiped out by about $7k of value loss. Plan a longer hold.
- Travis County population projected at +60% by 2050 — long-run rental-demand tailwind backs the buy-and-hold thesis.
Negotiation context
- It's been on market 124 days — a 12% lower offer ($219k) is reasonable based on typical stale-listing flexibility.
- 4 sale attempts since 31y ago; this cycle's ask has dropped $90k (27%) from the opening price — seller is motivated, your offer sets the floor, not the list.
Risks & watch-outs
- Watch-outs: property tax is 2.8% of price.
- Climate carrying-cost: severe wind risk, 80% chance of damaging wind over 30y; moderate wildfire risk; extreme-heat days projected 7→23/yr by 2055 (HVAC capex compounding) — expect insurance premiums to compound above CPI over the hold.
Questions for the listing agent
- What do current leases actually rent for vs. the listed asking? Can we see a recent rent roll and the last 12 months of T-12 income?
- It's been on market 124 days. Have you received any prior offers? Is the seller open to a 27% concession, seller financing, or rate buy-down credit?
- Property tax is high relative to price — has the assessment been appealed recently, and will the sale trigger a re-assessment?
- Why hasn't it sold? Are there any deal-killer items the seller is aware of (foundation, flood, title, zoning, code violations)?
- Is there a deadline driving the sale (1031 exchange, divorce, estate, relocation)? That informs how much negotiation room exists.
- Crime grade is F in this area — have there been break-ins, vandalism, or insurance claims at this property in the last 3 years? What carrier currently insures it and at what premium?
- The area grade is low — what's the realistic commute time and amenity access for the typical tenant pool here? Any planned neighborhood developments (good or bad) we should know about?
- What's the average days-on-market for RENTAL listings here right now (not sales)? A rising rental-DOM trend means longer vacancies and softer asking-rent achievability than the comps imply.
- What's the recent tenant-quality profile in this submarket — average credit score on applications, eviction rate, late-payment / NSF rate, and stable-employment percentage? A property-management company in the area should have these aggregated.
- How much new for-sale + rental construction is in the pipeline within 1–3 miles? Heavy new supply typically softens prices + rents 12–24 months out; constrained supply supports both.
Investment metrics
- 1% rule
- 0.82% ✗
- Cap rate
- 4.45%
- Cash-on-cash
- -6.58%
- DSCR
- 0.71
- GRM
- 10.2
CMA / ARV
- ARV (median comp)
- $303,827
- List price
- $249,000
- Delta
- -18.05%
- Verdict
- UNDERPRICED
- Comps
- 20 within 1.0 mi
Show comp detail 8 sales within ~0.75 mi
| Address | Dist | Beds/Ba | Sqft | Sold | Price | $/sf | Match |
|---|---|---|---|---|---|---|---|
| 11717 Railton Dr | 0.18mi | 3/2.5 (-1) | 1,614 (-6%) | 2mo | $245,000 | $152 | 72 |
| 7201 Great Panda Cv | 0.34mi | 3/2.5 (-1) | 1,714 (-1%) | 8mo | $255,000 | $149 | 69 |
| 7247 Wardman Dr | 0.29mi | 4/2.5 | 1,910 (+11%) | 1mo | $369,900 | $194 | 66 |
| 6708 Campina Xing | 0.56mi | 3/2.5 (-1) | 1,699 (-2%) | 3mo | $214,900 | $126 | 61 |
| 11812 Morning View Dr | 0.31mi | 3/2.0 (-1) | 1,539 (-11%) | 6mo | $295,000 | $192 | 58 |
| 11825 Plains Valley Dr | 0.54mi | 3/2.5 (-1) | 1,699 (-2%) | 16mo | $265,000 | $156 | 52 |
| 6900 Plains Crest Dr | 0.64mi | 4/2.5 | 1,610 (-7%) | 17mo | $310,000 | $193 | 43 |
| 6900 Ferrystone Pass | 0.70mi | 3/2.5 (-1) | 1,641 (-5%) | 22mo | $329,000 | $200 | 33 |
Match score weights: distance 35% · size 25% · config 20% · recency 20%. Top-matched comps best support the ARV.
Projected returns pro-forma
-3.0% appreciation · 0.0% rent growth · sell at horizon
- IRR
- -31.6%
- Equity multiple
- -0.01×
- Total profit
- $-70,461
- Equity at exit
- $37,127
- IRR
- -61.6%
- Equity multiple
- -0.65×
- Total profit
- $-114,932
- Equity at exit
- $21,529
Cash invested: $69,720 (down + closing). Projections, not guarantees.
Landlord ↔ Tenant lean methodology
- Overall (STATE)
- 87 Strongly Landlord-Friendly
- State Texas
- 87 Strongly Landlord-Friendly · R+5
- County
- — inherits STATE
- City
- — inherits STATE
ZIP-level market 78617
- Home prices YoY
- -1.7%
- Rents YoY
- -0.4%
- Active inventory
- 246
- Price-to-rent
- 10.2×
Monthly cashflow live
- Estimated rent
- $2,031 high interval (Pro) →
- Mortgage (P&I)
- −$1,306
- Tax from tax record
- −$577 /mo · $6,930/yr
- Insurance
- −$104
- HOA
- −$0
- Vacancy / Maint / Mgmt
- −$427
- Net cashflow
- $-382
Break-even live
UW: 25.0% down · 7.5% · 30yr · 1.5% tax · 5.0% vac · 8.0% maint · 8.0% mgmt
Financing live
Cash to close
- Down payment
- $62,250
- Closing costs
- $7,470
- Reserves months
- —
- Total cash needed
- —
Loan-product check · same deal, 3 products live
Conventional
25% down · 7.5% · 30yr
- Down + closing
- —
- Monthly P&I
- —
- Monthly cashflow
- —
- DSCR
- —
- Eligible?
- —
Personal DTI + credit; lowest rate.
DSCR
20% down · 8.5% · 30yr
- Down + closing
- —
- Monthly P&I
- —
- Monthly cashflow
- —
- DSCR
- —
- Eligible?
- —
No personal income docs; deal must DSCR.
Hard money
10% down · 12.0% · 12mo
- Down + closing
- —
- Monthly P&I
- —
- Monthly cashflow
- —
- DSCR
- —
- Eligible?
- —
Short-term bridge; refi at stabilization.
Rent comps 22 comps
| Address | Beds | Baths | Sqft | Rent | $/sqft | DOM | Units | Dist |
|---|---|---|---|---|---|---|---|---|
| 11604 Railton Dr Del Valle, TX | 3.0 | 2.0 | 1218 | $1,950 | $1.60 | 44d | 1 | 0.08mi |
| 7220 Wardman Dr Del Valle, TX | 3.0 | 2.0 | 1662 | $1,895 | $1.14 | 44d | 1 | 0.25mi |
| 11712 Morning View Dr Del Valle, TX | 4.0 | 2.0 | 1593 | $1,895 | $1.19 | 13d | 1 | 0.28mi |
| 7121 Elroy Rd Del Valle, TX | 1.0–3.0 | 1.0–2.0 | 951 | $2,006 | $2.11 | 2d | 26 | 0.52mi |
| 7232 Dancing Wind Ln Del Valle, TX | 3.0 | 2.5 | 1392 | $1,725 | $1.24 | 4d | 1 | 0.57mi |
| 7236 Dancing Wind Ln Del Valle, TX | 4.0 | 2.5 | 1566 | $1,750 | $1.12 | 44d | 1 | 0.58mi |
| 7100 Dancing Wind Ln Del Valle, TX | 3.0 | 2.5 | 1568 | $1,850 | $1.18 | 44d | 1 | 0.59mi |
| 7224 Spotted Leaf Way Del Valle, TX | 3.0 | 2.0 | 1646 | $1,950 | $1.18 | 15d | 1 | 0.61mi |
| 7136 Spotted Leaf Way Del Valle, TX | 3.0 | 2.5 | 1377 | $1,900 | $1.38 | 24d | 1 | 0.63mi |
| 12213 Rising Moon Ln Del Valle, TX | 4.0 | 2.5 | 1578 | $1,950 | $1.24 | 22d | 1 | 0.63mi |
| 6417 Wagon Spring St Del Valle, TX | 3.0 | 2.5 | 2230 | $2,100 | $0.94 | 13d | 1 | 0.88mi |
| 6417 Wagon Spring St Del Valle, TX | 3.0 | 2.5 | 2230 | $2,149 | $0.96 | 44d | 1 | 0.88mi |
| 6400 Wagon Spring St Del Valle, TX | 3.0 | 2.5 | 1665 | $1,975 | $1.19 | 4d | 1 | 0.88mi |
| 6420 Carriage Pines Dr Del Valle, TX | 3.0 | 2.5 | 1665 | $1,995 | $1.20 | 44d | 1 | 0.89mi |
| 6409 Wagon Spring St Del Valle, TX | 4.0 | 2.0 | 1421 | $1,895 | $1.33 | 16d | 1 | 0.89mi |
| 6200 Albany Sleigh Dr Del Valle, TX | 3.0 | 2.0 | 1647 | $2,350 | $1.43 | 44d | 1 | 1.05mi |
| 12901 Staywell Way Del Valle, TX | 3.0 | 2.0 | 1860 | $2,200 | $1.18 | 44d | 1 | 1.16mi |
| 12305 Paloma Blanca Way Del Valle, TX | 3.0 | 2.0 | 1208 | $1,749 | $1.45 | 44d | 1 | 1.29mi |
| 5820 Angel Dr Del Valle, TX | 3.0 | 2.0 | 1203 | $1,950 | $1.62 | 18d | 1 | 1.38mi |
| 5820 Angel Dr Del Valle, TX | 3.0 | 2.0 | 1203 | $1,850 | $1.54 | 3d | 1 | 1.38mi |
| 12417 Sky Harbor Dr Del Valle, TX | 3.0 | 2.0 | 1586 | $1,975 | $1.25 | 24d | 1 | 1.39mi |
| 12604 Paloma Blanca Way Del Valle, TX | 3.0 | 2.0 | 1423 | $1,700 | $1.19 | 16d | 1 | 1.44mi |
Listing history 26 events
-
2026-06-18days on market $249,000 Active 124 DOM
-
2026-06-17days on market $249,000 Active 123 DOM
-
2026-06-16days on market $249,000 Active 122 DOM
-
2026-06-15days on market $249,000 Active 121 DOM
-
2026-06-13days on market $249,000 Active 119 DOM
-
2026-06-09days on market $249,000 Active 115 DOM
-
2026-06-08days on market $249,000 Active 114 DOM
-
2026-06-07days on market $249,000 Active 113 DOM
-
2026-06-04days on market $249,000 Active 110 DOM
-
2026-06-03days on market $249,000 Active 109 DOM
-
2026-06-02days on market $249,000 Active 108 DOM
-
2026-06-01days on market $249,000 Active 107 DOM
-
2026-05-31days on market $249,000 Active 106 DOM
-
2026-04-28price $249,000 802-char remark
Show marketing remark (802 chars)
Step into this beautifully updated home featuring stylish tile flooring and a renovated kitchen complete with elegant granite countertops and refreshed cabinetry. The spacious open-concept layout flows effortlessly into the inviting family room, highlighted by a charming gas-log fireplace — perfect for relaxing evenings. Enjoy meals in the cozy kitchen dining area, all located in a highly desirable neighborhood you’ll love coming home to. This home features a thoughtfully converted garage creating a private additional living space complete with a bedroom, kitchenette, and full bath with shower — perfect for guests, extended family, or rental income. Currently tenant-occupied and generating $800/month, offering immediate cash-flow potential for investors or homeowners alike.
-
2026-03-15price $259,000 802-char remark
Show marketing remark (802 chars)
Step into this beautifully updated home featuring stylish tile flooring and a renovated kitchen complete with elegant granite countertops and refreshed cabinetry. The spacious open-concept layout flows effortlessly into the inviting family room, highlighted by a charming gas-log fireplace — perfect for relaxing evenings. Enjoy meals in the cozy kitchen dining area, all located in a highly desirable neighborhood you’ll love coming home to. This home features a thoughtfully converted garage creating a private additional living space complete with a bedroom, kitchenette, and full bath with shower — perfect for guests, extended family, or rental income. Currently tenant-occupied and generating $800/month, offering immediate cash-flow potential for investors or homeowners alike.
-
2026-03-04price $289,990 802-char remark
Show marketing remark (802 chars)
Step into this beautifully updated home featuring stylish tile flooring and a renovated kitchen complete with elegant granite countertops and refreshed cabinetry. The spacious open-concept layout flows effortlessly into the inviting family room, highlighted by a charming gas-log fireplace — perfect for relaxing evenings. Enjoy meals in the cozy kitchen dining area, all located in a highly desirable neighborhood you’ll love coming home to. This home features a thoughtfully converted garage creating a private additional living space complete with a bedroom, kitchenette, and full bath with shower — perfect for guests, extended family, or rental income. Currently tenant-occupied and generating $800/month, offering immediate cash-flow potential for investors or homeowners alike.
-
2026-02-14$339,000 Active 802-char remark
Show marketing remark (802 chars)
Step into this beautifully updated home featuring stylish tile flooring and a renovated kitchen complete with elegant granite countertops and refreshed cabinetry. The spacious open-concept layout flows effortlessly into the inviting family room, highlighted by a charming gas-log fireplace — perfect for relaxing evenings. Enjoy meals in the cozy kitchen dining area, all located in a highly desirable neighborhood you’ll love coming home to. This home features a thoughtfully converted garage creating a private additional living space complete with a bedroom, kitchenette, and full bath with shower — perfect for guests, extended family, or rental income. Currently tenant-occupied and generating $800/month, offering immediate cash-flow potential for investors or homeowners alike.
-
2006-04-24soldstatus 270-char remark
Show marketing remark (270 chars)
You won't believe these hard tile floors. Absolutely Beautiful!!!! This home has a wide open floor plan and a lovely gas log fireplace in the family room. There is formal dining, as well as a cozy kitchen dining area. All this & a desirable area!!!Restrictions: Yes
-
2006-03-20soldstatus
-
2006-02-08historical 270-char remark
Show marketing remark (270 chars)
You won't believe these hard tile floors. Absolutely Beautiful!!!! This home has a wide open floor plan and a lovely gas log fireplace in the family room. There is formal dining, as well as a cozy kitchen dining area. All this & a desirable area!!!Restrictions: Yes
-
2005-11-03$103,000 270-char remark
Show marketing remark (270 chars)
You won't believe these hard tile floors. Absolutely Beautiful!!!! This home has a wide open floor plan and a lovely gas log fireplace in the family room. There is formal dining, as well as a cozy kitchen dining area. All this & a desirable area!!!Restrictions: Yes
-
1999-03-11soldstatus
-
1999-02-22historical
-
1999-01-21$82,500
-
1996-05-16soldstatus
-
1995-12-09$93,100
ⓘ Source: listings_history table (triggers on properties + properties_extension) + one-shot
backfill from property_details.listing_events for pre-trigger history.
Tax reassessment forecast TX · Resets to sale price
- Current annual tax
- $6,930 · $577/mo
- Projected year-2 tax
- $6,930 · $577/mo
- Expected delta
- $0/yr ($0/mo · 0.0%)
ⓘ Screening estimate from a state-policy table — verify with the county assessor before closing.
Climate risk First Street
- Flood 1/10 Low FEMA zone X (unshaded) · 0% chance over 30 yrs
- Wildfire 5/10 Major
- Heat 8/10 Severe 7 d/yr ≥110°F today · 23 d/yr by 30 yrs out
- Wind 8/10 Severe 80% chance of damaging wind over 30 yrs
- Air quality 1/10 Low 0 unhealthy d/yr today · 0 by 30 yrs out
Nearby sold comps map
Loading sold comps map…
Walkable amenities ~0.75 mi
Loading nearby amenities…
Taxation est. · year 1
- Rental income
- $24,374
- − Mortgage interest
- −$13,948
- − Property taxes
- −$6,930
- − Insurance
- −$1,245
- − Repairs & maintenance
- −$1,950
- − Management
- −$1,950
- − Depreciation
- −$7,244
- Taxable loss
- −$8,892
- Est. tax savings @ 24.0%
- +$2,134
- After-tax cash flow
- $-2,455/yr
For passive investors: Depreciation is non-cash, so a rental often shows a tax loss while cash-flowing — sheltering income. Rental losses are passive: they offset passive income freely, and up to $25,000/yr can offset ordinary (W-2) income if you actively participate and your MAGI is under $100k (phasing out to $0 by $150k); unused losses carry forward. On sale, claimed depreciation is recaptured at up to 25%, and gains may owe capital-gains tax (a 1031 exchange can defer both). Figures are a year-1 estimate at your 24.0% rate — not tax advice; consult a CPA.
Schools (NCES district)
- District
- Del Valle ISD
- NCES district ID
- 4816620
- Math proficiency
- 19% ▼ -13.00%
- Reading proficiency
- 26% ▼ -2.00%
- Median HH income
- $41,322
- Composite
- 19.13/100
- National rank
- #8830
- State rank
- #749 of 826 in TX
Livability — Austin
- Score
- 82/100
- State rank
- #16
- US rank
- #1208
Category grades
Schools grade is shown separately in the Schools card above.
Census & demographics
- Census place
- Austin, TX
- County
- Travis County · 1,299,254 people
- City population
- 1,066,854
- Metro
- Austin-Round Rock-Georgetown, TX
- Population (ZIP)
- 30,756
- Household income
- $71,640
- Rent vs Own
- Severe rent burden
- 681.0
Population outlook (Travis County) Hauer SSP2
- Today (2025)
- 1,545,133 people
- By 2030
- 1,729,269 · +11.9%
- By 2040
- 2,097,596 · +35.8%
- By 2050
- 2,463,890 · +59.5%
- By 2075
- 3,249,374 · +110.3%
- By 2100
- 3,801,868 · +146.1%
Race, ethnicity, and origin ACS 2023
- Neighborhood character
- Predominantly Hispanic (75%)
- Race & ethnicity
- Hispanic / Latino 75% Two or more races 33% White 16% Black 6% Asian 1%
- Hispanic origin (detail)
- Mexican 68% Puerto Rican 1%
- Common ancestry
- Romanian 1%
- Foreign-born
- 26% · Canada
- Languages at home
- 41% English-only · Spanish 57% Other Asian/Pacific 1%
Political lean MEDSL · Travis
- 2024 margin
- Solid D (+39.3) · D 68.8% · R 29.4% · Other 1.8%
- 2008→2024 swing
- +9.9pp toward D · 2008: 29.4pp · 2024: 39.3pp
- All cycles
- 2024: D+39.3 2020: D+45.0 2016: D+38.9 2012: D+23.9 2008: D+29.4
Not yet ingested
- Civics
- —
Market trends
- HPI YoY
- ▼ -3.24%
- Current HPI
- 192.3518
- Rent YoY
- ▼ -0.36%
- Metro
- Austin-Round Rock-Georgetown, TX
- State GDP YoY
- ▲ 3.95%
- F500 in state
- 110
Industry mix (Fortune 500 HQ in TX)
| Industry | F500 HQs | Revenue |
|---|---|---|
| Energy | 16 | $1,198B |
|
||
| Technology | 5 | $198B |
|
||
| Engineering / Construction | 4 | $72B |
|
||
| Energy Services | 3 | $60B |
|
||
| Utilities | 3 | $41B |
|
||
| Healthcare | 2 | $330B |
|
||
Price history
+167.5% since first listed13 events — show timeline
- 2026-04-28 Price Changed $249,000 Unlock MLS
- 2026-03-15 Price Changed $259,000 Unlock MLS
- 2026-03-04 Price Changed $289,990 Unlock MLS
- 2026-02-14 Listed $339,000 Unlock MLS
- 2006-04-24 Sold (MLS) — Unlock MLS
- 2006-03-20 Sold (Public Records) — Public Records
- 2006-02-08 Delisted — Unlock MLS
- 2005-11-03 Listed $103,000 Unlock MLS
- 1999-03-11 Sold (MLS) — Unlock MLS
- 1999-02-22 Delisted — Unlock MLS
- 1999-01-21 Listed $82,500 Unlock MLS
- 1996-05-16 Sold (MLS) — Unlock MLS
- 1995-12-09 Listed $93,100 Unlock MLS
Property tax history
+4.4%/yrLatest (2026): $6,930 · +10.0% YoY. Source: county tax records.
Cash-flow waterfall
monthlySold comps — $/sqft
last 12 mo · ≤1 miLoading sold comps…