 Duplex
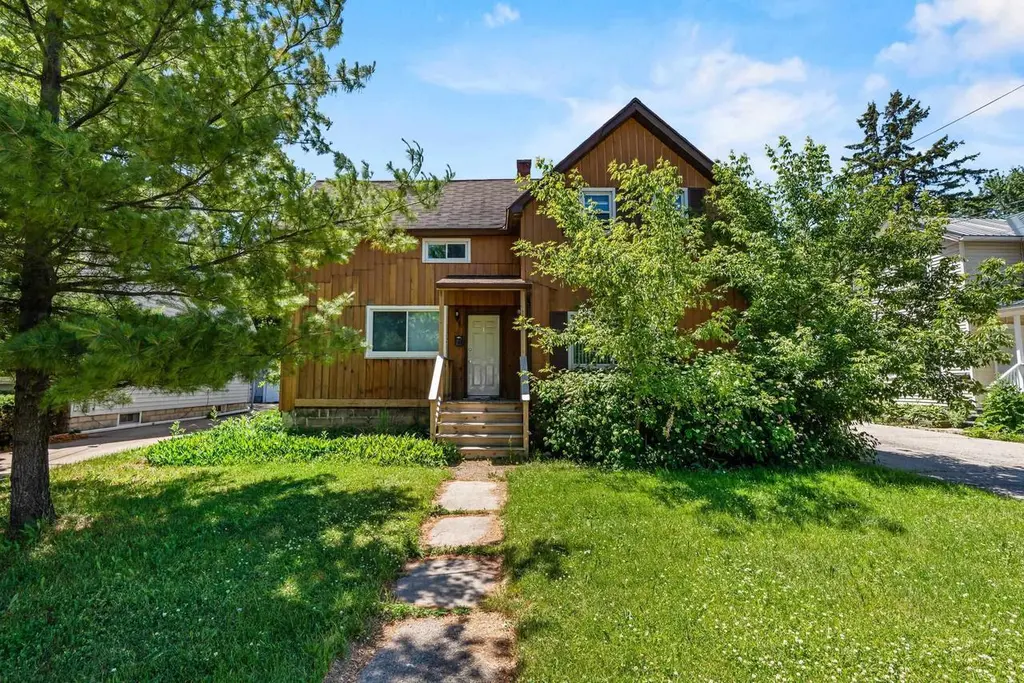
1427 W College Ave · Appleton, WI
Flood risk 1/10 · Minimal
- FEMA flood zone
- X (unshaded)
- Chance of flooding over 30 yrs
- 0.0%
- Est. flood insurance / yr
- $473 – $860
Fire risk 1/10 · Minimal
- Est. fire insurance / yr
- $636 – $1,182
Heat risk 2/10 · Minimal
- Hot days now (above 97°F)
- 7 days/yr
- Hot days in 30 yrs
- 12 days/yr
Wind risk 2/10 · Minimal
- Chance of severe wind over 30 yrs
- —
Air-quality risk 3/10 · Minor
- Unhealthy air days now
- 2 days/yr
- Unhealthy air days in 30 yrs
- 3 days/yr
Risk factors via First Street. Map © Google.
Why this score? — see what drove the C+ grade
The composite is a weighted blend of 9 inputs, each scored 0–100. Each bar is that input's sub-score; the figure is the points it added to the 100-point composite (weight × sub-score).
- Cash flow +27.4/30.0
- DSCR +9.6/10.0
- 1% rule +7.1/10.0
- ARV discount +6.4/15.0
- Rent growth +4.4/5.0
- Livability +4.1/5.0
- Schools +3.0/10.0
- Condition / age +2.5/5.0
- Appreciation +0.0/10.0
$229,900
🖨 Deal sheet (PDF) 📄 Offer letter ✓ Due diligence
Multi-family units
County records classify this as Multi-Family (2-4 Unit). Listing-text estimate: 2 units. confirmed
Listing remarks
Excellent duplex opportunity in Appleton! Conveniently located near parks, schools, restaurants, and downtown Appleton, this property offers easy access to many local amenities and attractions. Whether you're looking to expand your investment portfolio or explore owner-occupancy options, this duplex presents outstanding potential. Each unit features 2 bedrooms and a 1 bathroom. Property includes a detached 1-car garage. With functional layouts and opportunities to add value over time, this property is ready for its next owner. Don't miss your chance to own a versatile property in a convenient Appleton location. Also available with 1633 Weiland Ln & 706 Hawthorne Dr in Appleton. Open h
Key facts
- Versatile property
- Local amenities
- Duplex opportunity
Tags
Property features AI
Finance
- Other: Two-unit building (each unit approx. 770 sq. ft.); Inclusions: 2 refrigerators, 2 oven/ranges, 2 dishwashers, 1 washer and dryer; Exclusions: Seller/tenant personal property
Exterior
- Parking: Outside parking
- Utilities: Municipal water; Municipal sewer; Natural gas
- Home design: 1.5-story multi-family property; Estimated total finished living area between 1,501 and 1,750 square feet
- Construction: Information source lists year built as public/assessor record
- Exterior features: Stone and wood exterior; Porch; Lot is approximately 0.17 acres (under 1/2 acre); Zoned residential
Interior
- Kitchen: Unit 2 kitchen approx. 11 x 10; Two oven/ranges; Two dishwashers; Two refrigerators
- Bedrooms: Unit 1: 2 bedrooms; Unit 2: 2 bedrooms (master approx. 15 x 7; second bedroom approx. 8 x 12)
- Bathrooms: Unit 1: 1 full bath; Unit 2: 1 full bath
- Heating & cooling: Natural gas heating
- Interior features: Full basement with block walls and poured concrete; Porch
- Laundry & utility: Washer and dryer included
Neighborhood map
What this means for you Summary
Snapshot
- This is a 2 × 2-bed/1.0-bath units multifamily listed at $230k.
Deal economics
- At list price, monthly cash flow is $671 ($8k/yr) — positive. Per door: $335/mo.
- The deal already cash-flows at list — no discount required.
- Meets the 1% rule at list price ($3k rent vs $230k).
- Cap rate 9.8% vs local median 3.8% in Appleton — top-decile yield for the area; either an underpriced asset or a hidden risk that comps aren't pricing in. Stress-test before assuming the spread holds.
Location & tenants
- Location reads 82/100 on livability (#44 in WI, #1,073 nationally) — a professional / high-income tenant draw. Strengths: commute A+, cost of living A+, housing A+; Watch: amenities C-.
- Appleton Area School District (urban): math 33% / reading 36% proficiency, ranked #224 of 342 in WI (top 66%) — families likely to look elsewhere, expect single-tenant / working-renter base with shorter leases.
- Zoned schools: Jefferson Elementary (math 27% / reading 22%, grade F, #783 of 1,041 statewide, top 79%, 273 students, 65% FRL); Wilson Middle (math 14% / reading 24%, grade F, #354 of 383 statewide, top 93%, 364 students, 62% FRL); West High (math 19% / reading 27%, grade F, #343 of 483 statewide, top 72%, 1,157 students, 53% FRL) — zoned schools average 60% FRL vs 32% district-wide (28 pts higher); higher-poverty schools than district average — tighter screening recommended.
- Zoned-school proficiency averages 22% at this address vs 34% district-wide (-12 pts) — the specific schools serving this property underperform the Appleton Area School District average; the district grade overstates school quality for this exact location.
- Market conditions: Rents rising fast (+7.8%/yr); 52 active listings in the ZIP; 9 comparable units currently listed for rent nearby; rentals at typical pace (median 23d on market — plan ~3-4 weeks tenant-placement turnaround); solid renter incomes; 460 units permitted in Outagamie County in 2024 (30 in 5+ unit buildings).
- This rent runs 42% of the median local income ($80k/yr) — at the standard rent-burdened threshold; future hikes will face affordability resistance.
Forward outlook
- Local home prices are declining (-3.0%/yr); year-one equity from $2k of loan paydown is wiped out by about $7k of value loss. Plan a longer hold.
- Outagamie County population projected at +8% by 2050 — modest demand growth; plan on rents tracking national, not racing it.
- At projected returns (-3.0% appreciation + 7.8% rent growth), your $64k cash investment doubles in ~7 years — after that, you're playing with house money.
Negotiation context
- Only 3 days on market — expect competitive offers; lowballing is unlikely to land.
- 2 sale attempts since 2y ago with the ask held roughly flat each time — persistent listings suggest the price (not the market) is what's stuck; bring a comps-based counter.
- Current owner paid $130k; list at $230k implies a 77% gain — meaningful room to come down on a strong offer.
Risks & watch-outs
- Watch-outs: built in 1891 — expect roof / HVAC / electrical / plumbing capex.
Questions for the listing agent
- Can we see the unit-by-unit rent roll, current vacancy, and any below-market leases? What's the average tenancy length?
- What capital expenditures (roof, boiler, parking lot, exteriors) have been made in the last 5 years, and what's planned in the next 2?
- Built in 1891 — when were the roof, HVAC, electrical panel, plumbing, and water heater last replaced?
- Is there a deadline driving the sale (1031 exchange, divorce, estate, relocation)? That informs how much negotiation room exists.
- What's the average days-on-market for RENTAL listings here right now (not sales)? A rising rental-DOM trend means longer vacancies and softer asking-rent achievability than the comps imply.
- What's the recent tenant-quality profile in this submarket — average credit score on applications, eviction rate, late-payment / NSF rate, and stable-employment percentage? A property-management company in the area should have these aggregated.
- How much new apartment / multifamily construction is in the pipeline within 1–3 miles? Heavy new supply (>2% of stock underway) typically softens rents 12–24 months out; light construction supports rent growth.
Investment metrics
- 1% rule
- 1.21% ✓
- Cap rate
- 9.79%
- Cash-on-cash
- 12.50%
- DSCR
- 1.56
- GRM
- 6.9
CMA / ARV
- ARV (on-the-fly)
- $224,616
- Comps found
- 6
Show comp detail 6 sales within ~0.75 mi
| Address | Dist | Beds/Ba | Sqft | Sold | Price | $/sf | Match |
|---|---|---|---|---|---|---|---|
| 1219 W Packard St | 0.36mi | 4/2.0 | 1,632 (+7%) | 1mo | $290,700 | $178 | 71 |
| 324 N Outagamie St | 0.23mi | 4/2.0 | 1,512 (-1%) | 22mo | $215,000 | $142 | 69 |
| 1224 W Spencer St | 0.29mi | 3/2.0 (-1) | 1,638 (+7%) | 12mo | $240,000 | $147 | 59 |
| 1342 W Spencer St | 0.21mi | 4/2.0 | 1,402 (-8%) | 22mo | $206,500 | $147 | 58 |
| 840 W 5th St | 0.59mi | 3/2.0 (-1) | 1,432 (-6%) | 1mo | $165,000 | $115 | 56 |
| 931 W Franklin St | 0.47mi | 5/2.0 (+1) | 1,664 (+9%) | 17mo | $220,000 | $132 | 44 |
Match score weights: distance 35% · size 25% · config 20% · recency 20%. Top-matched comps best support the ARV.
Projected returns pro-forma
-3.0% appreciation · 7.77% rent growth · sell at horizon
- IRR
- 7.3%
- Equity multiple
- 1.30×
- Total profit
- $19,446
- Equity at exit
- $34,279
- IRR
- 20.4%
- Equity multiple
- 3.10×
- Total profit
- $135,248
- Equity at exit
- $19,878
Cash invested: $64,372 (down + closing). Projections, not guarantees.
Landlord ↔ Tenant lean methodology
- Overall (STATE)
- 73 Landlord-Friendly
- State Wisconsin
- 73 Landlord-Friendly · R+2
- County
- — inherits STATE
- City
- — inherits STATE
ZIP-level market 54914
- Rents YoY
- 7.8%
- Active inventory
- 52
- Price-to-rent
- 13.8×
Monthly cashflow live
- Estimated rent
- $2,778 high interval (Pro) →
- Mortgage (P&I)
- −$1,206
- Tax from tax record
- −$222 /mo · $2,669/yr
- Insurance
- −$96
- HOA
- −$0
- Vacancy / Maint / Mgmt
- −$583
- Net cashflow
- $671
Break-even live
Sensitivity live
| Price | -10% $801 | -5% $736 | +0% $671 | +5% $606 | +10% $541 |
|---|---|---|---|---|---|
| Rent | -10% $451 | -5% $561 | +0% $671 | +5% $781 | +10% $890 |
| Rate | -1.0pp $787 | -0.5pp $729 | base $671 | +0.5pp $611 | +1.0pp $551 |
2-unit breakdown (identical units grouped — click to expand)
| Units | Beds | Baths | Est. rent |
|---|---|---|---|
| 2× units | 2 | 1 | $2,778 |
| #1 | 2 | 1 | $1,389 |
| #2 | 2 | 1 | $1,389 |
| Total (2 units) | $2,778 | ||
UW: 25.0% down · 7.5% · 30yr · 1.5% tax · 5.0% vac · 8.0% maint · 8.0% mgmt
Financing live
Cash to close
- Down payment
- $57,475
- Closing costs
- $6,897
- Reserves months
- —
- Total cash needed
- —
Loan-product check · same deal, 3 products live
Conventional
25% down · 7.5% · 30yr
- Down + closing
- —
- Monthly P&I
- —
- Monthly cashflow
- —
- DSCR
- —
- Eligible?
- —
Personal DTI + credit; lowest rate.
DSCR
20% down · 8.5% · 30yr
- Down + closing
- —
- Monthly P&I
- —
- Monthly cashflow
- —
- DSCR
- —
- Eligible?
- —
No personal income docs; deal must DSCR.
Hard money
10% down · 12.0% · 12mo
- Down + closing
- —
- Monthly P&I
- —
- Monthly cashflow
- —
- DSCR
- —
- Eligible?
- —
Short-term bridge; refi at stabilization.
Rent comps 9 comps
| Address | Beds | Baths | Sqft | Rent | $/sqft | DOM | Units | Dist |
|---|---|---|---|---|---|---|---|---|
| 217 S Badger Ave Unit 1387451P Appleton, WI | 3.0 | 2.0 | 1194 | $3,470 | $2.91 | 15d | 1 | 0.54mi |
| 826 W Elsie St Appleton, WI | 4.0 | 2.0 | 1328 | $1,800 | $1.36 | 22d | 1 | 0.65mi |
| 1115 N Mason St Appleton, WI | 3.0 | 2.0 | 1664 | $1,495 | $0.90 | 15d | 1 | 0.69mi |
| 609 S State St Unit 1061651P Appleton, WI | 4.0 | 2.5 | 1593 | $3,236 | $2.03 | 45d | 1 | 0.82mi |
| 806 N Richmond St Appleton, WI | 4.0 | 1.5 | 1260 | $2,695 | $2.14 | 22d | 1 | 0.83mi |
| 634 W Prospect Ave Appleton, WI | 4.0 | 2.0 | 2200 | $2,000 | $0.91 | 45d | 1 | 0.85mi |
| 517 N Morrison St Appleton, WI | 3.0 | 1.5 | 1400 | $1,495 | $1.07 | 15d | 1 | 1.24mi |
| 1500 Palisades Dr Unit 1061611P Appleton, WI | 3.0 | 2.0 | 1496 | $6,793 | $4.54 | 15d | 1 | 1.33mi |
| 320 E College Ave Unit 307 Appleton, WI | 3.0 | 2.0 | 1525 | $2,500 | $1.64 | 45d | 1 | 1.34mi |
Listing history 3 events
-
2026-06-22days on market $229,900 Active 3 DOM
-
2026-06-19remarks 695-char remark
-
2026-06-19$229,900 Active 1 DOM
ⓘ Source: listings_history table (triggers on properties + properties_extension) + one-shot
backfill from property_details.listing_events for pre-trigger history.
Tax reassessment forecast WI · Partial reset (capped growth)
- Current annual tax
- $2,669 · $222/mo
- Projected year-2 tax
- $3,461 · $288/mo
- Expected delta
- +$792/yr (+$66/mo · 29.7%)
ⓘ Screening estimate from a state-policy table — verify with the county assessor before closing.
Climate risk First Street
- Flood 1/10 Low FEMA zone X (unshaded) · 0% chance over 30 yrs
- Wildfire 1/10 Low
- Heat 2/10 Low 7 d/yr ≥97°F today · 12 d/yr by 30 yrs out
- Wind 2/10 Low
- Air quality 3/10 Moderate 2 unhealthy d/yr today · 3 by 30 yrs out
Nearby sold comps map
Loading sold comps map…
Walkable amenities ~0.75 mi
Loading nearby amenities…
Taxation est. · year 1
- Rental income
- $33,336
- − Mortgage interest
- −$12,878
- − Property taxes
- −$2,669
- − Insurance
- −$1,150
- − Repairs & maintenance
- −$2,667
- − Management
- −$2,667
- − Depreciation
- −$6,688
- Taxable income
- $4,618
- Est. tax owed @ 24.0%
- −$1,108
- After-tax cash flow
- $6,941/yr
For passive investors: Depreciation is non-cash, so a rental often shows a tax loss while cash-flowing — sheltering income. Rental losses are passive: they offset passive income freely, and up to $25,000/yr can offset ordinary (W-2) income if you actively participate and your MAGI is under $100k (phasing out to $0 by $150k); unused losses carry forward. On sale, claimed depreciation is recaptured at up to 25%, and gains may owe capital-gains tax (a 1031 exchange can defer both). Figures are a year-1 estimate at your 24.0% rate — not tax advice; consult a CPA.
Schools (NCES district)
- District
- Appleton Area School District
- NCES district ID
- 5500390
- Math proficiency
- 33% ▼ -6.00%
- Reading proficiency
- 36% ▼ -1.00%
- Median HH income
- $53,892
- Composite
- 30.3/100
- National rank
- #6279
- State rank
- #224 of 342 in WI
Livability — Appleton
- Score
- 82/100
- State rank
- #44
- US rank
- #1073
Category grades
Schools grade is shown separately in the Schools card above.
Census & demographics
- Census place
- Appleton, WI
- County
- Outagamie County · 155,051 people
- City population
- 126,671
- Metro
- Appleton, WI
- Population (ZIP)
- 31,849
- Household income
- $79,875
- Rent vs Own
- Severe rent burden
- 744.0
Population outlook (Outagamie County) Hauer SSP2
- Today (2025)
- 195,863 people
- By 2030
- 201,154 · +2.7%
- By 2040
- 209,053 · +6.7%
- By 2050
- 211,957 · +8.2%
- By 2075
- 214,299 · +9.4%
- By 2100
- 200,825 · +2.5%
Race, ethnicity, and origin ACS 2023
- Neighborhood character
- Predominantly White (79%)
- Race & ethnicity
- White 79% Hispanic / Latino 9% Two or more races 8% Asian 5% Black 2%
- Hispanic origin (detail)
- Mexican 7%
- Common ancestry
- Romanian 6% Portuguese 4% Iranian 4%
- Foreign-born
- 7% · Canada
- Languages at home
- 88% English-only · Spanish 7% Other Asian/Pacific 3% German/W. Germanic 1%
Political lean MEDSL · Outagamie
- 2024 margin
- R (+10.2) · D 44.2% · R 54.4% · Other 1.5%
- 2008→2024 swing
- -21.8pp toward R · 2008: 11.6pp · 2024: -10.2pp
- All cycles
- 2024: R+10.2 2020: R+9.9 2016: R+12.6 2012: R+1.8 2008: D+11.6
Not yet ingested
- Civics
- —
Market trends
- HPI YoY
- ▼ -213.81%
- Current HPI
- 214.5939
- Rent YoY
- ▲ 7.77%
- Metro
- Appleton, WI
- State GDP YoY
- ▲ 2.10%
- F500 in state
- 20
Industry mix (Fortune 500 HQ in WI)
| Industry | F500 HQs | Revenue |
|---|---|---|
| Industrial Machinery | 4 | $23B |
|
||
| Industrial Technology | 2 | $36B |
|
||
| Insurance | 1 | $36B |
|
||
| Professional Services | 1 | $19B |
|
||
| Utilities | 1 | $9B |
|
||
| Consumer Goods | 1 | $3B |
|
||
Price history
+117.7% since first listed6 events — show timeline
- 2026-06-17 Listed $229,900 RANW
- 2024-05-18 Rental Removed $825 APPFOLIO
- 2024-04-23 Listed for Rent $825 APPFOLIO
- 2022-08-21 Price Changed $850 RENT.
- 2018-01-22 Sold (Public Records) $130,000 Public Records
- 2005-08-17 Sold (Public Records) $105,600 Public Records
Property tax history
+1.7%/yrLatest (2025): $2,669 · +5.9% YoY. Source: county tax records.
Cash-flow waterfall
monthlySold comps — $/sqft
last 12 mo · ≤1 miLoading sold comps…