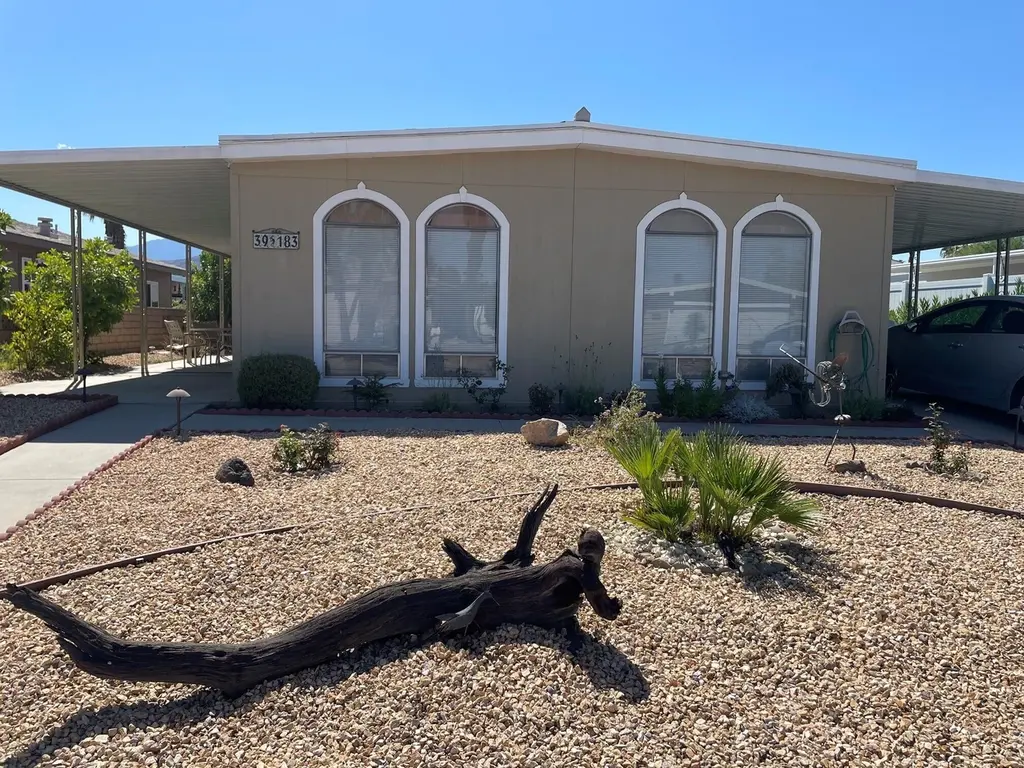
39183 Warm Springs Dr · Palm Desert, CA
Flood risk 1/10 · Minimal
- FEMA flood zone
- X (unshaded)
- Chance of flooding over 30 yrs
- 0.0%
- Est. flood insurance / yr
- $507 – $1,088
Fire risk 1/10 · Minimal
- Est. fire insurance / yr
- $659 – $1,223
Heat risk 9/10 · Severe
- Hot days now (above 114°F)
- 7 days/yr
- Hot days in 30 yrs
- 19 days/yr
Wind risk 1/10 · Minimal
- Chance of severe wind over 30 yrs
- —
Air-quality risk 4/10 · Minor
- Unhealthy air days now
- 5 days/yr
- Unhealthy air days in 30 yrs
- 7 days/yr
Risk factors via First Street. Map © Google.
Why this score? — see what drove the B+ grade
The composite is a weighted blend of 9 inputs, each scored 0–100. Each bar is that input's sub-score; the figure is the points it added to the 100-point composite (weight × sub-score).
- Cash flow +30.0/30.0
- ARV discount +15.0/15.0
- 1% rule +10.0/10.0
- DSCR +10.0/10.0
- Schools +3.8/10.0
- Rent growth +2.9/5.0
- Livability +2.6/5.0
- Condition / age +2.5/5.0
- Appreciation +0.0/10.0
$200,000
🖨 Deal sheet 📄 Offer letter ✓ Due diligence
Listing remarks
This is not an Arms-length transaction. It is a sale to a family member and put into the MLS for agency requirements. The home is in fairly nice condition with a few repairs recommended.
Key facts
- 3,920 sq ft lot
- Garage
- Community pool
Property features AI
Finance
- Other: Community features include golf course within development and pickleball courts; Pool and heated in-ground spa available in the community; Disclosures: CC&R, pet restrictions, property sold as-is, HOA disclosures; Some pieces of furniture included (no value)
- Financial info: Sale terms: cash; Possession at close of escrow; Will not consider lease; Short-term rentals not allowed
- HOA & community: HOA exists with monthly fees; Association fee: $400 monthly; HOA amenities include clubhouse, golf course, fitness center, and security; Space rent includes HOA fee
Exterior
- Parking: Total of 6 parking spaces; 2 covered spaces; 2 carport spaces; 2 uncovered/assigned spaces; Tandem parking
- Security: Gated community; Community security included
- Utilities: Sewer connected and paid; PUD: yes
- Home design: Double-wide manufactured home (Royal Chateau); Single-story, ground level with no unit above; Model name: Lancer; Entry level: living room
- Construction: Built in 1973 (manufacture date 01/01/1973); Pier jacks foundation; Double wide mobile/manufactured construction
- Exterior features: Awning-covered patio; Community security; Close to clubhouse; Street lights; Front door faces west; Mountain views; Detached property
Interior
- Flooring: Carpet flooring
- Bathrooms: 2 full bathrooms
- Heating & cooling: Propane gas heating with forced air; Air conditioning
- Interior features: Shutters on windows; Entry opens to the living room; Furnished
- Laundry & utility: Laundry area
Neighborhood map
What this means for you Summary
Snapshot
- This is a 2-bed/2.0-bath manufactured listed at $200k.
Deal economics
- At list price, monthly cash flow is $1k ($18k/yr) — positive.
- The deal already cash-flows at list — no discount required.
- Meets the 1% rule at list price ($4k rent vs $200k).
- Cap rate 15.1% vs local median 3.5% in Palm Desert — top-decile yield for the area; either an underpriced asset or a hidden risk that comps aren't pricing in. Stress-test before assuming the spread holds.
Location & tenants
- Location reads 51/100 on livability (#1,050 in CA) — a working-class tenant base; expect higher turnover. Strengths: schools A-, employment B+, housing B; Watch: crime D, amenities F, commute F.
- Desert Sands Unified (suburban): math 31% / reading 56% proficiency, ranked #199 of 517 in CA (top 38%) — families likely to look elsewhere, expect single-tenant / working-renter base with shorter leases.
- Market conditions: Rents rising (+1.6%/yr); 545 active listings in the ZIP; 40 comparable units currently listed for rent nearby; rentals lingering (median 44d on market — plan ~5-8 weeks vacancy on turnover, expect pricing pressure); 72% of comp listings sitting > 30 days — soft ceiling on asking rent; 9,195 units permitted in Riverside County in 2024 (1,512 in 5+ unit buildings).
- At $3,934/mo this rent would consume 67% of the median local household income ($70k/yr) (locally 1734% of renters already pay >50% of income on rent) — very limited rent-growth headroom before tenants either downsize or default.
Forward outlook
- Local home prices are declining (-3.0%/yr); year-one equity from $1k of loan paydown is wiped out by about $6k of value loss. Plan a longer hold.
- Riverside County population projected at +22% by 2050 — long-run rental-demand tailwind backs the buy-and-hold thesis.
- At projected returns (-3.0% appreciation + 1.6% rent growth), your $56k cash investment doubles in ~5 years — after that, you're playing with house money.
Negotiation context
- Only 14 days on market — expect competitive offers; lowballing is unlikely to land.
- 2 sale attempts since 27y ago with the ask held roughly flat each time — persistent listings suggest the price (not the market) is what's stuck; bring a comps-based counter.
- Current owner paid $40k; list at $200k implies a 400% gain — meaningful room to come down on a strong offer.
Risks & watch-outs
- Climate carrying-cost: extreme-heat days projected 7→19/yr by 2055 (HVAC capex compounding) — expect insurance premiums to compound above CPI over the hold.
Questions for the listing agent
- Built in 1974 — when were the roof, HVAC, electrical panel, plumbing, and water heater last replaced?
- What does the HOA fee cover, when was the last increase, and are there any pending special assessments or reserve-fund shortfalls?
- Is there a deadline driving the sale (1031 exchange, divorce, estate, relocation)? That informs how much negotiation room exists.
- Schools are A-rated — typically a magnet for longer-tenancy family renters. What's the average tenant stay here, and is there a school-zone premium baked into asking?
- Crime grade is D in this area — have there been break-ins, vandalism, or insurance claims at this property in the last 3 years? What carrier currently insures it and at what premium?
- What's the average days-on-market for RENTAL listings here right now (not sales)? A rising rental-DOM trend means longer vacancies and softer asking-rent achievability than the comps imply.
- What's the recent tenant-quality profile in this submarket — average credit score on applications, eviction rate, late-payment / NSF rate, and stable-employment percentage? A property-management company in the area should have these aggregated.
- How much new for-sale + rental construction is in the pipeline within 1–3 miles? Heavy new supply typically softens prices + rents 12–24 months out; constrained supply supports both.
Investment metrics
- 1% rule
- 1.97% ✓
- Cap rate
- 15.06%
- Cash-on-cash
- 31.32%
- DSCR
- 2.39
- GRM
- 4.2
CMA / ARV
- ARV (on-the-fly)
- $260,640
- Comps found
- 12
Show comp detail 12 sales within ~0.75 mi
| Address | Dist | Beds/Ba | Sqft | Sold | Price | $/sf | Match |
|---|---|---|---|---|---|---|---|
| 39183 Warm Springs Dr | 0.00mi | 2/2.0 | 1,440 (0%) | 0mo | $200,000 | $139 | 100 |
| 39832 Black Mesa Ln | 0.37mi | 2/2.0 | 1,440 (0%) | 0mo | $260,000 | $181 | 82 |
| 73450 Country Club Dr #75 | 0.35mi | 2/2.0 | 1,440 (0%) | 3mo | $190,000 | $132 | 81 |
| 73651 Adobe Dr | 0.28mi | 2/2.0 | 1,488 (+3%) | 1mo | $199,000 | $134 | 81 |
| 38430 Desert Greens Dr E | 0.41mi | 2/2.0 | 1,440 (0%) | 3mo | $325,000 | $226 | 78 |
| 73171 Cabazon Peak Dr | 0.47mi | 2/2.0 | 1,440 (0%) | 1mo | $230,000 | $160 | 77 |
| 73450 Country Club Dr #309 | 0.32mi | 3/2.0 (+1) | 1,344 (-7%) | 2mo | $165,000 | $123 | 68 |
| 38703 Desert Greens Dr E | 0.28mi | 2/2.0 | 1,248 (-13%) | 0mo | $322,000 | $258 | 65 |
| 38668 Fawn Springs Dr | 0.28mi | 3/2.5 (+1) | 1,600 (+11%) | 0mo | $410,000 | $256 | 61 |
| 73450 Country Club Dr #87 | 0.32mi | 3/2.0 (+1) | 1,636 (+14%) | 1mo | $222,500 | $136 | 56 |
| 38401 Desert Greens Dr W | 0.69mi | 2/2.0 | 1,344 (-7%) | 1mo | $250,000 | $186 | 56 |
| 73165 Desert Greens Dr N | 0.69mi | 2/2.0 | 1,344 (-7%) | 3mo | $286,000 | $213 | 54 |
Match score weights: distance 35% · size 25% · config 20% · recency 20%. Top-matched comps best support the ARV.
Projected returns pro-forma
-3.0% appreciation · 1.6% rent growth · sell at horizon
- IRR
- 24.5%
- Equity multiple
- 1.99×
- Total profit
- $55,438
- Equity at exit
- $29,821
- IRR
- 31.4%
- Equity multiple
- 3.63×
- Total profit
- $147,241
- Equity at exit
- $17,292
Cash invested: $56,000 (down + closing). Projections, not guarantees.
Landlord ↔ Tenant lean methodology
- Overall (STATE)
- 18 Strongly Tenant-Friendly
- State California
- 18 Strongly Tenant-Friendly · D+13
- County
- — inherits STATE
- City
- — inherits STATE
ZIP-level market 92260
- Rents YoY
- 1.6%
- Active inventory
- 545
- Price-to-rent
- 4.2×
Monthly cashflow live
- Estimated rent
- $3,934 high interval (Pro) →
- Mortgage (P&I)
- −$1,049
- Tax from tax record
- −$114 /mo · $1,368/yr
- Insurance
- −$83
- HOA
- −$400
- Vacancy / Maint / Mgmt
- −$826
- Net cashflow
- $1,462
Break-even live
UW: 25.0% down · 7.5% · 30yr · 1.5% tax · 5.0% vac · 8.0% maint · 8.0% mgmt
Financing live
Cash to close
- Down payment
- $50,000
- Closing costs
- $6,000
- Reserves months
- —
- Total cash needed
- —
Loan-product check · same deal, 3 products live
Conventional
25% down · 7.5% · 30yr
- Down + closing
- —
- Monthly P&I
- —
- Monthly cashflow
- —
- DSCR
- —
- Eligible?
- —
Personal DTI + credit; lowest rate.
DSCR
20% down · 8.5% · 30yr
- Down + closing
- —
- Monthly P&I
- —
- Monthly cashflow
- —
- DSCR
- —
- Eligible?
- —
No personal income docs; deal must DSCR.
Hard money
10% down · 12.0% · 12mo
- Down + closing
- —
- Monthly P&I
- —
- Monthly cashflow
- —
- DSCR
- —
- Eligible?
- —
Short-term bridge; refi at stabilization.
Rent comps 40 comps
| Address | Beds | Baths | Sqft | Rent | $/sqft | DOM | Units | Dist |
|---|---|---|---|---|---|---|---|---|
| 73843 Line Canyon Ln Palm Desert, CA | 2.0 | 2.0 | 1570 | $2,100 | $1.34 | 11d | 1 | 0.28mi |
| 73639 Cabazon Peak Dr Palm Desert, CA | 2.0 | 2.0 | 1717 | $2,400 | $1.40 | 43d | 1 | 0.30mi |
| 73450 Country Club Dr #120 Palm Desert, CA | 2.0 | 2.0 | 1856 | $2,995 | $1.61 | 11d | 1 | 0.30mi |
| 38520 Poppet Canyon Dr Palm Desert, CA | 2.0 | 2.0 | 1392 | $3,700 | $2.66 | 43d | 1 | 0.36mi |
| 4162 Via Mattina Palm Desert, CA | 2.0 | 2.0 | 1867 | $2,950 | $1.58 | 12d | 1 | 0.40mi |
| 38250 Azalea Dr Palm Desert, CA | 2.0 | 2.0 | 1806 | $5,500 | $3.05 | 43d | 1 | 0.48mi |
| 2701 Via Calderia Palm Desert, CA | 2.0 | 2.0 | 1559 | $2,850 | $1.83 | 24d | 1 | 0.49mi |
| 248 Strada Fortuna Palm Desert, CA | 2.0 | 2.0 | 1400 | $2,500 | $1.79 | 43d | 1 | 0.53mi |
| 73075 Buck Springs Dr Palm Desert, CA | 2.0 | 2.0 | 1440 | $1,950 | $1.35 | 43d | 1 | 0.54mi |
| 1803 Via San Martino Palm Desert, CA | 2.0 | 2.0 | 1559 | $3,900 | $2.50 | 43d | 1 | 0.56mi |
| 73373 Country Club Dr Palm Desert, CA | 1.0–2.0 | 1.0–2.0 | 852 | $2,165 | $2.54 | 43d | 1 | 0.58mi |
| 40064 Silktree Ct Palm Desert, CA | 3.0 | 2.0 | 1712 | $3,200 | $1.87 | 24d | 1 | 0.62mi |
| 41517 Armanac Ct Palm Desert, CA | 3.0 | 2.0 | 1537 | $3,400 | $2.21 | 3d | 1 | 0.68mi |
| 40445 Portola Ave Palm Desert, CA | 1.0–2.0 | 1.0–2.0 | 975 | $3,215 | $3.30 | 5d | 15 | 0.71mi |
| 73750 Calle Bisque Palm Desert, CA | 3.0 | 2.0 | 1537 | $6,500 | $4.23 | 43d | 1 | 0.71mi |
| 8 Las Cruces Ln Palm Desert, CA | 2.0 | 2.0 | 1705 | $5,000 | $2.93 | 43d | 1 | 0.73mi |
| 40255 Sagewood Dr Palm Desert, CA | 3.0 | 2.0 | 1712 | $3,300 | $1.93 | 18d | 1 | 0.75mi |
| 74300 Country Club Dr Unit 366 Palm Desert, CA | 2.0 | 2.0 | 1140 | $7,170 | $6.29 | 43d | 1 | 0.78mi |
| 74300 Country Club Dr Apt 5001 Palm Desert, CA | 2.0 | 2.0 | 1099 | $7,120 | $6.48 | 43d | 1 | 0.78mi |
| 37772 Hollister Dr Palm Desert, CA | 3.0 | 2.0 | 1271 | $3,200 | $2.52 | 43d | 1 | 0.79mi |
| 4 Hermosillo Ln Palm Desert, CA | 2.0 | 2.0 | 1572 | $2,900 | $1.84 | 18d | 1 | 0.79mi |
| 1 Marbella Ln Palm Desert, CA | 2.0 | 2.0 | 1080 | $4,500 | $4.17 | 43d | 1 | 0.87mi |
| 191 Winterhaven Cir Palm Desert, CA | 2.0 | 1.5 | 1250 | $2,800 | $2.24 | 43d | 1 | 0.89mi |
| 166 Wimbledon Ct Palm Desert, CA | 2.0 | 2.0 | 1250 | $3,200 | $2.56 | 43d | 1 | 0.91mi |
| 323 San Remo St Palm Desert, CA | 2.0 | 2.0 | 1556 | $8,500 | $5.46 | 43d | 1 | 0.95mi |
| 255 San Remo St Palm Desert, CA | 2.0 | 2.0 | 1656 | $6,600 | $3.99 | 43d | 1 | 0.96mi |
| 150 Willow Lake Dr Palm Desert, CA | 2.0 | 2.0 | 1138 | $2,500 | $2.20 | 43d | 1 | 0.96mi |
| 336 Villena Way Palm Desert, CA | 2.0 | 2.0 | 1303 | $5,500 | $4.22 | 43d | 1 | 0.99mi |
| 217 Las Lomas Palm Desert, CA | 2.0 | 2.0 | 1656 | $6,300 | $3.80 | 43d | 1 | 1.00mi |
| 205 Las Lomas Palm Desert, CA | 2.0 | 2.0 | 1457 | $6,000 | $4.12 | 43d | 1 | 1.01mi |
| 363 San Remo St Palm Desert, CA | 2.0 | 2.0 | 1656 | $7,500 | $4.53 | 43d | 1 | 1.02mi |
| 365 San Remo St Palm Desert, CA | 2.0 | 2.0 | 1303 | $5,500 | $4.22 | 43d | 1 | 1.03mi |
| 337 Villena Way Palm Desert, CA | 2.0 | 2.0 | 1303 | $5,000 | $3.84 | 43d | 1 | 1.03mi |
| 206 Lakecrest Ln Palm Desert, CA | 2.0 | 2.0 | 1138 | $2,300 | $2.02 | 11d | 1 | 1.04mi |
| 311 Villena Way Palm Desert, CA | 2.0 | 2.0 | 1653 | $7,000 | $4.23 | 24d | 1 | 1.04mi |
| 177 Las Lomas Palm Desert, CA | 2.0 | 2.0 | 1800 | $7,500 | $4.17 | 43d | 1 | 1.05mi |
| 264 Avenida del Sol Palm Desert, CA | 2.0 | 2.0 | 1800 | $6,000 | $3.33 | 43d | 1 | 1.06mi |
| 305 Durango Palm Desert, CA | 2.0 | 2.0 | 1670 | $6,300 | $3.77 | 43d | 1 | 1.09mi |
| 295 Cordoba Way Palm Desert, CA | 2.0 | 2.0 | 1800 | $6,000 | $3.33 | 43d | 1 | 1.12mi |
| 316 S Sierra Madre Palm Desert, CA | 2.0 | 2.0 | 1656 | $5,700 | $3.44 | 43d | 1 | 1.12mi |
HOA detail
- Monthly dues
- $400 · $4,800/yr
Listing history 5 events
-
2026-05-15historical Active Under Contract
-
2026-05-04$200,000 Active
-
1999-02-23soldstatus $40,000
-
1999-01-19historical
-
1999-01-17$84,500
ⓘ Source: listings_history table (triggers on properties + properties_extension) + one-shot
backfill from property_details.listing_events for pre-trigger history.
Tax reassessment forecast CA · Resets to sale price
- Current annual tax
- $1,368 · $114/mo
- Projected year-2 tax
- $1,520 · $127/mo
- Expected delta
- +$152/yr (+$13/mo · 11.1%)
ⓘ Screening estimate from a state-policy table — verify with the county assessor before closing.
Climate risk First Street
- Flood 1/10 Low FEMA zone X (unshaded) · 0% chance over 30 yrs
- Wildfire 1/10 Low
- Heat 9/10 Extreme 7 d/yr ≥114°F today · 19 d/yr by 30 yrs out
- Wind 1/10 Low
- Air quality 4/10 Moderate 5 unhealthy d/yr today · 7 by 30 yrs out
Nearby sold comps map
Loading sold comps map…
Walkable amenities ~0.75 mi
Loading nearby amenities…
Taxation est. · year 1
- Rental income
- $47,207
- − Mortgage interest
- −$11,203
- − Property taxes
- −$1,368
- − Insurance
- −$1,000
- − Repairs & maintenance
- −$3,777
- − Management
- −$3,777
- − HOA
- −$4,800
- − Depreciation
- −$5,818
- Taxable income
- $15,464
- Est. tax owed @ 24.0%
- −$3,711
- After-tax cash flow
- $13,828/yr
For passive investors: Depreciation is non-cash, so a rental often shows a tax loss while cash-flowing — sheltering income. Rental losses are passive: they offset passive income freely, and up to $25,000/yr can offset ordinary (W-2) income if you actively participate and your MAGI is under $100k (phasing out to $0 by $150k); unused losses carry forward. On sale, claimed depreciation is recaptured at up to 25%, and gains may owe capital-gains tax (a 1031 exchange can defer both). Figures are a year-1 estimate at your 24.0% rate — not tax advice; consult a CPA.
Schools (NCES district)
- District
- Desert Sands Unified
- NCES district ID
- 0611110
- Math proficiency
- 31% ▼ -4.00%
- Reading proficiency
- 56% ▲ 7.00%
- Median HH income
- $54,957
- Composite
- 37.77/100
- National rank
- #4346
- State rank
- #199 of 517 in CA
Livability — Palm Desert
- Score
- 51/100
- State rank
- #1050
- US rank
- #25164
Category grades
Schools grade is shown separately in the Schools card above.
Census & demographics
- Census place
- Palm Desert, CA
- County
- Riverside County · 2,287,001 people
- City population
- 58,615
- Metro
- Riverside-San Bernardino-Ontario, CA
- Population (ZIP)
- 30,523
- Household income
- $70,091
- Rent vs Own
- Severe rent burden
- 1734.0
Population outlook (Riverside County) Hauer SSP2
- Today (2025)
- 2,664,475 people
- By 2030
- 2,802,692 · +5.2%
- By 2040
- 3,050,904 · +14.5%
- By 2050
- 3,256,783 · +22.2%
- By 2075
- 3,655,058 · +37.2%
- By 2100
- 3,766,594 · +41.4%
Race, ethnicity, and origin ACS 2023
- Neighborhood character
- Majority White (61%)
- Race & ethnicity
- White 61% Hispanic / Latino 31% Two or more races 20% Asian 4% Black 2%
- Hispanic origin (detail)
- Mexican 25%
- Common ancestry
- Italian 4% Lithuanian 3% Slovak 2%
- Foreign-born
- 18% · Canada, South Korea, Vietnam
- Languages at home
- 73% English-only · Spanish 22% French/Haitian/Cajun 1% Other Indo-European 1%
Political lean MEDSL · Riverside
- 2024 margin
- Toss-up / Even · D 48.0% · R 49.3% · Other 2.6%
- 2008→2024 swing
- -3.6pp toward R · 2008: 2.3pp · 2024: -1.3pp
- All cycles
- 2024: R+1.3 2020: D+8.0 2016: D+4.3 2012: R+0.4 2008: D+2.3
Not yet ingested
- Civics
- —
Market trends
- HPI YoY
- ▼ -364.94%
- Current HPI
- 294.9425
- Rent YoY
- ▲ 1.60%
- Metro
- Riverside-San Bernardino-Ontario, CA
- State GDP YoY
- ▲ 3.21%
- F500 in state
- 116
Industry mix (Fortune 500 HQ in CA)
| Industry | F500 HQs | Revenue |
|---|---|---|
| Technology | 27 | $1,492B |
|
||
| Financial Services | 3 | $174B |
|
||
| Retail | 3 | $44B |
|
||
| Insurance | 3 | $26B |
|
||
| Media / Entertainment | 2 | $115B |
|
||
| Pharmaceuticals / Biotech | 2 | $62B |
|
||
Price history
+136.7% since first listed5 events — show timeline
- 2026-05-15 Contingent — GPSMLS
- 2026-05-04 Listed $200,000 GPSMLS
- 1999-02-23 Sold (Public Records) $40,000 Public Records
- 1999-01-19 Listing Removed — GPSMLS
- 1999-01-17 Listed $84,500 GPSMLS
Property tax history
+2.2%/yrLatest (2025): $1,368 · +5.7% YoY. Source: county tax records.
Cash-flow waterfall
monthlySold comps — $/sqft
last 12 mo · ≤1 miLoading sold comps…