 🏗️ New Construction
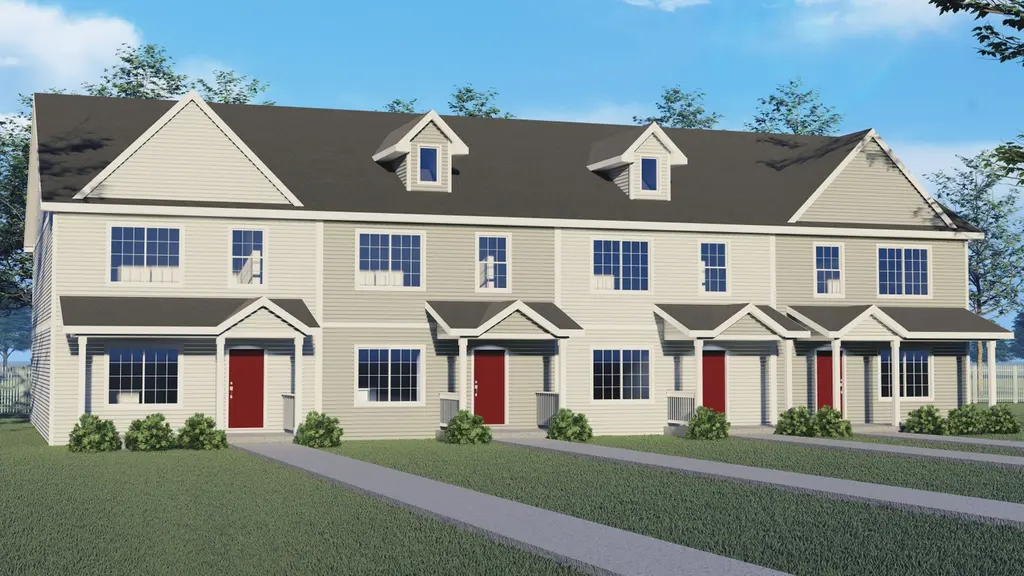
Reilly Plan · West Des Moines, IA
Flood risk 1/10 · Minimal
- FEMA flood zone
- X (unshaded)
- Chance of flooding over 30 yrs
- 0.0%
- Est. flood insurance / yr
- $473 – $860
Fire risk 1/10 · Minimal
- Est. fire insurance / yr
- $902 – $1,676
Heat risk 3/10 · Minor
- Hot days now (above 103°F)
- 7 days/yr
- Hot days in 30 yrs
- 15 days/yr
Wind risk 2/10 · Minimal
- Chance of severe wind over 30 yrs
- —
Air-quality risk 1/10 · Minimal
- Unhealthy air days now
- 0 days/yr
- Unhealthy air days in 30 yrs
- 0 days/yr
Risk factors via First Street. Map © Google.
Why this score? — see what drove the F grade
The composite is a weighted blend of 9 inputs, each scored 0–100. Each bar is that input's sub-score; the figure is the points it added to the 100-point composite (weight × sub-score).
- ARV discount +7.5/15.0
- Schools +7.1/10.0
- Livability +4.4/5.0
- Cash flow +3.4/30.0
- Rent growth +3.0/5.0
- Condition / age +2.5/5.0
- 1% rule +0.0/10.0
- DSCR +0.0/10.0
- Appreciation +0.0/10.0
$292,300
🖨 Deal sheet (PDF) 📄 Offer letter ✓ Due diligence
Listing remarks MLS
The Reilly plan has three bedrooms, two and a half baths, and a two-car garage. This Brownstone-style home has a garage entry at the back and an inviting porch on the front entry. The open-concept living room, kitchen, and dining room are on the main level. The upper level has three bedrooms, including two baths and a laundry room. The lower level can be partially finished to add an additional family room and bath. All lower-level finish options are available.
Key facts
- 2 garage spots
- Listed 684 days
Neighborhood map
What this means for you Summary
Snapshot
- This is a 3-bed/2.5-bath townhouse listed at $292k.
Deal economics
- At list price, monthly cash flow is $-1k ($-16k/yr) — negative.
- To cash-flow at today's rent, offer at most $232k (20.8% below list).
- To meet the 1% rule (rent ≥ 1% of price), the offer needs to be $203k (30.7% below list).
- Recommended offer: $203k (30.7% below list) — sets the bar for 1% rule.
Location & tenants
- Location reads 87/100 on livability (#11 in IA, #336 nationally) — a professional / high-income tenant draw. Strengths: amenities A+, cost of living A+, housing A+; Watch: commute F.
- Waukee Community School District (suburban): math 80% / reading 79% proficiency, ranked #14 of 289 in IA (top 5%) — strong family-tenant draw, lease renewals of 3-5y typical; only 11% free/reduced lunch — higher-income household profile.
- Zoned schools: Woodland Hills Elementary School (math 79% / reading 68%, grade A, #172 of 616 statewide, top 28%, 537 students, 24% FRL); South Middle School (math 78% / reading 77%, grade A+, #50 of 246 statewide, top 20%, 909 students, 26% FRL); Waukee High School (math 74% / reading 82%, grade A-, #53 of 336 statewide, top 16%, 1,268 students, 24% FRL).
- Market conditions: Rents rising (+1.9%/yr); 591 active listings in the ZIP; 9 comparable units currently listed for rent nearby; rentals at typical pace (median 24d on market — plan ~3-4 weeks tenant-placement turnaround); solid renter incomes; 1,503 units permitted in Dallas County in 2024 (630 in 5+ unit buildings).
Forward outlook
- Local home prices are declining (-3.0%/yr); year-one equity from $3k of loan paydown is wiped out by about $13k of value loss. Plan a longer hold.
- Dallas County population projected at +74% by 2050 — long-run rental-demand tailwind backs the buy-and-hold thesis.
Negotiation context
- It's been on market 684 days — a 12% lower offer ($257k) is reasonable based on typical stale-listing flexibility.
Questions for the listing agent
- What do current leases actually rent for vs. the listed asking? Can we see a recent rent roll and the last 12 months of T-12 income?
- It's been on market 684 days. Have you received any prior offers? Is the seller open to a 31% concession, seller financing, or rate buy-down credit?
- Why hasn't it sold? Are there any deal-killer items the seller is aware of (foundation, flood, title, zoning, code violations)?
- Is there a deadline driving the sale (1031 exchange, divorce, estate, relocation)? That informs how much negotiation room exists.
- Schools are A-rated — typically a magnet for longer-tenancy family renters. What's the average tenant stay here, and is there a school-zone premium baked into asking?
- The area grade is low — what's the realistic commute time and amenity access for the typical tenant pool here? Any planned neighborhood developments (good or bad) we should know about?
- What's the average days-on-market for RENTAL listings here right now (not sales)? A rising rental-DOM trend means longer vacancies and softer asking-rent achievability than the comps imply.
- What's the recent tenant-quality profile in this submarket — average credit score on applications, eviction rate, late-payment / NSF rate, and stable-employment percentage? A property-management company in the area should have these aggregated.
- How much new for-sale + rental construction is in the pipeline within 1–3 miles? Heavy new supply typically softens prices + rents 12–24 months out; constrained supply supports both.
Investment metrics
- 1% rule
- 0.48% ✗
- Cap rate
- 2.59%
- Cash-on-cash
- -13.23%
- DSCR
- 0.41
- GRM
- 17.2
CMA / ARV
- ARV (median comp)
- $418,628
- List price
- $292,300
- Delta
- -30.18%
- Verdict
- UNDERPRICED
- Comps
- 20 within 1.0 mi
Show comp detail 12 sales within ~0.75 mi
| Address | Dist | Beds/Ba | Sqft | Sold | Price | $/sf | Match |
|---|---|---|---|---|---|---|---|
| 1175 S 91st St | 0.07mi | 3/2.5 | 1,688 (+4%) | 1mo | $288,000 | $171 | 90 |
| 9108 Robinson Dr | 0.18mi | 3/2.5 | 1,591 (-2%) | 2mo | $290,225 | $182 | 86 |
| 9015 Jean Louise Dr | 0.12mi | 3/3.0 | 1,590 (-2%) | 5mo | $395,000 | $248 | 84 |
| 9024 Calpurnia Dr | 0.00mi | 3/3.0 | 1,588 (-3%) | 11mo | $375,000 | $236 | 84 |
| 1111 S 91st St | 0.13mi | 3/2.5 | 1,678 (+3%) | 7mo | $285,750 | $170 | 84 |
| 8932 Mockingbird Dr | 0.07mi | 3/3.0 | 1,588 (-3%) | 9mo | $420,000 | $264 | 83 |
| 9020 Mockingbird Dr | 0.06mi | 3/3.0 | 1,595 (-2%) | 11mo | $397,500 | $249 | 82 |
| 9042 Mockingbird Dr | 0.06mi | 3/3.0 | 1,595 (-2%) | 11mo | $390,000 | $245 | 82 |
| 1149 S Atticus St | 0.14mi | 3/3.0 | 1,588 (-3%) | 13mo | $426,000 | $268 | 77 |
| 9156 Jamison Dr | 0.33mi | 4/3.0 (+1) | 1,674 (+3%) | 1mo | $570,000 | $341 | 72 |
| 1195 S 91st St | 0.06mi | 3/3.5 | 1,521 (-7%) | 12mo | $295,900 | $195 | 72 |
| 8915 Jamison Dr | 0.35mi | 3/3.0 | 1,486 (-9%) | 5mo | $415,000 | $279 | 63 |
Match score weights: distance 35% · size 25% · config 20% · recency 20%. Top-matched comps best support the ARV.
Projected returns pro-forma
-3.0% appreciation · 1.94% rent growth · sell at horizon
- IRR
- -42.2%
- Equity multiple
- -0.30×
- Total profit
- $-152,253
- Equity at exit
- $62,419
- IRR
- -79.3%
- Equity multiple
- -1.11×
- Total profit
- $-247,031
- Equity at exit
- $36,195
Cash invested: $117,216 (down + closing). Projections, not guarantees.
Landlord ↔ Tenant lean methodology
- Overall (STATE)
- 83 Strongly Landlord-Friendly
- State Iowa
- 83 Strongly Landlord-Friendly · R+6
- County
- — inherits STATE
- City
- — inherits STATE
ZIP-level market 50266
- Home prices YoY
- -17.5%
- Rents YoY
- 1.9%
- Active inventory
- 591
- Price-to-rent
- 12.0×
Monthly cashflow live
- Estimated rent
- $2,026 high interval (Pro) →
- Mortgage (P&I)
- −$2,195
- Tax est. 1.5%
- −$523 /mo · $6,279/yr
- Insurance
- −$174
- HOA
- −$0
- Vacancy / Maint / Mgmt
- −$426
- Net cashflow
- $-1,292
Break-even live
Sensitivity live
| Price | -10% $-1,003 | -5% $-1,148 | +0% $-1,292 | +5% $-1,437 | +10% $-1,582 |
|---|---|---|---|---|---|
| Rent | -10% $-1,452 | -5% $-1,372 | +0% $-1,292 | +5% $-1,212 | +10% $-1,132 |
| Rate | -1.0pp $-1,082 | -0.5pp $-1,186 | base $-1,292 | +0.5pp $-1,401 | +1.0pp $-1,511 |
UW: 25.0% down · 7.5% · 30yr · 1.5% tax · 5.0% vac · 8.0% maint · 8.0% mgmt
Financing live
Cash to close
- Down payment
- $104,657
- Closing costs
- $12,559
- Reserves months
- —
- Total cash needed
- —
Loan-product check · same deal, 3 products live
Conventional
25% down · 7.5% · 30yr
- Down + closing
- —
- Monthly P&I
- —
- Monthly cashflow
- —
- DSCR
- —
- Eligible?
- —
Personal DTI + credit; lowest rate.
DSCR
20% down · 8.5% · 30yr
- Down + closing
- —
- Monthly P&I
- —
- Monthly cashflow
- —
- DSCR
- —
- Eligible?
- —
No personal income docs; deal must DSCR.
Hard money
10% down · 12.0% · 12mo
- Down + closing
- —
- Monthly P&I
- —
- Monthly cashflow
- —
- DSCR
- —
- Eligible?
- —
Short-term bridge; refi at stabilization.
Rent comps 9 comps
| Address | Beds | Baths | Sqft | Rent | $/sqft | DOM | Units | Dist |
|---|---|---|---|---|---|---|---|---|
| 1257 S 91st St West Des Moines, IA | 3.0 | 3.5 | 1503 | $2,200 | $1.46 | 25d | 1 | 0.07mi |
| 1139 S 91st St West Des Moines, IA | 3.0 | 3.5 | 1529 | $2,200 | $1.44 | 25d | 1 | 0.10mi |
| 8925 Cascade Ave West Des Moines, IA | 1.0–3.0 | 1.0–2.0 | 1035 | $1,595 | $1.54 | 16d | 11 | 0.49mi |
| 10101 Stark Dr West Des Moines, IA | 3.0 | 2.5 | 1667 | $2,095 | $1.26 | 16d | 1 | 0.95mi |
| 455 S 85th St West Des Moines, IA | 1.0–3.0 | 1.0–2.5 | 1215 | $2,352 | $1.94 | 16d | 23 | 0.99mi |
| 9005 Bridgewood Blvd West Des Moines, IA | 1.0–3.0 | 1.0–2.0 | 1044 | $950 | $0.91 | 23d | 1 | 1.24mi |
| 6950 Stagecoach Dr West Des Moines, IA | 2.0–3.0 | 2.5–3.5 | 1785 | $2,585 | $1.45 | 16d | 20 | 1.45mi |
| 9128 Calvin Dr West Des Moines, IA | 3.0 | 2.5 | 1799 | $2,195 | $1.22 | 46d | 1 | 1.46mi |
| 342 Harmony Ave West Des Moines, IA | 3.0 | 2.5 | 1595 | $2,195 | $1.38 | 23d | 1 | 1.48mi |
Listing history 20 events
-
2026-06-21days on market $292,300 Active 684 DOM
-
2026-06-18days on market $292,300 Active 681 DOM
-
2026-06-17days on market $292,300 Active 680 DOM
-
2026-06-16days on market $292,300 Active 679 DOM
-
2026-06-15days on market $292,300 Active 678 DOM
-
2026-06-14days on market $292,300 Active 676 DOM
-
2026-06-13days on market $292,300 Active 675 DOM
-
2026-06-10days on market $292,300 Active 673 DOM
-
2026-06-09days on market $292,300 Active 672 DOM
-
2026-06-08days on market $292,300 Active 671 DOM
-
2026-06-07days on market $292,300 Active 670 DOM
-
2026-06-05days on market $292,300 Active 667 DOM
-
2026-06-03days on market $292,300 Active 666 DOM
-
2026-06-02days on market $292,300 Active 665 DOM
-
2026-06-01days on market $292,300 Active 664 DOM
-
2026-05-31days on market $292,300 Active 663 DOM
-
2026-05-31days on market $292,300 Active 662 DOM
-
2026-04-04price $292,300 464-char remark
Show marketing remark (464 chars)
The Reilly plan has three bedrooms, two and a half baths, and a two-car garage. This Brownstone-style home has a garage entry at the back and an inviting porch on the front entry. The open-concept living room, kitchen, and dining room are on the main level. The upper level has three bedrooms, including two baths and a laundry room. The lower level can be partially finished to add an additional family room and bath. All lower-level finish options are available.
-
2025-09-10price $323,800 464-char remark
Show marketing remark (464 chars)
The Reilly plan has three bedrooms, two and a half baths, and a two-car garage. This Brownstone-style home has a garage entry at the back and an inviting porch on the front entry. The open-concept living room, kitchen, and dining room are on the main level. The upper level has three bedrooms, including two baths and a laundry room. The lower level can be partially finished to add an additional family room and bath. All lower-level finish options are available.
-
2024-08-06$353,000 Active 464-char remark
Show marketing remark (464 chars)
The Reilly plan has three bedrooms, two and a half baths, and a two-car garage. This Brownstone-style home has a garage entry at the back and an inviting porch on the front entry. The open-concept living room, kitchen, and dining room are on the main level. The upper level has three bedrooms, including two baths and a laundry room. The lower level can be partially finished to add an additional family room and bath. All lower-level finish options are available.
ⓘ Source: listings_history table (triggers on properties + properties_extension) + one-shot
backfill from property_details.listing_events for pre-trigger history.
Climate risk First Street
- Flood 1/10 Low FEMA zone X (unshaded) · 0% chance over 30 yrs
- Wildfire 1/10 Low
- Heat 3/10 Moderate 7 d/yr ≥103°F today · 15 d/yr by 30 yrs out
- Wind 2/10 Low
- Air quality 1/10 Low 0 unhealthy d/yr today · 0 by 30 yrs out
Nearby sold comps map
Loading sold comps map…
Walkable amenities ~0.75 mi
Loading nearby amenities…
Taxation est. · year 1
- Rental income
- $24,315
- − Mortgage interest
- −$23,450
- − Property taxes
- −$6,279
- − Insurance
- −$2,093
- − Repairs & maintenance
- −$1,945
- − Management
- −$1,945
- − Depreciation
- −$12,178
- Taxable loss
- −$23,576
- Est. tax savings @ 24.0%
- +$5,658
- After-tax cash flow
- $-9,850/yr
For passive investors: Depreciation is non-cash, so a rental often shows a tax loss while cash-flowing — sheltering income. Rental losses are passive: they offset passive income freely, and up to $25,000/yr can offset ordinary (W-2) income if you actively participate and your MAGI is under $100k (phasing out to $0 by $150k); unused losses carry forward. On sale, claimed depreciation is recaptured at up to 25%, and gains may owe capital-gains tax (a 1031 exchange can defer both). Figures are a year-1 estimate at your 24.0% rate — not tax advice; consult a CPA.
Schools (NCES district)
- District
- Waukee Community School District
- NCES district ID
- 1930510
- Math proficiency
- 80% ▼ -6.00%
- Reading proficiency
- 79% ▼ -5.00%
- Median HH income
- $88,580
- Composite
- 70.94/100
- National rank
- #245
- State rank
- #14 of 289 in IA
Livability — West Des Moines
- Score
- 87/100
- State rank
- #11
- US rank
- #336
Category grades
Schools grade is shown separately in the Schools card above.
Census & demographics
- Census place
- West Des Moines, IA
- County
- Dallas County · 77,082 people
- City population
- 71,011
- Metro
- Des Moines-West Des Moines, IA
- Population (ZIP)
- 37,523
- Household income
- $87,025
- Rent vs Own
- Severe rent burden
- 1561.0
Population outlook (Dallas County) Hauer SSP2
- Today (2025)
- 111,904 people
- By 2030
- 127,807 · +14.2%
- By 2040
- 160,576 · +43.5%
- By 2050
- 194,154 · +73.5%
- By 2075
- 271,895 · +143.0%
- By 2100
- 326,525 · +191.8%
Race, ethnicity, and origin ACS 2023
- Neighborhood character
- Predominantly White (80%)
- Race & ethnicity
- White 80% Asian 8% Two or more races 6% Hispanic / Latino 5% Black 3%
- Hispanic origin (detail)
- Mexican 3%
- Common ancestry
- Portuguese 5% Italian 3% Iranian 2%
- Foreign-born
- 12% · Canada, South Korea, Vietnam
- Languages at home
- 86% English-only · Spanish 4% Other Asian/Pacific 3% Other Indo-European 2%
Political lean MEDSL · Dallas
- 2024 margin
- Toss-up / Even · D 46.9% · R 51.7% · Other 1.4%
- 2008→2024 swing
- +0.8pp no change · 2008: -5.5pp · 2024: -4.8pp
- All cycles
- 2024: R+4.8 2020: R+2.0 2016: R+9.6 2012: R+11.8 2008: R+5.5
Not yet ingested
- Civics
- —
Market trends
- HPI YoY
- ▼ -43.24%
- Current HPI
- 203.6979
- Rent YoY
- ▲ 1.94%
- Metro
- Des Moines-West Des Moines, IA
- State GDP YoY
- ▲ 2.48%
- F500 in state
- 4
Industry mix (Fortune 500 HQ in IA)
| Industry | F500 HQs | Revenue |
|---|---|---|
| Financial Services | 1 | $16B |
|
||
| Retail / Convenience | 1 | $15B |
|
||
Price history
-17.2% since first listed3 events — show timeline
- 2026-04-04 Price Changed $292,300 Zillow
- 2025-09-10 Price Changed $323,800 Zillow
- 2024-08-06 Listed $353,000 Zillow
Cash-flow waterfall
monthlySold comps — $/sqft
last 12 mo · ≤1 miLoading sold comps…