469-480 Childrens Rd · Susanville, CA
Flood risk 1/10 · Minimal
- FEMA flood zone
- X (unshaded)
- Chance of flooding over 30 yrs
- 0.0%
- Est. flood insurance / yr
- $507 – $1,088
Fire risk 8/10 · Major
- Est. fire insurance / yr
- $659 – $1,223
Heat risk 4/10 · Minor
- Hot days now (above 84°F)
- 7 days/yr
- Hot days in 30 yrs
- 19 days/yr
Wind risk 1/10 · Minimal
- Chance of severe wind over 30 yrs
- —
Air-quality risk 10/10 · Severe
- Unhealthy air days now
- 30 days/yr
- Unhealthy air days in 30 yrs
- 31 days/yr
Risk factors via First Street. Map © Google.
Why this score? — see what drove the B grade
The composite is a weighted blend of 9 inputs, each scored 0–100. Each bar is that input's sub-score; the figure is the points it added to the 100-point composite (weight × sub-score).
- Cash flow +30.0/30.0
- 1% rule +10.0/10.0
- DSCR +10.0/10.0
- ARV discount +7.5/15.0
- Schools +5.4/10.0
- Livability +3.2/5.0
- Rent growth +2.5/5.0
- Condition / age +2.5/5.0
- Appreciation +0.0/10.0
$83,000
🖨 Deal sheet 📄 Offer letter ✓ Due diligence
Listing remarks
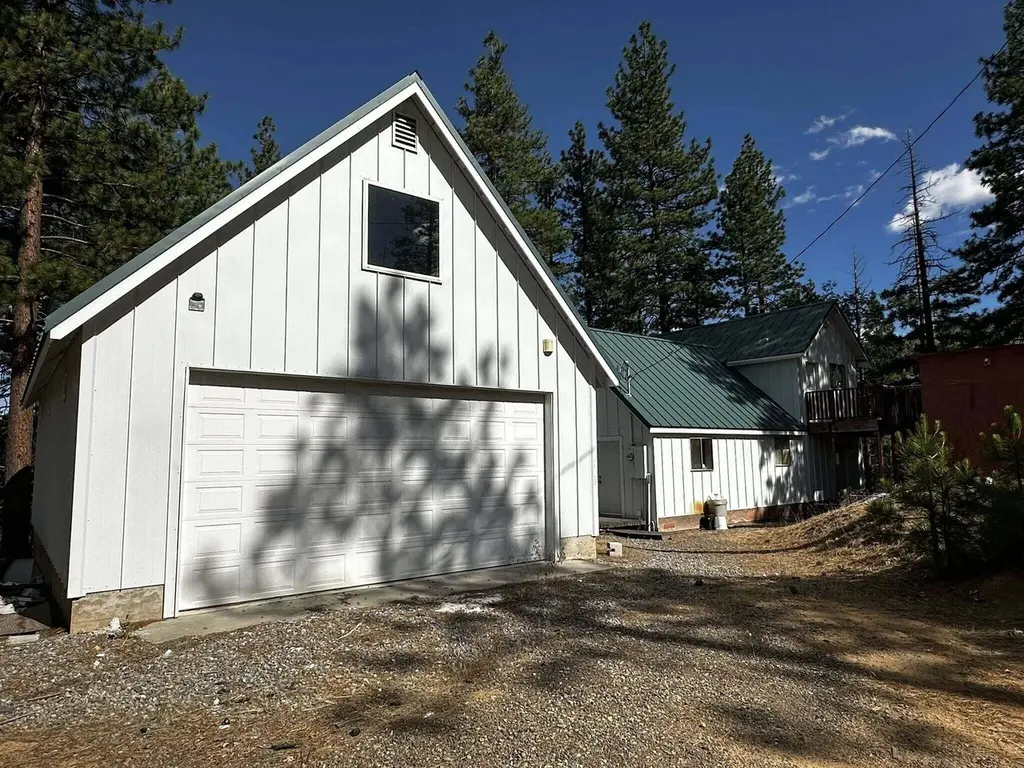
Discover room to breathe and endless potential with this 2-bedroom, 1-bathroom, 1,524-square-foot two-story residence situated on a spacious 3.85-acre parcel in charming Susanville, California. Providing a rare combination of functional interior living space and expansive acreage, this property offers a peaceful rural footprint just minutes from local city conveniences.
Key facts
- Spacious acreage
- 3.85 acre lot
- 2 garage spots
Tags
Property features AI
Exterior
- Parking: 2-car garage
- Utilities: Septic tank; Other water source; Other utilities
- Home design: Single family residence; Two levels; Residential property
- Construction: Wood siding construction; Raised foundation; Built (year not provided)
- Exterior features: Metal roof; Rolling slope lot; Dirt road access; Property has a view
Interior
- Flooring: Carpet; Laminate
- Bathrooms: 1 full bathroom
- Heating & cooling: Window air conditioning units; Other heating
- Interior features: Carpet and laminate flooring; No fireplace
Neighborhood map
What this means for you Summary
Snapshot
- This is a 2-bed/1.0-bath single-family listed at $83k.
Deal economics
- At list price, monthly cash flow is $590 ($7k/yr) — positive.
- The deal already cash-flows at list — no discount required.
- Meets the 1% rule at list price ($2k rent vs $83k).
- Cap rate 14.8% vs local median 3.8% in Susanville — top-decile yield for the area; either an underpriced asset or a hidden risk that comps aren't pricing in. Stress-test before assuming the spread holds.
Location & tenants
- Location reads 64/100 on livability (#421 in CA) — a middle-class / working-renter tenant base. Strengths: housing A+, commute A-, health & safety A-; Watch: schools F, crime F, amenities F.
- Richmond Elementary (rural): math 50% / reading 65% proficiency, ranked #250 of 1,400 in CA (top 18%) — acceptable for families but not a draw, mixed tenant base, ~2y average lease; only 5% free/reduced lunch — higher-income household profile.
- Market conditions: 236 active listings in the ZIP; 6 units permitted in Lassen County in 2024 (0 in 5+ unit buildings).
Forward outlook
- Local home prices are declining (-3.0%/yr); year-one equity from $574 of loan paydown is wiped out by about $2k of value loss. Plan a longer hold.
- Lassen County population projected at -14% by 2050 — secular population decline; favor cash flow + early exit over multi-decade hold.
- At projected returns (-3.0% appreciation + 3.0% rent growth), your $23k cash investment doubles in ~4 years — after that, you're playing with house money.
Negotiation context
- Only 9 days on market — expect competitive offers; lowballing is unlikely to land.
Risks & watch-outs
- Climate carrying-cost: severe wildfire risk — expect insurance premiums to compound above CPI over the hold.
Questions for the listing agent
- Built in 1965 — when were the roof, HVAC, electrical panel, plumbing, and water heater last replaced?
- Is there a deadline driving the sale (1031 exchange, divorce, estate, relocation)? That informs how much negotiation room exists.
- Schools are F-rated, which usually means shorter tenancies and higher turnover. Who's the typical renter profile here, and what's been the actual vacancy rate?
- Crime grade is F in this area — have there been break-ins, vandalism, or insurance claims at this property in the last 3 years? What carrier currently insures it and at what premium?
- What's the average days-on-market for RENTAL listings here right now (not sales)? A rising rental-DOM trend means longer vacancies and softer asking-rent achievability than the comps imply.
- What's the recent tenant-quality profile in this submarket — average credit score on applications, eviction rate, late-payment / NSF rate, and stable-employment percentage? A property-management company in the area should have these aggregated.
- How much new for-sale + rental construction is in the pipeline within 1–3 miles? Heavy new supply typically softens prices + rents 12–24 months out; constrained supply supports both.
Investment metrics
- 1% rule
- 1.84% ✓
- Cap rate
- 14.82%
- Cash-on-cash
- 30.45%
- DSCR
- 2.35
- GRM
- 4.5
CMA / ARV
No comps found within radius.
Projected returns pro-forma
-3.0% appreciation · 3.0% rent growth · sell at horizon
- IRR
- 25.2%
- Equity multiple
- 2.04×
- Total profit
- $24,162
- Equity at exit
- $12,376
- IRR
- 32.9%
- Equity multiple
- 4.00×
- Total profit
- $69,614
- Equity at exit
- $7,176
Cash invested: $23,240 (down + closing). Projections, not guarantees.
Landlord ↔ Tenant lean methodology
- Overall (STATE)
- 18 Strongly Tenant-Friendly
- State California
- 18 Strongly Tenant-Friendly · D+13
- County
- — inherits STATE
- City
- — inherits STATE
ZIP-level market 96130
- Active inventory
- 236
- Price-to-rent
- 4.5×
Monthly cashflow live
- Estimated rent
- $1,531 medium interval (Pro) →
- Mortgage (P&I)
- −$435
- Tax from tax record
- −$150 /mo · $1,799/yr
- Insurance
- −$35
- HOA
- −$0
- Vacancy / Maint / Mgmt
- −$322
- Net cashflow
- $590
Break-even live
UW: 25.0% down · 7.5% · 30yr · 1.5% tax · 5.0% vac · 8.0% maint · 8.0% mgmt
Financing live
Cash to close
- Down payment
- $20,750
- Closing costs
- $2,490
- Reserves months
- —
- Total cash needed
- —
Loan-product check · same deal, 3 products live
Conventional
25% down · 7.5% · 30yr
- Down + closing
- —
- Monthly P&I
- —
- Monthly cashflow
- —
- DSCR
- —
- Eligible?
- —
Personal DTI + credit; lowest rate.
DSCR
20% down · 8.5% · 30yr
- Down + closing
- —
- Monthly P&I
- —
- Monthly cashflow
- —
- DSCR
- —
- Eligible?
- —
No personal income docs; deal must DSCR.
Hard money
10% down · 12.0% · 12mo
- Down + closing
- —
- Monthly P&I
- —
- Monthly cashflow
- —
- DSCR
- —
- Eligible?
- —
Short-term bridge; refi at stabilization.
Listing history 9 events
-
2026-06-19days on market $83,000 Active 9 DOM
-
2026-06-18days on market $83,000 Active 8 DOM
-
2026-06-17days on market $83,000 Active 7 DOM
-
2026-06-17price $83,000 Active 6 DOM
-
2026-06-16days on market $131,000 Active 6 DOM
-
2026-06-15days on market $131,000 Active 5 DOM
-
2026-06-14days on market $131,000 Active 3 DOM
-
2026-06-12remarks 372-char remark
-
2026-06-12$131,000 Active 2 DOM
ⓘ Source: listings_history table (triggers on properties + properties_extension) + one-shot
backfill from property_details.listing_events for pre-trigger history.
Tax reassessment forecast CA · Resets to sale price
- Current annual tax
- $1,799 · $150/mo
- Projected year-2 tax
- $1,799 · $150/mo
- Expected delta
- $0/yr ($0/mo · 0.0%)
ⓘ Screening estimate from a state-policy table — verify with the county assessor before closing.
Climate risk First Street
- Flood 1/10 Low FEMA zone X (unshaded) · 0% chance over 30 yrs
- Wildfire 8/10 Severe
- Heat 4/10 Moderate 7 d/yr ≥84°F today · 19 d/yr by 30 yrs out
- Wind 1/10 Low
- Air quality 10/10 Extreme 30 unhealthy d/yr today · 31 by 30 yrs out
Nearby sold comps map
Loading sold comps map…
Walkable amenities ~0.75 mi
Loading nearby amenities…
Taxation est. · year 1
- Rental income
- $18,372
- − Mortgage interest
- −$4,649
- − Property taxes
- −$1,799
- − Insurance
- −$415
- − Repairs & maintenance
- −$1,470
- − Management
- −$1,470
- − Depreciation
- −$2,415
- Taxable income
- $6,155
- Est. tax owed @ 24.0%
- −$1,477
- After-tax cash flow
- $5,600/yr
For passive investors: Depreciation is non-cash, so a rental often shows a tax loss while cash-flowing — sheltering income. Rental losses are passive: they offset passive income freely, and up to $25,000/yr can offset ordinary (W-2) income if you actively participate and your MAGI is under $100k (phasing out to $0 by $150k); unused losses carry forward. On sale, claimed depreciation is recaptured at up to 25%, and gains may owe capital-gains tax (a 1031 exchange can defer both). Figures are a year-1 estimate at your 24.0% rate — not tax advice; consult a CPA.
Schools (NCES district)
- District
- Richmond Elementary
- NCES district ID
- 0632520
- Math proficiency
- 50% ▲ 5.00%
- Reading proficiency
- 65% ▲ 10.00%
- Median HH income
- $80,235
- Composite
- 53.57/100
- National rank
- #3114
- State rank
- #250 of 1400 in CA
Livability — Susanville
- Score
- 64/100
- State rank
- #421
- US rank
- #14210
Category grades
Schools grade is shown separately in the Schools card above.
Census & demographics
- Population (ZIP)
- 20,892
Population outlook (Lassen County) Hauer SSP2
- Today (2025)
- 27,112 people
- By 2030
- 26,732 · -1.4%
- By 2040
- 25,536 · -5.8%
- By 2050
- 23,262 · -14.2%
- By 2075
- 18,620 · -31.3%
- By 2100
- 14,679 · -45.9%
Race, ethnicity, and origin ACS 2023
- Neighborhood character
- Diverse neighborhood (Simpson 0.60)
- Race & ethnicity
- White 57% Hispanic / Latino 26% Two or more races 17% Black 9% Native American 2% Pacific Islander 1% Asian 1%
- Hispanic origin (detail)
- Mexican 23%
- Common ancestry
- Iranian 2% Lithuanian 2% Slovak 2%
- Foreign-born
- 5% · Canada
- Languages at home
- 80% English-only · Spanish 16% Other Asian/Pacific 1% Other Indo-European 1%
Political lean MEDSL · Lassen
- 2024 margin
- Solid R (+54.0) · D 21.8% · R 75.8% · Other 2.4%
- 2008→2024 swing
- -19.8pp toward R · 2008: -34.2pp · 2024: -54.0pp
- All cycles
- 2024: R+54.0 2020: R+51.5 2016: R+51.3 2012: R+39.8 2008: R+34.2
Not yet ingested
- Civics
- —
Market trends
- HPI YoY
- ▼ -126.12%
- Current HPI
- 136.1585
- Rent YoY
- —
- Metro
- —
- State GDP YoY
- ▲ 3.21%
- F500 in state
- 116
Industry mix (Fortune 500 HQ in CA)
| Industry | F500 HQs | Revenue |
|---|---|---|
| Technology | 27 | $1,492B |
|
||
| Financial Services | 3 | $174B |
|
||
| Retail | 3 | $44B |
|
||
| Insurance | 3 | $26B |
|
||
| Media / Entertainment | 2 | $115B |
|
||
| Pharmaceuticals / Biotech | 2 | $62B |
|
||
Price history
+4.8% since first listed2 events — show timeline
- 2026-06-08 Listed $131,000 SAOR
- 2004-03-02 Sold (Public Records) $125,000 Public Records
Property tax history
+5.7%/yrLatest (2025): $1,799 · +2.0% YoY. Source: county tax records.
Cash-flow waterfall
monthlySold comps — $/sqft
last 12 mo · ≤1 miLoading sold comps…