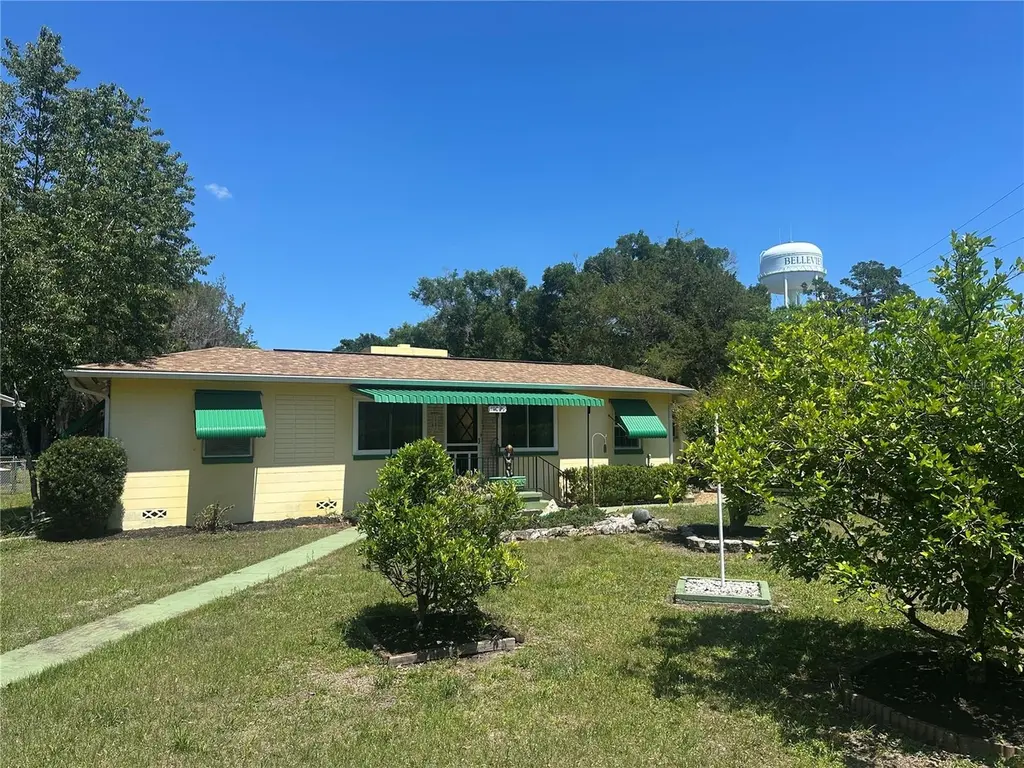
11029 SE 55th Ave · Belleview, FL
Flood risk 1/10 · Minimal
- FEMA flood zone
- X (unshaded)
- Chance of flooding over 30 yrs
- 0.0%
- Est. flood insurance / yr
- $507 – $1,088
Fire risk 4/10 · Minor
- Est. fire insurance / yr
- $947 – $1,759
Heat risk 8/10 · Major
- Hot days now (above 109°F)
- 5 days/yr
- Hot days in 30 yrs
- 13 days/yr
Wind risk 9/10 · Severe
- Chance of severe wind over 30 yrs
- 99.0%
Air-quality risk 3/10 · Minor
- Unhealthy air days now
- 3 days/yr
- Unhealthy air days in 30 yrs
- 4 days/yr
Risk factors via First Street. Map © Google.
Why this score? — see what drove the D grade
The composite is a weighted blend of 9 inputs, each scored 0–100. Each bar is that input's sub-score; the figure is the points it added to the 100-point composite (weight × sub-score).
- Cash flow +14.3/30.0
- ARV discount +10.2/15.0
- DSCR +4.4/10.0
- Schools +3.6/10.0
- Livability +3.5/5.0
- 1% rule +2.8/10.0
- Rent growth +2.5/5.0
- Condition / age +2.5/5.0
- Appreciation +0.0/10.0
$192,000
🖨 Deal sheet 📄 Offer letter ✓ Due diligence
Listing remarks
Under contract-accepting backup offers. Charming 1959 Block Home on Spacious 1/3 Acre – Move-In Ready! Welcome to this adorable and well-maintained 3-bedroom, 1-bath block home, perfectly situated on a generous 1/3-acre lot. Full of character and thoughtful updates, this property offers both comfort and versatility with plenty of indoor and outdoor living space. Step inside to find cozy new carpet in the bedrooms and updated vinyl double-pane windows (installed just 4 years ago) that bring in natural light while boosting energy efficiency. Major systems have been well cared for, including new roof 2021 and a Trane heat pump A/C system installed 7 years ago. Outdoors, you’ll fal
Key facts
- Spacious 1/3 acre
- Fire pit
- Fully fenced yard
Tags
Property features AI
Finance
- Other: Property zoned R1; Homestead exempt; Unfurnished; Directions: From SE US 441 to 55th Ave. two blocks to 11029 SE 55th Ave
Exterior
- Parking: Carport (1 space)
- Utilities: Public sewer; Cable connected; Electricity connected; Propane (on site); No water source listed
- Home design: Single family residence; One story; East-facing
- Construction: Block construction; Shingle roof; Crawlspace foundation; Built on an oversized lot (approx. 0.31 acre, 82 x 165)
- Exterior features: Awning(s); Fire pit; Private mailbox; Greenhouse; Shed(s); Storage; Workshop
Interior
- Kitchen: Built-in oven; Cooktop; Refrigerator
- Bedrooms: 3 bedrooms
- Flooring: Carpet; Tile; Wood
- Bathrooms: 1 full bathroom
- Heating & cooling: Natural gas heating; Central air conditioning
- Interior features: Ceiling fans; Fireplace in family room
- Laundry & utility: Dedicated laundry room; Washer included
Neighborhood map
What this means for you Summary
Snapshot
- This is a 3-bed/1.0-bath single-family listed at $192k.
Deal economics
- At list price, monthly cash flow is $36 ($429/yr) — positive.
- The deal already cash-flows at list — no discount required.
- To meet the 1% rule (rent ≥ 1% of price), the offer needs to be $150k (21.8% below list).
- Recommended offer: $150k (21.8% below list) — sets the bar for 1% rule.
- Cap rate 6.5% vs local median 4.5% in Belleview — top-decile yield for the area; either an underpriced asset or a hidden risk that comps aren't pricing in. Stress-test before assuming the spread holds.
Location & tenants
- Location reads 69/100 on livability (#458 in FL) — a middle-class / working-renter tenant base. Strengths: cost of living A+, housing A+, health & safety A+; Watch: schools D, crime F, amenities F.
- Marion (rural): math 42% / reading 43% proficiency, ranked #61 of 73 in FL (top 84%) — families likely to look elsewhere, expect single-tenant / working-renter base with shorter leases; 61% free/reduced lunch — lower-income household profile, screen leases tightly.
- Market conditions: 357 active listings in the ZIP; 6 comparable units currently listed for rent nearby; rentals at typical pace (median 21d on market — plan ~3-4 weeks tenant-placement turnaround); 7,071 units permitted in Marion County in 2024 (534 in 5+ unit buildings).
Forward outlook
- Local home prices are declining (-3.0%/yr); year-one equity from $1k of loan paydown is wiped out by about $6k of value loss. Plan a longer hold.
- Marion County population projected at +13% by 2050 — modest demand growth; plan on rents tracking national, not racing it.
Negotiation context
- It's been on market 23 days — a 2% lower offer ($189k) is reasonable based on typical stale-listing flexibility.
- 10 sale attempts since 19y ago with the ask held roughly flat each time — persistent listings suggest the price (not the market) is what's stuck; bring a comps-based counter.
- Current owner paid $60k; list at $192k implies a 221% gain — meaningful room to come down on a strong offer.
Risks & watch-outs
- Watch-outs: built in 1959 — expect roof / HVAC / electrical / plumbing capex.
- Climate carrying-cost: severe wind risk, 99% chance of damaging wind over 30y; extreme-heat days projected 5→13/yr by 2055 (HVAC capex compounding) — expect insurance premiums to compound above CPI over the hold.
Questions for the listing agent
- Built in 1959 — when were the roof, HVAC, electrical panel, plumbing, and water heater last replaced?
- Is there a deadline driving the sale (1031 exchange, divorce, estate, relocation)? That informs how much negotiation room exists.
- Schools are D-rated, which usually means shorter tenancies and higher turnover. Who's the typical renter profile here, and what's been the actual vacancy rate?
- Crime grade is F in this area — have there been break-ins, vandalism, or insurance claims at this property in the last 3 years? What carrier currently insures it and at what premium?
- The area grade is low — what's the realistic commute time and amenity access for the typical tenant pool here? Any planned neighborhood developments (good or bad) we should know about?
- What's the average days-on-market for RENTAL listings here right now (not sales)? A rising rental-DOM trend means longer vacancies and softer asking-rent achievability than the comps imply.
- What's the recent tenant-quality profile in this submarket — average credit score on applications, eviction rate, late-payment / NSF rate, and stable-employment percentage? A property-management company in the area should have these aggregated.
- How much new for-sale + rental construction is in the pipeline within 1–3 miles? Heavy new supply typically softens prices + rents 12–24 months out; constrained supply supports both.
Investment metrics
- 1% rule
- 0.78% ✗
- Cap rate
- 6.52%
- Cash-on-cash
- 0.80%
- DSCR
- 1.04
- GRM
- 10.7
CMA / ARV
- ARV (on-the-fly)
- $204,452
- Comps found
- 7
Show comp detail 7 sales within ~0.75 mi
| Address | Dist | Beds/Ba | Sqft | Sold | Price | $/sf | Match |
|---|---|---|---|---|---|---|---|
| 5915 SE Holly Rd | 0.35mi | 3/1.0 | 1,248 (-4%) | 12mo | $197,000 | $158 | 68 |
| 10736 SE 51st Ct | 0.48mi | 3/2.0 | 1,248 (-4%) | 16mo | $205,000 | $164 | 55 |
| 11667 SE 60th Ave | 0.74mi | 3/2.0 | 1,232 (-5%) | 2mo | $220,000 | $179 | 52 |
| 10831 SE 50th Ter | 0.47mi | 2/2.0 (-1) | 1,239 (-4%) | 15mo | $203,000 | $164 | 50 |
| 5024 SE 107th Pl | 0.52mi | 2/2.0 (-1) | 1,419 (+10%) | 12mo | $204,000 | $144 | 41 |
| 10529 SE 50th Ave | 0.70mi | 2/2.0 (-1) | 1,367 (+6%) | 12mo | $194,000 | $142 | 39 |
| 5144 SE 106th St | 0.58mi | 3/2.0 | 1,204 (-7%) | 22mo | $185,000 | $154 | 39 |
Match score weights: distance 35% · size 25% · config 20% · recency 20%. Top-matched comps best support the ARV.
Projected returns pro-forma
-3.0% appreciation · 3.0% rent growth · sell at horizon
- IRR
- -15.1%
- Equity multiple
- 0.46×
- Total profit
- $-28,923
- Equity at exit
- $28,628
- IRR
- -6.6%
- Equity multiple
- 0.58×
- Total profit
- $-22,603
- Equity at exit
- $16,601
Cash invested: $53,760 (down + closing). Projections, not guarantees.
Landlord ↔ Tenant lean methodology
- Overall (STATE)
- 87 Strongly Landlord-Friendly
- State Florida
- 87 Strongly Landlord-Friendly · R+3
- County
- — inherits STATE
- City
- — inherits STATE
ZIP-level market 34420
- Home prices YoY
- -32.8%
- Active inventory
- 357
- Price-to-rent
- 10.7×
Monthly cashflow live
- Estimated rent
- $1,502 high interval (Pro) →
- Mortgage (P&I)
- −$1,007
- Tax from tax record
- −$64 /mo · $766/yr
- Insurance
- −$80
- HOA
- −$0
- Vacancy / Maint / Mgmt
- −$315
- Net cashflow
- $36
Break-even live
UW: 25.0% down · 7.5% · 30yr · 1.5% tax · 5.0% vac · 8.0% maint · 8.0% mgmt
Financing live
Cash to close
- Down payment
- $48,000
- Closing costs
- $5,760
- Reserves months
- —
- Total cash needed
- —
Loan-product check · same deal, 3 products live
Conventional
25% down · 7.5% · 30yr
- Down + closing
- —
- Monthly P&I
- —
- Monthly cashflow
- —
- DSCR
- —
- Eligible?
- —
Personal DTI + credit; lowest rate.
DSCR
20% down · 8.5% · 30yr
- Down + closing
- —
- Monthly P&I
- —
- Monthly cashflow
- —
- DSCR
- —
- Eligible?
- —
No personal income docs; deal must DSCR.
Hard money
10% down · 12.0% · 12mo
- Down + closing
- —
- Monthly P&I
- —
- Monthly cashflow
- —
- DSCR
- —
- Eligible?
- —
Short-term bridge; refi at stabilization.
Rent comps 6 comps
| Address | Beds | Baths | Sqft | Rent | $/sqft | DOM | Units | Dist |
|---|---|---|---|---|---|---|---|---|
| 11322 SE 55th Avenue Rd Belleview, FL | 2.0–3.0 | 1.0–2.0 | 1200 | $1,494 | $1.25 | 21d | 1 | 0.61mi |
| 10386 SE 52nd Ct Unit 11 Belleview, FL | 3.0 | 2.0 | 1207 | $1,395 | $1.16 | 13d | 1 | 0.76mi |
| 5151 SE 103rd Ln Unit 51514 Belleview, FL | 2.0 | 2.5 | 1008 | $1,395 | $1.38 | 21d | 1 | 0.80mi |
| 5151 SE 103rd Ln Unit 51513 Belleview, FL | 2.0 | 2.5 | 1008 | $1,450 | $1.44 | 13d | 1 | 0.80mi |
| 5890 SE 119th Pl Belleview, FL | 3.0 | 2.0 | 1144 | $1,449 | $1.27 | 21d | 1 | 0.97mi |
| 7208 SE 113th Pl Belleview, FL | 4.0 | 2.0 | 1828 | $2,200 | $1.20 | 21d | 1 | 1.43mi |
Listing history 25 events
-
2026-05-13status Pending
-
2026-04-20$192,000 Active
-
2022-12-31historical
-
2022-11-29price $215,000
-
2022-10-30status Active
-
2022-10-29status Pending
-
2022-10-21status Active
-
2022-10-17status Pending
-
2022-09-20price $220,000
-
2022-09-18price $224,900
-
2022-09-07$229,900 Active
-
2022-07-20status Pending
-
2022-07-20historical
-
2022-07-16$202,900 Active
-
2015-12-28soldstatus $59,800
-
2015-10-02$50,000
-
2015-06-19historical
-
2015-04-07$59,900
-
2015-02-24historical
-
2014-06-24$89,500
-
2010-03-30historical
-
2009-03-19$125,500
-
2008-02-28historical
-
2007-06-19$119,000
-
2005-06-08soldstatus $60,000
ⓘ Source: listings_history table (triggers on properties + properties_extension) + one-shot
backfill from property_details.listing_events for pre-trigger history.
Tax reassessment forecast FL · Resets to sale price
- Current annual tax
- $766 · $64/mo
- Projected year-2 tax
- $1,594 · $133/mo
- Expected delta
- +$828/yr (+$69/mo · 108.0%)
ⓘ Screening estimate from a state-policy table — verify with the county assessor before closing.
Climate risk First Street
- Flood 1/10 Low FEMA zone X (unshaded) · 0% chance over 30 yrs
- Wildfire 4/10 Moderate
- Heat 8/10 Severe 5 d/yr ≥109°F today · 13 d/yr by 30 yrs out
- Wind 9/10 Extreme 99% chance of damaging wind over 30 yrs
- Air quality 3/10 Moderate 3 unhealthy d/yr today · 4 by 30 yrs out
Nearby sold comps map
Loading sold comps map…
Walkable amenities ~0.75 mi
Loading nearby amenities…
Taxation est. · year 1
- Rental income
- $18,022
- − Mortgage interest
- −$10,755
- − Property taxes
- −$766
- − Insurance
- −$960
- − Repairs & maintenance
- −$1,442
- − Management
- −$1,442
- − Depreciation
- −$5,585
- Taxable loss
- −$2,928
- Est. tax savings @ 24.0%
- +$703
- After-tax cash flow
- $1,131/yr
For passive investors: Depreciation is non-cash, so a rental often shows a tax loss while cash-flowing — sheltering income. Rental losses are passive: they offset passive income freely, and up to $25,000/yr can offset ordinary (W-2) income if you actively participate and your MAGI is under $100k (phasing out to $0 by $150k); unused losses carry forward. On sale, claimed depreciation is recaptured at up to 25%, and gains may owe capital-gains tax (a 1031 exchange can defer both). Figures are a year-1 estimate at your 24.0% rate — not tax advice; consult a CPA.
Schools (NCES district)
- District
- Marion
- NCES district ID
- 1201260
- Math proficiency
- 42% ▼ -7.00%
- Reading proficiency
- 43% ▼ -4.00%
- Median HH income
- $40,015
- Composite
- 35.61/100
- National rank
- #4890
- State rank
- #61 of 73 in FL
Livability — Belleview
- Score
- 69/100
- State rank
- #458
- US rank
- #8314
Category grades
Schools grade is shown separately in the Schools card above.
Census & demographics
- Census place
- Belleview, FL
- City population
- 19,167
- Population (ZIP)
- 19,167
Population outlook (Marion County) Hauer SSP2
- Today (2025)
- 365,905 people
- By 2030
- 376,768 · +3.0%
- By 2040
- 396,555 · +8.4%
- By 2050
- 412,723 · +12.8%
- By 2075
- 446,090 · +21.9%
- By 2100
- 436,193 · +19.2%
Race, ethnicity, and origin ACS 2023
- Neighborhood character
- Predominantly White (81%)
- Race & ethnicity
- White 81% Hispanic / Latino 12% Two or more races 10% Black 1%
- Hispanic origin (detail)
- Puerto Rican 7% Cuban 2%
- Common ancestry
- Lithuanian 4% Iranian 2% Romanian 2%
- Foreign-born
- 5% · Canada, Jamaica
- Languages at home
- 89% English-only · Spanish 7% Other Indo-European 2% German/W. Germanic 1%
Political lean MEDSL · Marion
- 2024 margin
- Solid R (+31.6) · D 33.8% · R 65.5%
- 2008→2024 swing
- -20.0pp toward R · 2008: -11.6pp · 2024: -31.6pp
- All cycles
- 2024: R+31.6 2020: R+25.9 2016: R+26.2 2012: R+16.2 2008: R+11.6
Not yet ingested
- Civics
- —
Market trends
- HPI YoY
- ▼ -120.90%
- Current HPI
- 247.3176
- Rent YoY
- —
- Metro
- —
- State GDP YoY
- ▲ 3.28%
- F500 in state
- 36
Industry mix (Fortune 500 HQ in FL)
| Industry | F500 HQs | Revenue |
|---|---|---|
| Industrial Technology | 2 | $29B |
|
||
| Insurance | 2 | $17B |
|
||
| Retail | 1 | $60B |
|
||
| Technology Distribution | 1 | $58B |
|
||
| Homebuilding | 1 | $35B |
|
||
| Technology Manufacturing | 1 | $35B |
|
||
Price history
+220.0% since first listed25 events — show timeline
- 2026-05-13 Pending — Stellar MLS as Distributed by MLS Grid
- 2026-04-20 Listed $192,000 Stellar MLS as Distributed by MLS Grid
- 2022-12-31 Listing Removed — Stellar MLS as Distributed by MLS Grid
- 2022-11-29 Price Changed $215,000 Stellar MLS as Distributed by MLS Grid
- 2022-10-30 Relisted — Stellar MLS as Distributed by MLS Grid
- 2022-10-29 Pending — Stellar MLS as Distributed by MLS Grid
- 2022-10-21 Relisted — Stellar MLS as Distributed by MLS Grid
- 2022-10-17 Pending — Stellar MLS as Distributed by MLS Grid
- 2022-09-20 Price Changed $220,000 Stellar MLS as Distributed by MLS Grid
- 2022-09-18 Price Changed $224,900 Stellar MLS as Distributed by MLS Grid
- 2022-09-07 Listed $229,900 Stellar MLS as Distributed by MLS Grid
- 2022-07-20 Pending — Stellar MLS as Distributed by MLS Grid
- 2022-07-20 Listing Removed — Stellar MLS as Distributed by MLS Grid
- 2022-07-16 Listed $202,900 Stellar MLS as Distributed by MLS Grid
- 2015-12-28 Sold (MLS) $59,800 Stellar MLS as Distributed by MLS Grid
- 2015-10-02 Listed $50,000 Stellar MLS as Distributed by MLS Grid
- 2015-06-19 Listing Removed — Stellar MLS as Distributed by MLS Grid
- 2015-04-07 Listed $59,900 Stellar MLS as Distributed by MLS Grid
- 2015-02-24 Listing Removed — Stellar MLS as Distributed by MLS Grid
- 2014-06-24 Listed $89,500 Stellar MLS as Distributed by MLS Grid
- 2010-03-30 Listing Removed — Stellar MLS as Distributed by MLS Grid
- 2009-03-19 Listed $125,500 Stellar MLS as Distributed by MLS Grid
- 2008-02-28 Listing Removed — Stellar MLS as Distributed by MLS Grid
- 2007-06-19 Listed $119,000 Stellar MLS as Distributed by MLS Grid
- 2005-06-08 Sold (Public Records) $60,000 Public Records
Property tax history
+2.1%/yrLatest (2025): $766 · +13.6% YoY. Source: county tax records.
Cash-flow waterfall
monthlySold comps — $/sqft
last 12 mo · ≤1 miLoading sold comps…