 Multi-family
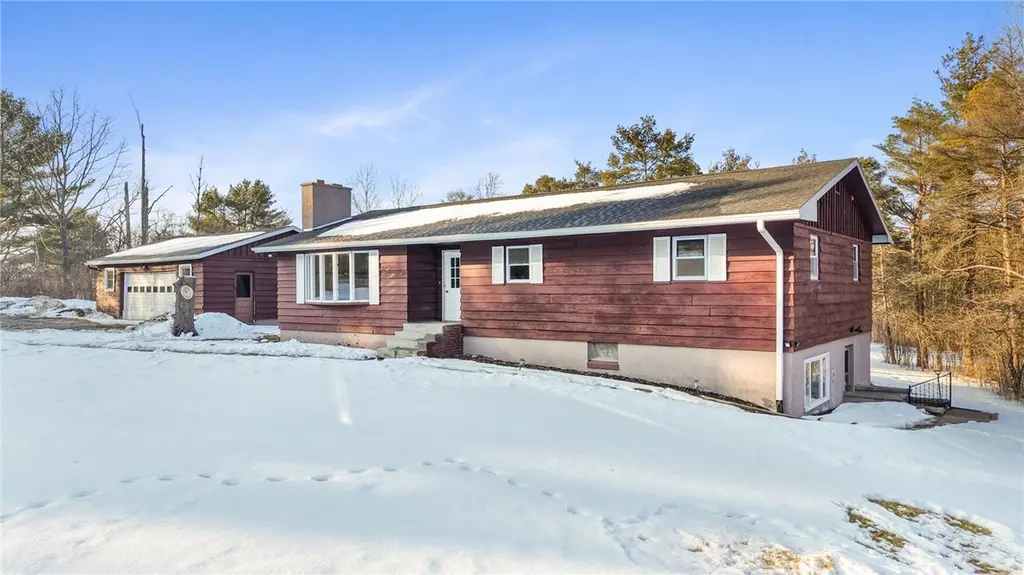
322 Nelson Rd · South Hill, NY
Flood risk 1/10 · Minimal
- FEMA flood zone
- X
- Chance of flooding over 30 yrs
- 0.0%
- Est. flood insurance / yr
- $473 – $860
Fire risk 3/10 · Minor
- Est. fire insurance / yr
- $691 – $1,283
Heat risk 2/10 · Minimal
- Hot days now (above 91°F)
- 7 days/yr
- Hot days in 30 yrs
- 14 days/yr
Wind risk 2/10 · Minimal
- Chance of severe wind over 30 yrs
- 1.0%
Air-quality risk 2/10 · Minimal
- Unhealthy air days now
- 0 days/yr
- Unhealthy air days in 30 yrs
- 1 days/yr
Risk factors via First Street. Map © Google.
Why this score? — see what drove the D- grade
The composite is a weighted blend of 9 inputs, each scored 0–100. Each bar is that input's sub-score; the figure is the points it added to the 100-point composite (weight × sub-score).
- Cash flow +15.7/30.0
- Schools +5.4/10.0
- DSCR +4.9/10.0
- 1% rule +4.1/10.0
- Rent growth +3.8/5.0
- Livability +3.5/5.0
- Condition / age +2.5/5.0
- ARV discount +0.0/15.0
- Appreciation +0.0/10.0
$545,000
🖨 Deal sheet 📄 Offer letter ✓ Due diligence
Multi-family units
County records classify this as Multi-Family (2-4 Unit). Listing-text estimate: 1 unit. estimate disagrees with records
Listing remarks MLS
Welcome to this versatile South Hill property offering 2,047 sq ft of well-designed living space set on 1.68 acres of peaceful, private land. Combining comfortable first-floor living with built-in income potential, this property is ideal for owner-occupants, multigenerational living, or investors alike. The main residence features 3 bedrooms and 2 full baths on the first floor, providing convenient single-level living with a functional layout and inviting living spaces filled with natural light. In addition, the property includes a separate 1 bedroom, 1 full bath apartment, creating an excellent income-producing opportunity or private guest suite. The apartment also includes a spacious bonus room—perfect for a home office, gym, media room, or additional flex space to fit your needs. Enjoy the best of both privacy and convenience in the desirable South Hill neighborhood, located just 8 minutes to Ithaca’s Downtown Commons, 5 minutes to Ithaca College, and 9 minutes to Cornell’s campus—making commuting, dining, and entertainment easily accessible. With acreage, flexibility, and prime proximity to Ithaca’s key destinations, this property offers exceptional value and opportunity.
Key facts
- Private land
- Income potential
- Separate apartment
Tags
Neighborhood map
What this means for you Summary
Snapshot
- This is a 4-bed/3.0-bath multifamily listed at $545k.
Deal economics
- At list price, monthly cash flow is $244 ($3k/yr) — positive.
- The deal already cash-flows at list — no discount required.
- To meet the 1% rule (rent ≥ 1% of price), the offer needs to be $496k (9.0% below list).
- Recommended offer: $496k (9.0% below list) — sets the bar for 1% rule.
Location & tenants
- Location reads 69/100 on livability (#471 in NY) — a middle-class / working-renter tenant base. Strengths: employment A+, housing A+; Watch: schools C-, crime D+, cost of living D+.
- Ithaca City School District (urban): math 57% / reading 71% proficiency, ranked #195 of 590 in NY (top 33%) — acceptable for families but not a draw, mixed tenant base, ~2y average lease.
- Market conditions: Rents rising fast (+5.2%/yr); 327 active listings in the ZIP; 382 units permitted in Tompkins County in 2024 (208 in 5+ unit buildings).
- At $4,958/mo this rent would consume 83% of the median local household income ($71k/yr) (locally 5169% of renters already pay >50% of income on rent) — very limited rent-growth headroom before tenants either downsize or default.
Forward outlook
- Local home prices are declining (-3.0%/yr); year-one equity from $4k of loan paydown is wiped out by about $16k of value loss. Plan a longer hold.
- Tompkins County population projected at +17% by 2050 — long-run rental-demand tailwind backs the buy-and-hold thesis.
Negotiation context
- It's been on market 120 days — a 9% lower offer ($496k) is reasonable based on typical stale-listing flexibility.
- 3 sale attempts since 11y ago with the ask held roughly flat each time — persistent listings suggest the price (not the market) is what's stuck; bring a comps-based counter.
- Current owner paid $350k; list at $545k implies a 56% gain — meaningful room to come down on a strong offer.
Questions for the listing agent
- It's been on market 120 days. Have you received any prior offers? Is the seller open to a 9% concession, seller financing, or rate buy-down credit?
- Why hasn't it sold? Are there any deal-killer items the seller is aware of (foundation, flood, title, zoning, code violations)?
- Is there a deadline driving the sale (1031 exchange, divorce, estate, relocation)? That informs how much negotiation room exists.
- Crime grade is D in this area — have there been break-ins, vandalism, or insurance claims at this property in the last 3 years? What carrier currently insures it and at what premium?
- The area grade is low — what's the realistic commute time and amenity access for the typical tenant pool here? Any planned neighborhood developments (good or bad) we should know about?
- What's the average days-on-market for RENTAL listings here right now (not sales)? A rising rental-DOM trend means longer vacancies and softer asking-rent achievability than the comps imply.
- What's the recent tenant-quality profile in this submarket — average credit score on applications, eviction rate, late-payment / NSF rate, and stable-employment percentage? A property-management company in the area should have these aggregated.
- How much new apartment / multifamily construction is in the pipeline within 1–3 miles? Heavy new supply (>2% of stock underway) typically softens rents 12–24 months out; light construction supports rent growth.
Investment metrics
- 1% rule
- 0.91% ✗
- Cap rate
- 6.83%
- Cash-on-cash
- 1.92%
- DSCR
- 1.09
- GRM
- 9.2
CMA / ARV
- ARV (median comp)
- $453,794
- List price
- $545,000
- Delta
- 20.10%
- Verdict
- OVERPRICED
- Comps
- 6 within 1.0 mi
Projected returns pro-forma
-3.0% appreciation · 5.22% rent growth · sell at horizon
- IRR
- -10.8%
- Equity multiple
- 0.60×
- Total profit
- $-61,443
- Equity at exit
- $81,261
- IRR
- 1.3%
- Equity multiple
- 1.10×
- Total profit
- $15,180
- Equity at exit
- $47,122
Cash invested: $152,600 (down + closing). Projections, not guarantees.
Landlord ↔ Tenant lean methodology
- Overall (STATE)
- 15 Strongly Tenant-Friendly
- State New York
- 15 Strongly Tenant-Friendly · D+10
- County
- — inherits STATE
- City
- — inherits STATE
ZIP-level market 14850
- Rents YoY
- 5.2%
- Active inventory
- 327
- Price-to-rent
- 22.2×
Monthly cashflow live
- Estimated rent
- $4,958 medium interval (Pro) →
- Mortgage (P&I)
- −$2,858
- Tax from tax record
- −$588 /mo · $7,054/yr
- Insurance
- −$227
- HOA
- −$0
- Vacancy / Maint / Mgmt
- −$1,041
- Net cashflow
- $244
Break-even live
3-unit breakdown (identical units grouped — click to expand)
| Units | Beds | Baths | Est. rent |
|---|---|---|---|
| 1× unit | 3 | 2 | $2,044 |
| 1× unit | 1 | 1 | $1,531 |
| 1× unit | 0 | 0 | $1,382 |
| Total (3 units) | $4,958 | ||
UW: 25.0% down · 7.5% · 30yr · 1.5% tax · 5.0% vac · 8.0% maint · 8.0% mgmt
Financing live
Cash to close
- Down payment
- $136,250
- Closing costs
- $16,350
- Reserves months
- —
- Total cash needed
- —
Loan-product check · same deal, 3 products live
Conventional
25% down · 7.5% · 30yr
- Down + closing
- —
- Monthly P&I
- —
- Monthly cashflow
- —
- DSCR
- —
- Eligible?
- —
Personal DTI + credit; lowest rate.
DSCR
20% down · 8.5% · 30yr
- Down + closing
- —
- Monthly P&I
- —
- Monthly cashflow
- —
- DSCR
- —
- Eligible?
- —
No personal income docs; deal must DSCR.
Hard money
10% down · 12.0% · 12mo
- Down + closing
- —
- Monthly P&I
- —
- Monthly cashflow
- —
- DSCR
- —
- Eligible?
- —
Short-term bridge; refi at stabilization.
Listing history 22 events
-
2026-06-19days on market $545,000 Active 120 DOM
-
2026-06-18days on market $545,000 Active 119 DOM
-
2026-06-17days on market $545,000 Active 118 DOM
-
2026-06-16days on market $545,000 Active 117 DOM
-
2026-06-15days on market $545,000 Active 116 DOM
-
2026-06-14days on market $545,000 Active 114 DOM
-
2026-06-13days on market $545,000 Active 113 DOM
-
2026-06-10days on market $545,000 Active 111 DOM
-
2026-06-09days on market $545,000 Active 110 DOM
-
2026-06-08days on market $545,000 Active 109 DOM
-
2026-06-07days on market $545,000 Active 108 DOM
-
2026-06-05days on market $545,000 Active 105 DOM
-
2026-06-02days on market $545,000 Active 103 DOM
-
2026-06-01days on market $545,000 Active 102 DOM
-
2026-05-31days on market $545,000 Active 101 DOM
-
2026-05-30days on market $545,000 Active 100 DOM
-
2026-02-19$545,000 Active 1224-char remark
Show marketing remark (1224 chars)
Welcome to this versatile South Hill property offering 2,047 sq ft of well-designed living space set on 1.68 acres of peaceful, private land. Combining comfortable first-floor living with built-in income potential, this property is ideal for owner-occupants, multigenerational living, or investors alike. The main residence features 3 bedrooms and 2 full baths on the first floor, providing convenient single-level living with a functional layout and inviting living spaces filled with natural light. In addition, the property includes a separate 1 bedroom, 1 full bath apartment, creating an excellent income-producing opportunity or private guest suite. The apartment also includes a spacious bonus room—perfect for a home office, gym, media room, or additional flex space to fit your needs. Enjoy the best of both privacy and convenience in the desirable South Hill neighborhood, located just 8 minutes to Ithaca’s Downtown Commons, 5 minutes to Ithaca College, and 9 minutes to Cornell’s campus—making commuting, dining, and entertainment easily accessible. With acreage, flexibility, and prime proximity to Ithaca’s key destinations, this property offers exceptional value and opportunity.
-
2022-05-12price $2,200
-
2020-08-05soldstatus $350,000
-
2016-03-23$229,000
-
2015-08-10$239,000
-
2014-07-11soldstatus $135,000
ⓘ Source: listings_history table (triggers on properties + properties_extension) + one-shot
backfill from property_details.listing_events for pre-trigger history.
Tax reassessment forecast NY · Partial reset (capped growth)
- Current annual tax
- $7,054 · $588/mo
- Projected year-2 tax
- $8,132 · $678/mo
- Expected delta
- +$1,078/yr (+$90/mo · 15.3%)
ⓘ Screening estimate from a state-policy table — verify with the county assessor before closing.
Climate risk First Street
- Flood 1/10 Low FEMA zone X · 0% chance over 30 yrs
- Wildfire 3/10 Moderate
- Heat 2/10 Low 7 d/yr ≥91°F today · 14 d/yr by 30 yrs out
- Wind 2/10 Low 100% chance of damaging wind over 30 yrs
- Air quality 2/10 Low 0 unhealthy d/yr today · 1 by 30 yrs out
Nearby sold comps map
Loading sold comps map…
Walkable amenities ~0.75 mi
Loading nearby amenities…
Taxation est. · year 1
- Rental income
- $59,496
- − Mortgage interest
- −$30,528
- − Property taxes
- −$7,054
- − Insurance
- −$2,725
- − Repairs & maintenance
- −$4,760
- − Management
- −$4,760
- − Depreciation
- −$15,855
- Taxable loss
- −$6,185
- Est. tax savings @ 24.0%
- +$1,484
- After-tax cash flow
- $4,411/yr
For passive investors: Depreciation is non-cash, so a rental often shows a tax loss while cash-flowing — sheltering income. Rental losses are passive: they offset passive income freely, and up to $25,000/yr can offset ordinary (W-2) income if you actively participate and your MAGI is under $100k (phasing out to $0 by $150k); unused losses carry forward. On sale, claimed depreciation is recaptured at up to 25%, and gains may owe capital-gains tax (a 1031 exchange can defer both). Figures are a year-1 estimate at your 24.0% rate — not tax advice; consult a CPA.
Schools (NCES district)
- District
- Ithaca City School District
- NCES district ID
- 3615570
- Math proficiency
- 57% ▼ -5.00%
- Reading proficiency
- 71% ▲ 11.00%
- Median HH income
- $46,528
- Composite
- 54.01/100
- National rank
- #1397
- State rank
- #195 of 590 in NY
Livability — South Hill
- Score
- 69/100
- State rank
- #471
- US rank
- #8329
Category grades
Schools grade is shown separately in the Schools card above.
Census & demographics
- County
- Tompkins County · 68,610 people
- City population
- 68,610
- Metro
- Ithaca, NY
- Population (ZIP)
- 68,610
- Household income
- $71,445
- Rent vs Own
- Severe rent burden
- 5169.0
Population outlook (Tompkins County) Hauer SSP2
- Today (2025)
- 113,958 people
- By 2030
- 118,774 · +4.2%
- By 2040
- 125,927 · +10.5%
- By 2050
- 133,599 · +17.2%
- By 2075
- 156,759 · +37.6%
- By 2100
- 169,896 · +49.1%
Race, ethnicity, and origin ACS 2023
- Neighborhood character
- Predominantly White (68%)
- Race & ethnicity
- White 68% Asian 13% Hispanic / Latino 8% Two or more races 8% Black 4%
- Hispanic origin (detail)
- Mexican 2% Puerto Rican 2%
- Common ancestry
- Romanian 3% Italian 3% Scotch-Irish 2%
- Foreign-born
- 18% · China, Canada, South Korea
- Languages at home
- 79% English-only · Chinese 5% Spanish 4% Other Indo-European 4%
Political lean MEDSL · Tompkins
- 2024 margin
- Solid D (+50.6) · D 75.3% · R 24.7%
- 2008→2024 swing
- +8.6pp toward D · 2008: 42.1pp · 2024: 50.6pp
- All cycles
- 2024: D+50.6 2020: D+49.2 2016: D+42.1 2012: D+39.8 2008: D+42.1
Not yet ingested
- Civics
- —
Market trends
- HPI YoY
- ▼ -276.59%
- Current HPI
- 389.7215
- Rent YoY
- ▲ 5.22%
- Metro
- Ithaca, NY
- State GDP YoY
- ▲ 2.60%
- F500 in state
- 92
Industry mix (Fortune 500 HQ in NY)
| Industry | F500 HQs | Revenue |
|---|---|---|
| Financial Services | 10 | $950B |
|
||
| Consumer Goods | 9 | $162B |
|
||
| Insurance | 4 | $225B |
|
||
| Telecommunications | 2 | $144B |
|
||
| Pharmaceuticals | 2 | $112B |
|
||
| Media / Entertainment | 2 | $69B |
|
||
Price history
+303.7% since first listed6 events — show timeline
- 2026-02-19 Listed $545,000 IBRMLS
- 2022-05-12 Price Changed $2,200 RENT.
- 2020-08-05 Sold (Public Records) $350,000 Public Records
- 2016-03-23 Listed $229,000 IBRMLS
- 2015-08-10 Listed $239,000 IBRMLS
- 2014-07-11 Sold (Public Records) $135,000 Public Records
Property tax history
+1.2%/yrLatest (2025): $7,054 · +1.6% YoY. Source: county tax records.
Cash-flow waterfall
monthlySold comps — $/sqft
last 12 mo · ≤1 miLoading sold comps…