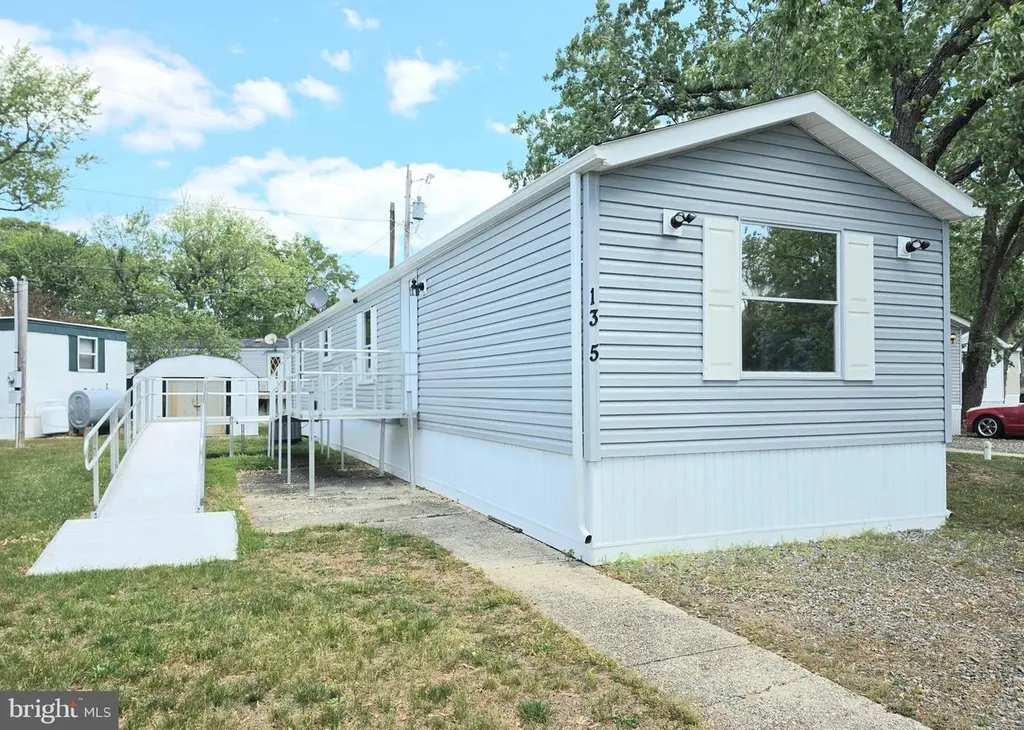
10505 Cedarville Unit 13-5 · Cedarville, MD
Flood risk 1/10 · Minimal
- FEMA flood zone
- X (unshaded)
- Chance of flooding over 30 yrs
- 0.0%
- Est. flood insurance / yr
- $473 – $860
Fire risk 6/10 · Moderate
- Est. fire insurance / yr
- $755 – $1,403
Heat risk 7/10 · Major
- Hot days now (above 102°F)
- 7 days/yr
- Hot days in 30 yrs
- 16 days/yr
Wind risk 5/10 · Moderate
- Chance of severe wind over 30 yrs
- 25.0%
Air-quality risk 3/10 · Minor
- Unhealthy air days now
- 2 days/yr
- Unhealthy air days in 30 yrs
- 3 days/yr
Risk factors via First Street. Map © Google.
Why this score? — see what drove the C- grade
The composite is a weighted blend of 9 inputs, each scored 0–100. Each bar is that input's sub-score; the figure is the points it added to the 100-point composite (weight × sub-score).
- Cash flow +15.0/30.0
- ARV discount +15.0/15.0
- 1% rule +5.0/10.0
- DSCR +5.0/10.0
- Condition / age +4.0/5.0
- Livability +2.9/5.0
- Rent growth +2.5/5.0
- Schools +1.7/10.0
- Appreciation +0.0/10.0
$55,000
🖨 Deal sheet 📄 Offer letter ✓ Due diligence
Listing remarks
Welcome to this inviting 2-bedroom, 1-bath mobile home in Brandywine, offering comfort, convenience, and standout features! Designed with accessibility in mind, this home includes widened doorways, an accessible ramp, accessible shower, and bidet. Enjoy the added bonus of a private sauna located in the living room—your own personal retreat at home. A rare find with both functionality and unique amenities!
Key facts
- 2 parking spots
- Built 1998
- Listed 33 days
Property features AI
Finance
- Other: Property manager present
- Financial info: Land lease: $1,158 monthly; Land lease years remaining: 100
Exterior
- Parking: Driveway parking; 2 driveway spaces (2 total garage/parking spaces)
- Utilities: Public water; Public sewer; Electric power
- Home design: Manufactured home (single wide); Land lease ownership (monthly land lease); Estimated year built
- Construction: Single wide manufactured construction
- Exterior features: Shed; Above-grade other structures
Interior
- Bedrooms: 2 bedrooms on the main level
- Bathrooms: 1 full bathroom on the main level
- Heating & cooling: Central heating; Propane (leased or owned); Central air conditioning; Electric hot water
- Interior features: Sauna; No basement
- Laundry & utility: Washer and dryer in unit; Main-floor laundry
Neighborhood map
What this means for you Summary
Snapshot
- This is a 2-bed/1.0-bath single-family listed at $55k. Condition is rated good.
Deal economics
- At list price, monthly cash flow is $1k ($17k/yr) — positive.
- The deal already cash-flows at list — no discount required.
- Meets the 1% rule at list price ($2k rent vs $55k).
- Recommended offer: $53k (3.0% below list) — sets the bar for market timing.
Location & tenants
- Location reads 57/100 on livability (#399 in MD) — a working-class tenant base; expect higher turnover. Strengths: employment A+, crime A, cost of living B; Watch: schools F, amenities F, commute F.
- Prince George'S County Public Schools (suburban): math 8% / reading 24% proficiency, ranked #21 of 24 in MD (top 88%) — low school quality limits family demand, transient renter base, plan for 1-2y turnover.
- Market conditions: 216 active listings in the ZIP; high-income renter base; 1,481 units permitted in Prince George's County in 2024 (0 in 5+ unit buildings).
Forward outlook
- Local home prices are declining (-3.0%/yr); year-one equity from $380 of loan paydown is wiped out by about $2k of value loss. Plan a longer hold.
- Prince George's County population projected at +18% by 2050 — long-run rental-demand tailwind backs the buy-and-hold thesis.
- At projected returns (-3.0% appreciation + 3.0% rent growth), your $15k cash investment doubles in ~1 year — after that, you're playing with house money.
Negotiation context
- It's been on market 33 days — a 3% lower offer ($53k) is reasonable based on typical stale-listing flexibility.
Risks & watch-outs
- Climate carrying-cost: moderate wind risk, 25% chance of damaging wind over 30y; major wildfire risk; extreme-heat days projected 7→16/yr by 2055 (HVAC capex compounding) — expect insurance premiums to compound above CPI over the hold.
Questions for the listing agent
- It's been on market 33 days. Have you received any prior offers? Is the seller open to a 3% concession, seller financing, or rate buy-down credit?
- Is there a deadline driving the sale (1031 exchange, divorce, estate, relocation)? That informs how much negotiation room exists.
- Schools are F-rated, which usually means shorter tenancies and higher turnover. Who's the typical renter profile here, and what's been the actual vacancy rate?
- What's the average days-on-market for RENTAL listings here right now (not sales)? A rising rental-DOM trend means longer vacancies and softer asking-rent achievability than the comps imply.
- What's the recent tenant-quality profile in this submarket — average credit score on applications, eviction rate, late-payment / NSF rate, and stable-employment percentage? A property-management company in the area should have these aggregated.
- How much new for-sale + rental construction is in the pipeline within 1–3 miles? Heavy new supply typically softens prices + rents 12–24 months out; constrained supply supports both.
Investment metrics
- 1% rule
- 4.20% ✓
- Cap rate
- 37.81%
- Cash-on-cash
- 112.56%
- DSCR
- 6.01
- GRM
- 2.0
CMA / ARV
- ARV (median comp)
- $67,182
- List price
- $55,000
- Delta
- -18.13%
- Verdict
- UNDERPRICED
- Comps
- 20 within 1.0 mi
Show comp detail 10 sales within ~0.75 mi
| Address | Dist | Beds/Ba | Sqft | Sold | Price | $/sf | Match |
|---|---|---|---|---|---|---|---|
| 10505 Cedarville Unit 13-5 | 0.00mi | 2/1.0 | 1,000 (0%) | 0mo | $52,000 | $52 | 100 |
| 10505 Cedarville Rd Unit 3-14 | 0.00mi | 2/1.0 | 1,000 (0%) | 3mo | $60,000 | $60 | 97 |
| 10505 Cedarville Rd Unit 3-10 | 0.00mi | 3/1.0 (+1) | 1,000 (0%) | 2mo | $63,000 | $63 | 93 |
| 10505 Cedarville Rd Unit 10-19 | 0.00mi | 2/2.0 | 980 (-2%) | 2mo | $20,000 | $20 | 91 |
| 10505 Cedarville Rd Unit 5-4 | 0.00mi | 2/1.0 | 980 (-2%) | 9mo | $55,000 | $56 | 90 |
| 10505 Cedarville Rd Unit 10-14 | 0.00mi | 2/2.0 | 982 (-2%) | 10mo | $65,000 | $66 | 85 |
| 10505 Cedarville Rd Unit 11-16 | 0.01mi | 2/2.0 | 924 (-8%) | 13mo | $55,000 | $60 | 72 |
| 10505 Cedarville Rd Unit 8-4 | 0.00mi | 2/1.5 | 868 (-13%) | 18mo | $63,000 | $73 | 61 |
| 10505 Cedarville Rd Unit 2-17 | 0.00mi | 2/2.0 | 868 (-13%) | 17mo | $69,000 | $79 | 59 |
| 10505 Cedarville Unit 10-7 | 0.00mi | 2/2.0 | 850 (-15%) | 20mo | $65,000 | $76 | 54 |
Match score weights: distance 35% · size 25% · config 20% · recency 20%. Top-matched comps best support the ARV.
Projected returns pro-forma
-3.0% appreciation · 3.0% rent growth · sell at horizon
- IRR
- —
- Equity multiple
- 6.40×
- Total profit
- $83,123
- Equity at exit
- $8,201
- IRR
- —
- Equity multiple
- 13.40×
- Total profit
- $190,990
- Equity at exit
- $4,755
Cash invested: $15,400 (down + closing). Projections, not guarantees.
Landlord ↔ Tenant lean methodology
- Overall (STATE)
- 27 Tenant-Leaning
- State Maryland
- 27 Tenant-Leaning · D+14
- County
- — inherits STATE
- City
- — inherits STATE
ZIP-level market 20613
- Home prices YoY
- -29.0%
- Active inventory
- 216
- Price-to-rent
- 2.0×
Monthly cashflow live
- Estimated rent
- $2,310 medium interval (Pro) →
- Mortgage (P&I)
- −$288
- Tax est. 1.5%
- −$69 /mo · $825/yr
- Insurance
- −$23
- HOA
- −$0
- Vacancy / Maint / Mgmt
- −$485
- Net cashflow
- $1,444
Break-even live
UW: 25.0% down · 7.5% · 30yr · 1.5% tax · 5.0% vac · 8.0% maint · 8.0% mgmt
Financing live
Cash to close
- Down payment
- $13,750
- Closing costs
- $1,650
- Reserves months
- —
- Total cash needed
- —
Loan-product check · same deal, 3 products live
Conventional
25% down · 7.5% · 30yr
- Down + closing
- —
- Monthly P&I
- —
- Monthly cashflow
- —
- DSCR
- —
- Eligible?
- —
Personal DTI + credit; lowest rate.
DSCR
20% down · 8.5% · 30yr
- Down + closing
- —
- Monthly P&I
- —
- Monthly cashflow
- —
- DSCR
- —
- Eligible?
- —
No personal income docs; deal must DSCR.
Hard money
10% down · 12.0% · 12mo
- Down + closing
- —
- Monthly P&I
- —
- Monthly cashflow
- —
- DSCR
- —
- Eligible?
- —
Short-term bridge; refi at stabilization.
Listing history 5 events
-
2026-06-02status $55,000 Pending 33 DOM
-
2026-06-01days on market $55,000 Active 33 DOM
-
2026-05-31days on market $55,000 Active 32 DOM
-
2026-04-30$60,000 Active 414-char remark
-
2026-04-30historical $60,000 414-char remark
ⓘ Source: listings_history table (triggers on properties + properties_extension) + one-shot
backfill from property_details.listing_events for pre-trigger history.
Climate risk First Street
- Flood 1/10 Low FEMA zone X (unshaded) · 0% chance over 30 yrs
- Wildfire 6/10 Major
- Heat 7/10 Severe 7 d/yr ≥102°F today · 16 d/yr by 30 yrs out
- Wind 5/10 Major 25% chance of damaging wind over 30 yrs
- Air quality 3/10 Moderate 2 unhealthy d/yr today · 3 by 30 yrs out
Nearby sold comps map
Loading sold comps map…
Walkable amenities ~0.75 mi
Loading nearby amenities…
Taxation est. · year 1
- Rental income
- $27,715
- − Mortgage interest
- −$3,081
- − Property taxes
- −$825
- − Insurance
- −$275
- − Repairs & maintenance
- −$2,217
- − Management
- −$2,217
- − Depreciation
- −$1,600
- Taxable income
- $17,500
- Est. tax owed @ 24.0%
- −$4,200
- After-tax cash flow
- $13,134/yr
For passive investors: Depreciation is non-cash, so a rental often shows a tax loss while cash-flowing — sheltering income. Rental losses are passive: they offset passive income freely, and up to $25,000/yr can offset ordinary (W-2) income if you actively participate and your MAGI is under $100k (phasing out to $0 by $150k); unused losses carry forward. On sale, claimed depreciation is recaptured at up to 25%, and gains may owe capital-gains tax (a 1031 exchange can defer both). Figures are a year-1 estimate at your 24.0% rate — not tax advice; consult a CPA.
Condition & rehab AI · 12 photos
This mobile home is in good condition with modern updates and accessible features. It offers a good return on investment with minor updates to enhance curb appeal and interior comfort.
Value-add opportunities
- Both Paint exterior siding — Enhances curb appeal and value
- Both Replace carpet in bedrooms — Improves comfort and appearance
- Both Install new kitchen backsplash — Modernizes kitchen and adds value
Renovation cost estimate screening
Value-add ROI direction
- Both Paint exterior siding — Enhances curb appeal and value ↑
- Both Replace carpet in bedrooms — Improves comfort and appearance ↑
- Both Install new kitchen backsplash — Modernizes kitchen and adds value ↑
ⓘ Cost ranges are severity-bucket heuristics (US national rule-of-thumb). Get contractor quotes + a written scope before underwriting a rehab budget.
Schools (NCES district)
- District
- Prince George'S County Public Schools
- NCES district ID
- 2400510
- Math proficiency
- 8% ▼ -11.00%
- Reading proficiency
- 24% ▼ -9.00%
- Median HH income
- $73,967
- Composite
- 16.82/100
- National rank
- #9151
- State rank
- #21 of 24 in MD
Livability — Cedarville
- Score
- 57/100
- State rank
- #399
- US rank
- #21965
Category grades
Schools grade is shown separately in the Schools card above.
Census & demographics
- Census place
- Cedarville, MD
- County
- Prince Georges County · 919,866 people
- City population
- 15,923
- Metro
- Washington-Arlington-Alexandria, DC-VA-MD-WV
- Population (ZIP)
- 17,590
- Household income
- $151,422
- Rent vs Own
Population outlook (Prince George's County) Hauer SSP2
- Today (2025)
- 1,005,426 people
- By 2030
- 1,048,416 · +4.3%
- By 2040
- 1,123,425 · +11.7%
- By 2050
- 1,183,220 · +17.7%
- By 2075
- 1,306,202 · +29.9%
- By 2100
- 1,408,179 · +40.1%
Race, ethnicity, and origin ACS 2023
- Neighborhood character
- Predominantly Black (66%)
- Race & ethnicity
- Black 66% White 20% Hispanic / Latino 7% Two or more races 7% Asian 2%
- Hispanic origin (detail)
- Puerto Rican 2%
- Common ancestry
- Lithuanian 1% Iranian 1% Italian 1%
- Foreign-born
- 7% · Canada, Vietnam, United Kingdom
- Languages at home
- 91% English-only · Spanish 3% French/Haitian/Cajun 2%
Political lean MEDSL · Prince George's
- 2024 margin
- Solid D (+75.2) · D 86.3% · R 11.2% · Other 2.5%
- 2008→2024 swing
- -3.3pp toward R · 2008: 78.5pp · 2024: 75.2pp
- All cycles
- 2024: D+75.2 2020: D+80.5 2016: D+81.0 2012: D+80.9 2008: D+78.5
Not yet ingested
- Civics
- —
Market trends
- HPI YoY
- ▼ -101.19%
- Current HPI
- 247.5504
- Rent YoY
- —
- Metro
- Washington-Arlington-Alexandria, DC-VA-MD-WV
- State GDP YoY
- ▲ 2.97%
- F500 in state
- 12
Industry mix (Fortune 500 HQ in MD)
| Industry | F500 HQs | Revenue |
|---|---|---|
| Aerospace / Defense | 1 | $71B |
|
||
| Utilities | 1 | $25B |
|
||
| Hotels | 1 | $24B |
|
||
| Consumer Goods | 1 | $7B |
|
||
| Real Estate | 1 | $6B |
|
||
| Chemicals | 1 | $2B |
|
||
Price history
-13.3% since first listed5 events — show timeline
- 2026-06-08 Sold (MLS) $52,000 BRIGHT MLS
- 2026-06-02 Pending — BRIGHT MLS
- 2026-05-22 Price Changed $55,000 BRIGHT MLS
- 2026-04-30 Listed $60,000 BRIGHT MLS
- 2026-04-30 Coming Soon $60,000 BRIGHT MLS
Cash-flow waterfall
monthlySold comps — $/sqft
last 12 mo · ≤1 miLoading sold comps…