 Duplex
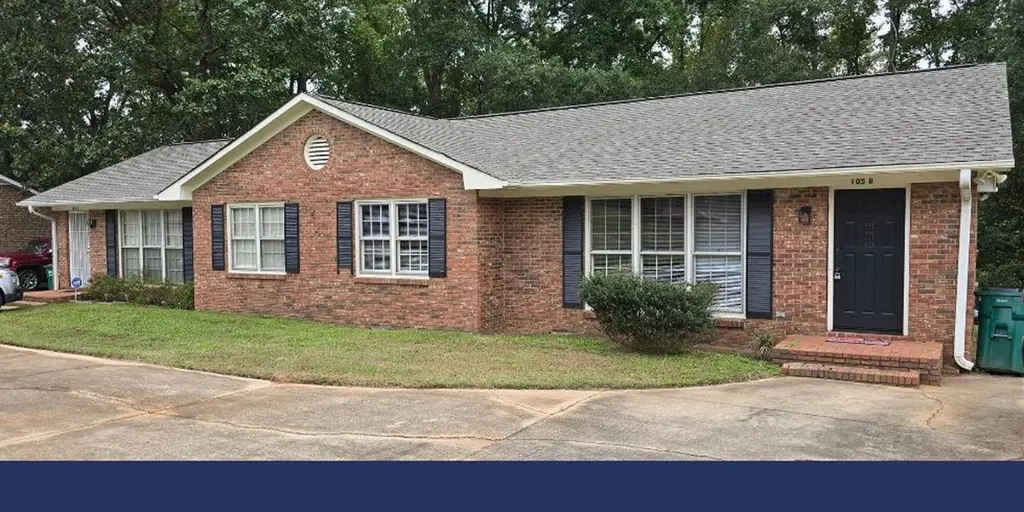
105 Colebrook Ct Unit *** · Boiling Springs, SC
Flood risk 1/10 · Minimal
- FEMA flood zone
- X (unshaded)
- Chance of flooding over 30 yrs
- 0.0%
- Est. flood insurance / yr
- $507 – $1,088
Fire risk 4/10 · Minor
- Est. fire insurance / yr
- $783 – $1,453
Heat risk 6/10 · Moderate
- Hot days now (above 105°F)
- 7 days/yr
- Hot days in 30 yrs
- 17 days/yr
Wind risk 2/10 · Minimal
- Chance of severe wind over 30 yrs
- 2.0%
Air-quality risk 4/10 · Minor
- Unhealthy air days now
- 4 days/yr
- Unhealthy air days in 30 yrs
- 4 days/yr
Risk factors via First Street. Map © Google.
Why this score? — see what drove the C- grade
The composite is a weighted blend of 9 inputs, each scored 0–100. Each bar is that input's sub-score; the figure is the points it added to the 100-point composite (weight × sub-score).
- Cash flow +19.6/30.0
- ARV discount +7.5/15.0
- DSCR +6.2/10.0
- 1% rule +4.7/10.0
- Schools +4.5/10.0
- Livability +3.9/5.0
- Rent growth +2.7/5.0
- Condition / age +2.5/5.0
- Appreciation +0.0/10.0
$270,000
🖨 Deal sheet (PDF) 📄 Offer letter ✓ Due diligence
Multi-family units
County records classify this as Multi-Family (2-4 Unit). Listing-text estimate: 2 units. confirmed
Listing remarks
Investor Opportunity – Turnkey Duplex! Welcome to 105 Colebrook Court in Boiling Springs— a well-maintained duplex. It was recently remodeled in 2025 with new LVP Flooring, new bath Granite counter tops, and new faucets on bath and kitchen sinks and was freshly painted. Unit has a large great room and a separate Kitchen with new granite counter tops. The master bedroom features a walk-in closet and ceiling fan. A second bedroom also has a ceiling fan. Unit features a rear patio. Whether you're looking to expand your rental portfolio or step into your first investment property, this duplex offers strong income potential in a high-demand Boiling Springs rental area. Don’t m
Key facts
- Remodeled
- Turnkey duplex
- New faucets
Tags
Property features AI
Exterior
- Utilities: Public water; Public sewer
- Home design: Duplex residential income property; One-level
- Construction: Brick veneer exterior
- Exterior features: Composition roof
Interior
- Heating & cooling: Forced air heating; Heat pump (heating & cooling); Electric cooling
- Interior features: Electric water heater; Central air conditioning; Heat pump
Neighborhood map
What this means for you Summary
Snapshot
- This is a 2 × 2-bed/1-bath units multifamily listed at $270k.
Deal economics
- At list price, monthly cash flow is $311 ($4k/yr) — positive. Per door: $155/mo.
- The deal already cash-flows at list — no discount required.
- To meet the 1% rule (rent ≥ 1% of price), the offer needs to be $261k (3.4% below list).
- Recommended offer: $261k (3.4% below list) — sets the bar for 1% rule.
- Cap rate 7.7% vs local median 3.8% in Boiling Springs — top-decile yield for the area; either an underpriced asset or a hidden risk that comps aren't pricing in. Stress-test before assuming the spread holds.
Location & tenants
- Location reads 78/100 on livability (#17 in SC, #2,429 nationally) — a middle-class / working-renter tenant base. Strengths: cost of living A+, housing A+, health & safety A+; Watch: commute F.
- Spartanburg 02 (suburban): math 49% / reading 56% proficiency, ranked #6 of 80 in SC (top 8%) — acceptable for families but not a draw, mixed tenant base, ~2y average lease.
- Zoned schools: Boiling Springs Elementary (math 57% / reading 57%, grade C+, #102 of 597 statewide, top 18%, 886 students, 67% FRL); Rainbow Lake Middle (math 37% / reading 46%, grade F, #68 of 229 statewide, top 31%, 1,009 students, 69% FRL); Boiling Springs High (math 62% / reading 88%, grade A-, #37 of 196 statewide, top 18%, 2,671 students, 60% FRL) — zoned schools average 65% FRL vs 44% district-wide (21 pts higher); higher-poverty schools than district average — tighter screening recommended.
- Market conditions: Rents flat; 461 active listings in the ZIP; 7 comparable units currently listed for rent nearby; rentals at typical pace (median 23d on market — plan ~3-4 weeks tenant-placement turnaround); 3,129 units permitted in Spartanburg County in 2024 (40 in 5+ unit buildings).
- This rent runs 42% of the median local income ($75k/yr) — at the standard rent-burdened threshold; future hikes will face affordability resistance.
Forward outlook
- Local home prices are declining (-3.0%/yr); year-one equity from $2k of loan paydown is wiped out by about $8k of value loss. Plan a longer hold.
- Spartanburg County population projected at +18% by 2050 — long-run rental-demand tailwind backs the buy-and-hold thesis.
Negotiation context
- Only 8 days on market — expect competitive offers; lowballing is unlikely to land.
- Current owner paid $65k; list at $270k implies a 315% gain — meaningful room to come down on a strong offer.
Risks & watch-outs
- Climate carrying-cost: extreme-heat days projected 7→17/yr by 2055 (HVAC capex compounding) — expect insurance premiums to compound above CPI over the hold.
Questions for the listing agent
- Can we see the unit-by-unit rent roll, current vacancy, and any below-market leases? What's the average tenancy length?
- What capital expenditures (roof, boiler, parking lot, exteriors) have been made in the last 5 years, and what's planned in the next 2?
- Is there a deadline driving the sale (1031 exchange, divorce, estate, relocation)? That informs how much negotiation room exists.
- Schools are B-rated — typically a magnet for longer-tenancy family renters. What's the average tenant stay here, and is there a school-zone premium baked into asking?
- What's the average days-on-market for RENTAL listings here right now (not sales)? A rising rental-DOM trend means longer vacancies and softer asking-rent achievability than the comps imply.
- What's the recent tenant-quality profile in this submarket — average credit score on applications, eviction rate, late-payment / NSF rate, and stable-employment percentage? A property-management company in the area should have these aggregated.
- How much new apartment / multifamily construction is in the pipeline within 1–3 miles? Heavy new supply (>2% of stock underway) typically softens rents 12–24 months out; light construction supports rent growth.
Investment metrics
- 1% rule
- 0.97% ✗
- Cap rate
- 7.67%
- Cash-on-cash
- 4.93%
- DSCR
- 1.22
- GRM
- 8.6
CMA / ARV
No comps found within radius.
Projected returns pro-forma
-3.0% appreciation · 0.69% rent growth · sell at horizon
- IRR
- -11.1%
- Equity multiple
- 0.60×
- Total profit
- $-29,931
- Equity at exit
- $40,258
- IRR
- -5.4%
- Equity multiple
- 0.68×
- Total profit
- $-23,940
- Equity at exit
- $23,345
Cash invested: $75,600 (down + closing). Projections, not guarantees.
Landlord ↔ Tenant lean methodology
- Overall (STATE)
- 90 Strongly Landlord-Friendly
- State South Carolina
- 90 Strongly Landlord-Friendly · R+6
- County
- — inherits STATE
- City
- — inherits STATE
ZIP-level market 29316
- Home prices YoY
- -18.9%
- Rents YoY
- 0.7%
- Active inventory
- 461
- Price-to-rent
- 17.3×
Monthly cashflow live
- Estimated rent
- $2,608 medium interval (Pro) →
- Mortgage (P&I)
- −$1,416
- Tax from tax record
- −$221 /mo · $2,657/yr
- Insurance
- −$112
- HOA
- −$0
- Vacancy / Maint / Mgmt
- −$548
- Net cashflow
- $311
Break-even live
Sensitivity live
| Price | -10% $463 | -5% $387 | +0% $311 | +5% $234 | +10% $158 |
|---|---|---|---|---|---|
| Rent | -10% $104 | -5% $208 | +0% $311 | +5% $414 | +10% $517 |
| Rate | -1.0pp $446 | -0.5pp $379 | base $311 | +0.5pp $241 | +1.0pp $169 |
2-unit breakdown (identical units grouped — click to expand)
| Units | Beds | Baths | Est. rent |
|---|---|---|---|
| 2× units | 2 | 1 | $2,608 |
| #1 | 2 | 1 | $1,304 |
| #2 | 2 | 1 | $1,304 |
| Total (2 units) | $2,608 | ||
UW: 25.0% down · 7.5% · 30yr · 1.5% tax · 5.0% vac · 8.0% maint · 8.0% mgmt
Financing live
Cash to close
- Down payment
- $67,500
- Closing costs
- $8,100
- Reserves months
- —
- Total cash needed
- —
Loan-product check · same deal, 3 products live
Conventional
25% down · 7.5% · 30yr
- Down + closing
- —
- Monthly P&I
- —
- Monthly cashflow
- —
- DSCR
- —
- Eligible?
- —
Personal DTI + credit; lowest rate.
DSCR
20% down · 8.5% · 30yr
- Down + closing
- —
- Monthly P&I
- —
- Monthly cashflow
- —
- DSCR
- —
- Eligible?
- —
No personal income docs; deal must DSCR.
Hard money
10% down · 12.0% · 12mo
- Down + closing
- —
- Monthly P&I
- —
- Monthly cashflow
- —
- DSCR
- —
- Eligible?
- —
Short-term bridge; refi at stabilization.
Rent comps 7 comps
| Address | Beds | Baths | Sqft | Rent | $/sqft | DOM | Units | Dist |
|---|---|---|---|---|---|---|---|---|
| 257 Waxberry Ct Boiling Springs, SC | 3.0 | 2.0 | 1400 | $1,839 | $1.31 | 22d | 1 | 0.56mi |
| 318 Cool Embers Ln Boiling Springs, SC | 4.0 | 2.0 | 1646 | $1,906 | $1.16 | 15d | 1 | 0.63mi |
| 9103 Gabbro Ln Boiling Springs, SC | 1.0–3.0 | 1.0–2.5 | 1060 | $1,789 | $1.69 | 15d | 14 | 0.88mi |
| 1510 Painted Horse Trl Boiling Springs, SC | 3.0 | 2.5 | 1631 | $1,650 | $1.01 | 22d | 1 | 1.01mi |
| 584 Craftsman Ln Boiling Springs, SC | 3.0 | 2.5 | 1700 | $1,850 | $1.09 | 22d | 1 | 1.24mi |
| 4050 Parris Bridge Rd Boiling Springs, SC | 3.0 | 2.5 | 1460 | $1,695 | $1.16 | 22d | 1 | 1.39mi |
| 4050 Parris Bridge Rd Boiling Springs, SC | 3.0 | 2.5 | 1460 | $1,695 | $1.16 | 15d | 1 | 1.39mi |
Listing history 7 events
-
2026-06-10days on market $270,000 Active 8 DOM
-
2026-06-09days on market $270,000 Active 7 DOM
-
2026-06-08days on market $270,000 Active 6 DOM
-
2026-06-07days on market $270,000 Active 5 DOM
-
2026-06-05days on market $270,000 Active 2 DOM
-
2026-06-03remarks 681-char remark
-
2026-06-03$270,000 Active 1 DOM
ⓘ Source: listings_history table (triggers on properties + properties_extension) + one-shot
backfill from property_details.listing_events for pre-trigger history.
Tax reassessment forecast SC · Resets to sale price
- Current annual tax
- $2,657 · $221/mo
- Projected year-2 tax
- $2,657 · $221/mo
- Expected delta
- $0/yr ($0/mo · 0.0%)
ⓘ Screening estimate from a state-policy table — verify with the county assessor before closing.
Climate risk First Street
- Flood 1/10 Low FEMA zone X (unshaded) · 0% chance over 30 yrs
- Wildfire 4/10 Moderate
- Heat 6/10 Major 7 d/yr ≥105°F today · 17 d/yr by 30 yrs out
- Wind 2/10 Low 2% chance of damaging wind over 30 yrs
- Air quality 4/10 Moderate 4 unhealthy d/yr today · 4 by 30 yrs out
Nearby sold comps map
Loading sold comps map…
Walkable amenities ~0.75 mi
Loading nearby amenities…
Taxation est. · year 1
- Rental income
- $31,296
- − Mortgage interest
- −$15,124
- − Property taxes
- −$2,657
- − Insurance
- −$1,350
- − Repairs & maintenance
- −$2,504
- − Management
- −$2,504
- − Depreciation
- −$7,855
- Taxable loss
- −$697
- Est. tax savings @ 24.0%
- +$167
- After-tax cash flow
- $3,894/yr
For passive investors: Depreciation is non-cash, so a rental often shows a tax loss while cash-flowing — sheltering income. Rental losses are passive: they offset passive income freely, and up to $25,000/yr can offset ordinary (W-2) income if you actively participate and your MAGI is under $100k (phasing out to $0 by $150k); unused losses carry forward. On sale, claimed depreciation is recaptured at up to 25%, and gains may owe capital-gains tax (a 1031 exchange can defer both). Figures are a year-1 estimate at your 24.0% rate — not tax advice; consult a CPA.
Schools (NCES district)
- District
- Spartanburg 02
- NCES district ID
- 4503510
- Math proficiency
- 49% ▼ -7.00%
- Reading proficiency
- 56% ▲ 2.00%
- Median HH income
- $49,591
- Composite
- 44.79/100
- National rank
- #2742
- State rank
- #6 of 80 in SC
Livability — Boiling Springs
- Score
- 78/100
- State rank
- #17
- US rank
- #2429
Category grades
Schools grade is shown separately in the Schools card above.
Census & demographics
- Census place
- Boiling Springs, SC
- County
- Spartanburg County · 258,607 people
- City population
- 33,104
- Metro
- Spartanburg, SC
- Population (ZIP)
- 33,104
- Household income
- $74,735
- Rent vs Own
- Severe rent burden
- 524.0
Population outlook (Spartanburg County) Hauer SSP2
- Today (2025)
- 325,495 people
- By 2030
- 338,800 · +4.1%
- By 2040
- 363,471 · +11.7%
- By 2050
- 384,156 · +18.0%
- By 2075
- 430,137 · +32.1%
- By 2100
- 442,733 · +36.0%
Race, ethnicity, and origin ACS 2023
- Neighborhood character
- Predominantly White (72%)
- Race & ethnicity
- White 72% Black 15% Two or more races 6% Hispanic / Latino 5% Asian 4%
- Hispanic origin (detail)
- Mexican 3%
- Common ancestry
- Slovak 3% Subsaharan African 3% Scotch-Irish 2%
- Foreign-born
- 11% · Canada, Jamaica
- Languages at home
- 84% English-only · Russian/Polish/Slavic 7% Spanish 5% Other Asian/Pacific 2%
Political lean MEDSL · Spartanburg
- 2024 margin
- Solid R (+33.6) · D 32.6% · R 66.2% · Other 1.2%
- 2008→2024 swing
- -12.0pp toward R · 2008: -21.6pp · 2024: -33.6pp
- All cycles
- 2024: R+33.6 2020: R+27.3 2016: R+30.0 2012: R+23.1 2008: R+21.6
Not yet ingested
- Civics
- —
Market trends
- HPI YoY
- ▼ -51.42%
- Current HPI
- 220.8438
- Rent YoY
- ▲ 0.69%
- Metro
- Spartanburg, SC
- State GDP YoY
- ▲ 4.51%
- F500 in state
- 2
Industry mix (Fortune 500 HQ in SC)
| Industry | F500 HQs | Revenue |
|---|---|---|
| Packaging | 1 | $7B |
|
||
Price history
+315.4% since first listed2 events — show timeline
- 2026-06-01 Listed $270,000 SPMLS
- 1990-09-01 Sold (Public Records) $65,000 Public Records
Property tax history
+2.7%/yrLatest (2025): $2,657 · +1.3% YoY. Source: county tax records.
Cash-flow waterfall
monthlySold comps — $/sqft
last 12 mo · ≤1 miLoading sold comps…