85 Bluff View Dr · Greers Ferry, AR
Flood risk 1/10 · Minimal
- FEMA flood zone
- X (unshaded)
- Chance of flooding over 30 yrs
- 0.0%
- Est. flood insurance / yr
- $473 – $860
Fire risk 4/10 · Minor
- Est. fire insurance / yr
- $1,499 – $2,785
Heat risk 4/10 · Minor
- Hot days now (above 108°F)
- 6 days/yr
- Hot days in 30 yrs
- 14 days/yr
Wind risk 3/10 · Minor
- Chance of severe wind over 30 yrs
- 5.0%
Air-quality risk 2/10 · Minimal
- Unhealthy air days now
- 0 days/yr
- Unhealthy air days in 30 yrs
- 1 days/yr
Risk factors via First Street. Map © Google.
Why this score? — see what drove the F grade
The composite is a weighted blend of 9 inputs, each scored 0–100. Each bar is that input's sub-score; the figure is the points it added to the 100-point composite (weight × sub-score).
- Appreciation +10.0/10.0
- ARV discount +7.5/15.0
- Schools +3.4/10.0
- Livability +3.1/5.0
- Cash flow +2.5/30.0
- Rent growth +2.5/5.0
- Condition / age +2.5/5.0
- 1% rule +0.0/10.0
- DSCR +0.0/10.0
$314,900
🖨 Deal sheet (PDF) 📄 Offer letter ✓ Due diligence
Listing remarks MLS
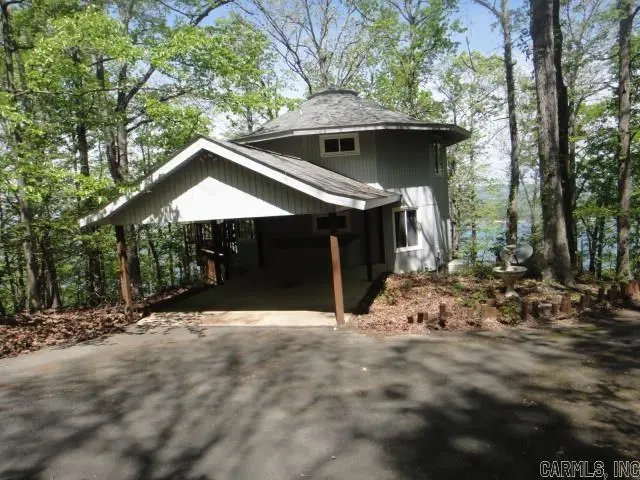
Check out the view of beautiful Greers Ferry Lake from the 3 level decks of this Contemporary home that sits on 1.66 acres. The lower level of this 3 story has a walk-out basement with a storage area attached to lower level. So much potential. This home can be 4 BRs or 3 BRs and Game Rm. Master BR is on 2nd level with almost panaramic view. Looking for a Summer home, retirement home or permanent home! Please see Agent Remarks.
Key facts
- 1.66 acres
- Walk-out basement
- 3 story
Tags
Neighborhood map
What this means for you Summary
Snapshot
- This is a 4-bed/2.0-bath single-family listed at $315k.
Deal economics
- At list price, monthly cash flow is $-1k ($-13k/yr) — negative.
- To cash-flow at today's rent, offer at most $123k (60.9% below list).
- To meet the 1% rule (rent ≥ 1% of price), the offer needs to be $130k (58.9% below list).
- Recommended offer: $123k (60.9% below list) — sets the bar for cash-flow.
- Cap rate 2.2% vs local median 1.8% in Greers Ferry — meaningfully above typical; check what's discounted (condition, days-on-market, listing class) to confirm the premium yield is real.
Location & tenants
- Location reads 61/100 on livability (#251 in AR) — a middle-class / working-renter tenant base. Strengths: cost of living A+, housing A+; Watch: employment D+, schools D, amenities F.
- Quitman School District (rural): math 39% / reading 42% proficiency, ranked #63 of 238 in AR (top 26%) — families likely to look elsewhere, expect single-tenant / working-renter base with shorter leases.
- Market conditions: 69 active listings in the ZIP; 13 units permitted in Cleburne County in 2024 (0 in 5+ unit buildings).
Forward outlook
- In year one you build about $34k of equity ($2k loan paydown + $31k appreciation (10.0% local appreciation)).
- Cleburne County population projected at -18% by 2050 — secular population decline; favor cash flow + early exit over multi-decade hold.
- By year 2, paydown + projected appreciation supports a ~$54k cash-out refi (75% LTV) — recoverable capital for the next deal without selling this one.
Negotiation context
- It's been on market 128 days — a 12% lower offer ($277k) is reasonable based on typical stale-listing flexibility.
- 3 sale attempts since 2y ago; this cycle's ask has dropped $20k (6%) from the opening price — seller is motivated, your offer sets the floor, not the list.
Questions for the listing agent
- What do current leases actually rent for vs. the listed asking? Can we see a recent rent roll and the last 12 months of T-12 income?
- It's been on market 128 days. Have you received any prior offers? Is the seller open to a 61% concession, seller financing, or rate buy-down credit?
- Why hasn't it sold? Are there any deal-killer items the seller is aware of (foundation, flood, title, zoning, code violations)?
- Is there a deadline driving the sale (1031 exchange, divorce, estate, relocation)? That informs how much negotiation room exists.
- Schools are D-rated, which usually means shorter tenancies and higher turnover. Who's the typical renter profile here, and what's been the actual vacancy rate?
- The area grade is low — what's the realistic commute time and amenity access for the typical tenant pool here? Any planned neighborhood developments (good or bad) we should know about?
- What's the average days-on-market for RENTAL listings here right now (not sales)? A rising rental-DOM trend means longer vacancies and softer asking-rent achievability than the comps imply.
- What's the recent tenant-quality profile in this submarket — average credit score on applications, eviction rate, late-payment / NSF rate, and stable-employment percentage? A property-management company in the area should have these aggregated.
- How much new for-sale + rental construction is in the pipeline within 1–3 miles? Heavy new supply typically softens prices + rents 12–24 months out; constrained supply supports both.
Investment metrics
- 1% rule
- 0.41% ✗
- Cap rate
- 2.16%
- Cash-on-cash
- -14.77%
- DSCR
- 0.34
- GRM
- 20.3
CMA / ARV
- ARV (median comp)
- $718,930
- List price
- $314,900
- Delta
- -56.20%
- Verdict
- UNDERPRICED
- Comps
- 2 within 1.0 mi
Projected returns pro-forma
10.0% appreciation · 3.0% rent growth · sell at horizon
- IRR
- 14.0%
- Equity multiple
- 2.16×
- Total profit
- $102,338
- Equity at exit
- $283,687
- IRR
- 14.0%
- Equity multiple
- 5.03×
- Total profit
- $355,699
- Equity at exit
- $611,781
Cash invested: $88,172 (down + closing). Projections, not guarantees.
Landlord ↔ Tenant lean methodology
- Overall (STATE)
- 92 Strongly Landlord-Friendly
- State Arkansas
- 92 Strongly Landlord-Friendly · R+14
- County
- — inherits STATE
- City
- — inherits STATE
ZIP-level market 72131
- Home prices YoY
- 14.8%
- Active inventory
- 69
- Price-to-rent
- 20.3×
Monthly cashflow live
- Estimated rent
- $1,295 medium interval (Pro) →
- Mortgage (P&I)
- −$1,651
- Tax from tax record
- −$326 /mo · $3,918/yr
- Insurance
- −$131
- HOA
- −$0
- Vacancy / Maint / Mgmt
- −$272
- Net cashflow
- $-1,086
Break-even live
Sensitivity live
| Price | -10% $-907 | -5% $-996 | +0% $-1,086 | +5% $-1,175 | +10% $-1,264 |
|---|---|---|---|---|---|
| Rent | -10% $-1,188 | -5% $-1,137 | +0% $-1,086 | +5% $-1,034 | +10% $-983 |
| Rate | -1.0pp $-927 | -0.5pp $-1,006 | base $-1,086 | +0.5pp $-1,167 | +1.0pp $-1,250 |
UW: 25.0% down · 7.5% · 30yr · 1.5% tax · 5.0% vac · 8.0% maint · 8.0% mgmt
Financing live
Cash to close
- Down payment
- $78,725
- Closing costs
- $9,447
- Reserves months
- —
- Total cash needed
- —
Loan-product check · same deal, 3 products live
Conventional
25% down · 7.5% · 30yr
- Down + closing
- —
- Monthly P&I
- —
- Monthly cashflow
- —
- DSCR
- —
- Eligible?
- —
Personal DTI + credit; lowest rate.
DSCR
20% down · 8.5% · 30yr
- Down + closing
- —
- Monthly P&I
- —
- Monthly cashflow
- —
- DSCR
- —
- Eligible?
- —
No personal income docs; deal must DSCR.
Hard money
10% down · 12.0% · 12mo
- Down + closing
- —
- Monthly P&I
- —
- Monthly cashflow
- —
- DSCR
- —
- Eligible?
- —
Short-term bridge; refi at stabilization.
Listing history 34 events
-
2026-06-18days on market $314,900 Active 128 DOM
-
2026-06-17days on market $314,900 Active 127 DOM
-
2026-06-16days on market $314,900 Active 126 DOM
-
2026-06-15days on market $314,900 Active 125 DOM
-
2026-06-14days on market $314,900 Active 123 DOM
-
2026-06-13days on market $314,900 Active 122 DOM
-
2026-06-10days on market $314,900 Active 120 DOM
-
2026-06-09days on market $314,900 Active 119 DOM
-
2026-06-08days on market $314,900 Active 118 DOM
-
2026-06-07days on market $314,900 Active 117 DOM
-
2026-06-03days on market $314,900 Active 113 DOM
-
2026-06-02days on market $314,900 Active 112 DOM
-
2026-06-01days on market $314,900 Active 111 DOM
-
2026-05-31days on market $314,900 Active 110 DOM
-
2026-05-31days on market $314,900 Active 109 DOM
-
2026-05-02price $314,900 430-char remark
Show marketing remark (430 chars)
Check out the view of beautiful Greers Ferry Lake from the 3 level decks of this Contemporary home that sits on 1.66 acres. The lower level of this 3 story has a walk-out basement with a storage area attached to lower level. So much potential. This home can be 4 BRs or 3 BRs and Game Rm. Master BR is on 2nd level with almost panaramic view. Looking for a Summer home, retirement home or permanent home! Please see Agent Remarks.
-
2026-03-27price $324,900 430-char remark
Show marketing remark (430 chars)
Check out the view of beautiful Greers Ferry Lake from the 3 level decks of this Contemporary home that sits on 1.66 acres. The lower level of this 3 story has a walk-out basement with a storage area attached to lower level. So much potential. This home can be 4 BRs or 3 BRs and Game Rm. Master BR is on 2nd level with almost panaramic view. Looking for a Summer home, retirement home or permanent home! Please see Agent Remarks.
-
2026-02-10historical
-
2026-02-09status Back on Market
Show marketing remark (430 chars)
Check out the view of beautiful Greers Ferry Lake from the 3 level decks of this Contemporary home that sits on 1.66 acres. The lower level of this 3 story has a walk-out basement with a storage area attached to lower level. So much potential. This home can be 4 BRs or 3 BRs and Game Rm. Master BR is on 2nd level with almost panaramic view. Looking for a Summer home, retirement home or permanent home! Please see Agent Remarks.
-
2026-02-09$334,900 New Listing 430-char remark
Show marketing remark (430 chars)
Check out the view of beautiful Greers Ferry Lake from the 3 level decks of this Contemporary home that sits on 1.66 acres. The lower level of this 3 story has a walk-out basement with a storage area attached to lower level. So much potential. This home can be 4 BRs or 3 BRs and Game Rm. Master BR is on 2nd level with almost panaramic view. Looking for a Summer home, retirement home or permanent home! Please see Agent Remarks.
-
2026-01-31historical
-
2025-12-30price $339,000
-
2025-10-29price $344,900
-
2025-08-16price $349,900
-
2025-05-22price $365,000
-
2025-04-24price $374,900
-
2025-03-26price $385,000
-
2025-02-22price $399,900
-
2025-01-17price $409,900
-
2024-12-18price $419,900
-
2024-11-08$429,900 New Listing
-
2020-10-07soldstatus $560,000
-
1993-06-01soldstatus $38,000
-
1986-09-01soldstatus $32,500
ⓘ Source: listings_history table (triggers on properties + properties_extension) + one-shot
backfill from property_details.listing_events for pre-trigger history.
Tax reassessment forecast AR · Resets to sale price
- Current annual tax
- $3,918 · $326/mo
- Projected year-2 tax
- $3,918 · $326/mo
- Expected delta
- $0/yr ($0/mo · 0.0%)
ⓘ Screening estimate from a state-policy table — verify with the county assessor before closing.
Climate risk First Street
- Flood 1/10 Low FEMA zone X (unshaded) · 0% chance over 30 yrs
- Wildfire 4/10 Moderate
- Heat 4/10 Moderate 6 d/yr ≥108°F today · 14 d/yr by 30 yrs out
- Wind 3/10 Moderate 5% chance of damaging wind over 30 yrs
- Air quality 2/10 Low 0 unhealthy d/yr today · 1 by 30 yrs out
Nearby sold comps map
Loading sold comps map…
Walkable amenities ~0.75 mi
Loading nearby amenities…
Taxation est. · year 1
- Rental income
- $15,546
- − Mortgage interest
- −$17,639
- − Property taxes
- −$3,918
- − Insurance
- −$1,574
- − Repairs & maintenance
- −$1,244
- − Management
- −$1,244
- − Depreciation
- −$9,161
- Taxable loss
- −$19,234
- Est. tax savings @ 24.0%
- +$4,616
- After-tax cash flow
- $-8,411/yr
For passive investors: Depreciation is non-cash, so a rental often shows a tax loss while cash-flowing — sheltering income. Rental losses are passive: they offset passive income freely, and up to $25,000/yr can offset ordinary (W-2) income if you actively participate and your MAGI is under $100k (phasing out to $0 by $150k); unused losses carry forward. On sale, claimed depreciation is recaptured at up to 25%, and gains may owe capital-gains tax (a 1031 exchange can defer both). Figures are a year-1 estimate at your 24.0% rate — not tax advice; consult a CPA.
Schools (NCES district)
- District
- Quitman School District
- NCES district ID
- 0511880
- Math proficiency
- 39% ▼ -12.00%
- Reading proficiency
- 42% ▼ -5.00%
- Median HH income
- $44,003
- Composite
- 34.33/100
- National rank
- #5229
- State rank
- #63 of 238 in AR
Livability — Greers Ferry
- Score
- 61/100
- State rank
- #251
- US rank
- #18144
Category grades
Schools grade is shown separately in the Schools card above.
Census & demographics
- City population
- 2,881
- Population (ZIP)
- 4,099
Population outlook (Cleburne County) Hauer SSP2
- Today (2025)
- 24,198 people
- By 2030
- 23,324 · -3.6%
- By 2040
- 21,566 · -10.9%
- By 2050
- 19,916 · -17.7%
- By 2075
- 16,744 · -30.8%
- By 2100
- 13,303 · -45.0%
Race, ethnicity, and origin ACS 2023
- Neighborhood character
- Predominantly White (90%)
- Race & ethnicity
- White 90% Two or more races 5% Hispanic / Latino 3%
- Common ancestry
- Lithuanian 3% Slovak 2% Iranian 1%
- Foreign-born
- 1%
- Languages at home
- 98% English-only · Spanish 2%
Political lean MEDSL · Cleburne
- 2024 margin
- Solid R (+67.9) · D 15.2% · R 83.2% · Other 1.6%
- 2008→2024 swing
- -23.7pp toward R · 2008: -44.2pp · 2024: -67.9pp
- All cycles
- 2024: R+67.9 2020: R+65.8 2016: R+61.4 2012: R+52.2 2008: R+44.2
Not yet ingested
- Civics
- —
Market trends
- HPI YoY
- ▲ 31.46%
- Current HPI
- 243.7407
- Rent YoY
- —
- Metro
- —
- State GDP YoY
- ▲ 3.80%
- F500 in state
- 10
Industry mix (Fortune 500 HQ in AR)
| Industry | F500 HQs | Revenue |
|---|---|---|
| Retail | 1 | $681B |
|
||
| Food / Agriculture | 1 | $53B |
|
||
| Retail / Energy | 1 | $22B |
|
||
| Transportation / Logistics | 1 | $12B |
|
||
| Energy | 1 | $4B |
|
||
Price history
+868.9% since first listed19 events — show timeline
- 2026-05-02 Price Changed $314,900 CARMLS
- 2026-03-27 Price Changed $324,900 CARMLS
- 2026-02-10 Listing Removed — CARMLS
- 2026-02-09 Relisted — CARMLS
- 2026-02-09 Listed $334,900 CARMLS
- 2026-01-31 Listing Removed — CARMLS
- 2025-12-30 Price Changed $339,000 CARMLS
- 2025-10-29 Price Changed $344,900 CARMLS
- 2025-08-16 Price Changed $349,900 CARMLS
- 2025-05-22 Price Changed $365,000 CARMLS
- 2025-04-24 Price Changed $374,900 CARMLS
- 2025-03-26 Price Changed $385,000 CARMLS
- 2025-02-22 Price Changed $399,900 CARMLS
- 2025-01-17 Price Changed $409,900 CARMLS
- 2024-12-18 Price Changed $419,900 CARMLS
- 2024-11-08 Listed $429,900 CARMLS
- 2020-10-07 Sold (Public Records) $560,000 Public Records
- 1993-06-01 Sold (Public Records) $38,000 Public Records
- 1986-09-01 Sold (Public Records) $32,500 Public Records
Property tax history
+14.7%/yrLatest (2025): $3,918 · +146.4% YoY. Source: county tax records.
Cash-flow waterfall
monthlySold comps — $/sqft
last 12 mo · ≤1 miLoading sold comps…