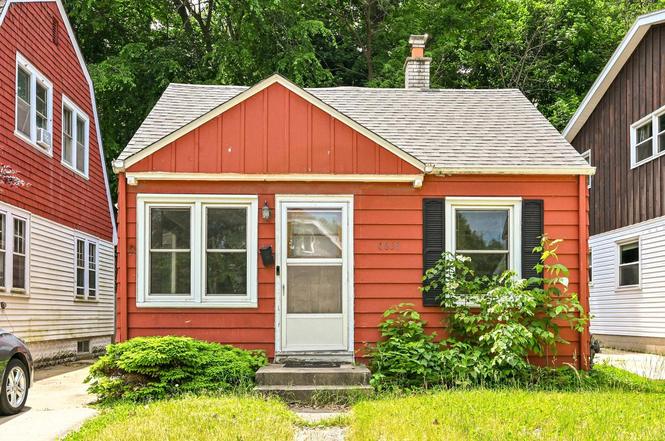
6633 Hillside Ln · Wauwatosa, WI
Flood risk 8/10 · Major
- FEMA flood zone
- X (unshaded)
- Chance of flooding over 30 yrs
- 0.78%
- Est. flood insurance / yr
- $473 – $860
Fire risk 1/10 · Minimal
- Est. fire insurance / yr
- $636 – $1,182
Heat risk 2/10 · Minimal
- Hot days now (above 99°F)
- 7 days/yr
- Hot days in 30 yrs
- 13 days/yr
Wind risk 2/10 · Minimal
- Chance of severe wind over 30 yrs
- —
Air-quality risk 2/10 · Minimal
- Unhealthy air days now
- 1 days/yr
- Unhealthy air days in 30 yrs
- 1 days/yr
Risk factors via First Street. Map © Google.
Why this score? — see what drove the B- grade
The composite is a weighted blend of 9 inputs, each scored 0–100. Each bar is that input's sub-score; the figure is the points it added to the 100-point composite (weight × sub-score).
- Cash flow +22.8/30.0
- ARV discount +14.5/15.0
- DSCR +7.3/10.0
- 1% rule +5.9/10.0
- Livability +4.4/5.0
- Schools +4.3/10.0
- Rent growth +4.0/5.0
- Condition / age +2.5/5.0
- Appreciation +0.0/10.0
$169,000
🖨 Deal sheet 📄 Offer letter ✓ Due diligence
Listing remarks
Nestled on a quiet dead end street in Wauwatosa's Jacobus Park neighborhood, this 2 bedroom, 1 bath home offers incredible potential for the right buyer. Whether you are looking to build equity, create a rental opportunity, or take on your next investment project, this property is ready for your vision. The home is in need of repair and will require updates throughout, making it ideal for cash buyers, investors, contractors, or buyers seeking a renovation opportunity. This home is conveniently located to shopping, dining, and freeway access. Bring your ideas and transform this property into a solid investment or future home.
Key facts
- Investment project
- In need of repair
- Conveniently located
Tags
Property features AI
Finance
- Other: Zoned BB TWO
Exterior
- Utilities: Municipal water; Municipal sewer
- Home design: Single-family home; One story; Less than 1/2 acre lot
- Construction: Aluminum/steel exterior; Information source indicates year built from assessor/public record
- Exterior features: Deck; Garden shed
Interior
- Kitchen: Main-level kitchen, 10 x 10
- Bedrooms: Main-level primary bedroom, 9 x 10; Main-level second bedroom, 9 x 10
- Flooring: Wood floors
- Bathrooms: One full bathroom with tub and shower over tub
- Heating & cooling: Forced air heating (natural gas); Central air conditioning
- Interior features: Wood floors; Full block basement
Neighborhood map
What this means for you Summary
Snapshot
- This is a 2-bed/1.0-bath single-family listed at $169k.
Deal economics
- At list price, monthly cash flow is $238 ($3k/yr) — positive.
- The deal already cash-flows at list — no discount required.
- Meets the 1% rule at list price ($2k rent vs $169k).
- Cap rate 8.4% vs local median 2.5% in Wauwatosa — top-decile yield for the area; either an underpriced asset or a hidden risk that comps aren't pricing in. Stress-test before assuming the spread holds.
Location & tenants
- Location reads 87/100 on livability (#19 in WI, #257 nationally) — a professional / high-income tenant draw. Strengths: commute A+, employment A+, housing A+.
- Wauwatosa School District (suburban): math 45% / reading 52% proficiency, ranked #55 of 342 in WI (top 16%) — families likely to look elsewhere, expect single-tenant / working-renter base with shorter leases; only 17% free/reduced lunch — higher-income household profile.
- Market conditions: Rents rising fast (+5.9%/yr); 53 active listings in the ZIP; 10 comparable units currently listed for rent nearby; rentals leasing fast (median 3d on market — plan ~1-2 weeks tenant-placement turnaround); solid renter incomes; 1,017 units permitted in Milwaukee County in 2024 (803 in 5+ unit buildings).
Forward outlook
- Local home prices are declining (-3.0%/yr); year-one equity from $1k of loan paydown is wiped out by about $5k of value loss. Plan a longer hold.
- Milwaukee County population projected at +4% by 2050 — modest demand growth; plan on rents tracking national, not racing it.
- At projected returns (-3.0% appreciation + 5.9% rent growth), your $47k cash investment doubles in ~10 years — after that, you're playing with house money.
Negotiation context
- Only 1 days on market — expect competitive offers; lowballing is unlikely to land.
- Current owner paid $82k; list at $169k implies a 105% gain — meaningful room to come down on a strong offer.
Risks & watch-outs
- Watch-outs: flood insurance adds $56/mo; built in 1950 — expect roof / HVAC / electrical / plumbing capex.
- Climate carrying-cost: severe flood risk — expect insurance premiums to compound above CPI over the hold.
Questions for the listing agent
- Built in 1950 — when were the roof, HVAC, electrical panel, plumbing, and water heater last replaced?
- What's the actual annual flood-insurance premium (NFIP or private), and is the property in a SFHA with mandatory coverage?
- Is there a deadline driving the sale (1031 exchange, divorce, estate, relocation)? That informs how much negotiation room exists.
- Schools are B-rated — typically a magnet for longer-tenancy family renters. What's the average tenant stay here, and is there a school-zone premium baked into asking?
- What's the average days-on-market for RENTAL listings here right now (not sales)? A rising rental-DOM trend means longer vacancies and softer asking-rent achievability than the comps imply.
- What's the recent tenant-quality profile in this submarket — average credit score on applications, eviction rate, late-payment / NSF rate, and stable-employment percentage? A property-management company in the area should have these aggregated.
- How much new for-sale + rental construction is in the pipeline within 1–3 miles? Heavy new supply typically softens prices + rents 12–24 months out; constrained supply supports both.
Investment metrics
- 1% rule
- 1.09% ✓
- Cap rate
- 8.38%
- Cash-on-cash
- 7.45%
- DSCR
- 1.33
- GRM
- 7.7
CMA / ARV
- ARV (on-the-fly)
- $200,340
- Comps found
- 2
Show comp detail 2 sales within ~0.75 mi
| Address | Dist | Beds/Ba | Sqft | Sold | Price | $/sf | Match |
|---|---|---|---|---|---|---|---|
| 6850 St James St | 0.45mi | 1/1.0 (-1) | 660 (+5%) | 6mo | $210,000 | $318 | 62 |
| 334 N 62nd St | 0.57mi | 2/1.0 | 672 (+7%) | 23mo | $175,000 | $260 | 43 |
Match score weights: distance 35% · size 25% · config 20% · recency 20%. Top-matched comps best support the ARV.
Projected returns pro-forma
-3.0% appreciation · 5.86% rent growth · sell at horizon
- IRR
- -3.7%
- Equity multiple
- 0.86×
- Total profit
- $-6,724
- Equity at exit
- $25,198
- IRR
- 9.1%
- Equity multiple
- 1.79×
- Total profit
- $37,565
- Equity at exit
- $14,612
Cash invested: $47,320 (down + closing). Projections, not guarantees.
Landlord ↔ Tenant lean methodology
- Overall (STATE)
- 73 Landlord-Friendly
- State Wisconsin
- 73 Landlord-Friendly · R+2
- County
- — inherits STATE
- City
- — inherits STATE
ZIP-level market 53213
- Rents YoY
- 5.9%
- Active inventory
- 53
- Price-to-rent
- 7.7×
Monthly cashflow live
- Estimated rent
- $1,837 high interval (Pro) →
- Mortgage (P&I)
- −$886
- Tax from tax record
- −$201 /mo · $2,411/yr
- Insurance
- −$70
- Flood insurance flood zone
- −$56 /mo · $666/yr
- HOA
- −$0
- Vacancy / Maint / Mgmt
- −$386
- Net cashflow
- $238
Break-even live
UW: 25.0% down · 7.5% · 30yr · 1.5% tax · 5.0% vac · 8.0% maint · 8.0% mgmt
Financing live
Cash to close
- Down payment
- $42,250
- Closing costs
- $5,070
- Reserves months
- —
- Total cash needed
- —
Loan-product check · same deal, 3 products live
Conventional
25% down · 7.5% · 30yr
- Down + closing
- —
- Monthly P&I
- —
- Monthly cashflow
- —
- DSCR
- —
- Eligible?
- —
Personal DTI + credit; lowest rate.
DSCR
20% down · 8.5% · 30yr
- Down + closing
- —
- Monthly P&I
- —
- Monthly cashflow
- —
- DSCR
- —
- Eligible?
- —
No personal income docs; deal must DSCR.
Hard money
10% down · 12.0% · 12mo
- Down + closing
- —
- Monthly P&I
- —
- Monthly cashflow
- —
- DSCR
- —
- Eligible?
- —
Short-term bridge; refi at stabilization.
Rent comps 10 comps
| Address | Beds | Baths | Sqft | Rent | $/sqft | DOM | Units | Dist |
|---|---|---|---|---|---|---|---|---|
| 1215 N 62nd St Wauwatosa, WI | 2.0 | 1.0–2.0 | 796 | $2,321 | $2.91 | 1d | 9 | 0.36mi |
| 1244 N 68th St Milwaukee, WI | 1.0–2.0 | 1.0–1.5 | 850 | $1,650 | $1.94 | 1d | 7 | 0.37mi |
| 1200 N 62nd St Milwaukee, WI | 1.0–2.0 | 1.0–2.0 | 899 | $2,343 | $2.60 | 1d | 14 | 0.43mi |
| 920 N Hawley Rd Milwaukee, WI | 1.0–2.0 | 1.0 | 752 | $1,035 | $1.38 | 14d | 3 | 0.63mi |
| 7300 W State St Milwaukee, WI | 1.0 | 1.0 | 725 | $1,175 | $1.62 | 23d | 2 | 0.64mi |
| 920 N Hawley Rd Unit HAWL-412 Milwaukee, WI | 1.0 | 1.0 | 640 | $1,035 | $1.62 | 23d | 1 | 0.64mi |
| 7400 W State St Milwaukee, WI | 1.0–3.0 | 1.0–2.0 | 1106 | $2,945 | $2.66 | 2d | 8 | 0.73mi |
| 7474 Harwood Ave Wauwatosa, WI | 3.0 | 1.0–3.0 | 999 | $3,733 | $3.74 | 2d | 73 | 0.86mi |
| 7900 Harwood Ave Milwaukee, WI | 1.0 | 1.0 | 700 | $1,415 | $2.02 | 43d | 1 | 0.96mi |
| 8041 W Bluemound Rd Milwaukee, WI | 1.0–2.0 | 1.0–2.0 | 844 | $2,300 | $2.73 | 1d | 3 | 1.05mi |
Listing history 2 events
-
2026-06-17remarks 632-char remark
-
2026-06-17$169,000 Active 1 DOM
ⓘ Source: listings_history table (triggers on properties + properties_extension) + one-shot
backfill from property_details.listing_events for pre-trigger history.
Tax reassessment forecast WI · Partial reset (capped growth)
- Current annual tax
- $2,411 · $201/mo
- Projected year-2 tax
- $2,769 · $231/mo
- Expected delta
- +$358/yr (+$30/mo · 14.8%)
ⓘ Screening estimate from a state-policy table — verify with the county assessor before closing.
Climate risk First Street
- Flood 8/10 Severe FEMA zone X (unshaded) · 78% chance over 30 yrs
- Wildfire 1/10 Low
- Heat 2/10 Low 7 d/yr ≥99°F today · 13 d/yr by 30 yrs out
- Wind 2/10 Low
- Air quality 2/10 Low 1 unhealthy d/yr today · 1 by 30 yrs out
Nearby sold comps map
Loading sold comps map…
Walkable amenities ~0.75 mi
Loading nearby amenities…
Taxation est. · year 1
- Rental income
- $22,045
- − Mortgage interest
- −$9,467
- − Property taxes
- −$2,411
- − Insurance
- −$1,512
- − Repairs & maintenance
- −$1,764
- − Management
- −$1,764
- − Depreciation
- −$4,916
- Taxable income
- $212
- Est. tax owed @ 24.0%
- −$51
- After-tax cash flow
- $2,807/yr
For passive investors: Depreciation is non-cash, so a rental often shows a tax loss while cash-flowing — sheltering income. Rental losses are passive: they offset passive income freely, and up to $25,000/yr can offset ordinary (W-2) income if you actively participate and your MAGI is under $100k (phasing out to $0 by $150k); unused losses carry forward. On sale, claimed depreciation is recaptured at up to 25%, and gains may owe capital-gains tax (a 1031 exchange can defer both). Figures are a year-1 estimate at your 24.0% rate — not tax advice; consult a CPA.
Schools (NCES district)
- District
- Wauwatosa School District
- NCES district ID
- 5515990
- Math proficiency
- 45% ▼ -7.00%
- Reading proficiency
- 52% ▼ -1.00%
- Median HH income
- $69,017
- Composite
- 43.34/100
- National rank
- #3032
- State rank
- #55 of 342 in WI
Livability — Wauwatosa
- Score
- 87/100
- State rank
- #19
- US rank
- #257
Category grades
Schools grade is shown separately in the Schools card above.
Census & demographics
- Census place
- Wauwatosa, WI
- County
- Milwaukee County · 926,379 people
- City population
- 45,813
- Metro
- Milwaukee-Waukesha, WI
- Population (ZIP)
- 26,905
- Household income
- $101,688
- Rent vs Own
- Severe rent burden
- 774.0
Population outlook (Milwaukee County) Hauer SSP2
- Today (2025)
- 995,758 people
- By 2030
- 1,009,124 · +1.3%
- By 2040
- 1,028,128 · +3.3%
- By 2050
- 1,040,066 · +4.4%
- By 2075
- 1,057,849 · +6.2%
- By 2100
- 1,039,774 · +4.4%
Race, ethnicity, and origin ACS 2023
- Neighborhood character
- Predominantly White (80%)
- Race & ethnicity
- White 80% Two or more races 6% Hispanic / Latino 5% Asian 5% Black 4%
- Hispanic origin (detail)
- Mexican 2% Puerto Rican 2%
- Common ancestry
- Romanian 10% Lithuanian 4% Portuguese 4%
- Foreign-born
- 6% · China, Canada
- Languages at home
- 93% English-only · Spanish 2% Chinese 1% Other Indo-European 1%
Political lean MEDSL · Milwaukee
- 2024 margin
- Solid D (+38.5) · D 68.3% · R 29.8% · Other 1.8%
- 2008→2024 swing
- +2.7pp toward D · 2008: 35.9pp · 2024: 38.5pp
- All cycles
- 2024: D+38.5 2020: D+39.9 2016: D+37.5 2012: D+34.6 2008: D+35.9
Not yet ingested
- Civics
- —
Market trends
- HPI YoY
- ▼ -242.24%
- Current HPI
- 294.1916
- Rent YoY
- ▲ 5.86%
- Metro
- Milwaukee-Waukesha, WI
- State GDP YoY
- ▲ 2.10%
- F500 in state
- 20
Industry mix (Fortune 500 HQ in WI)
| Industry | F500 HQs | Revenue |
|---|---|---|
| Industrial Machinery | 4 | $23B |
|
||
| Industrial Technology | 2 | $36B |
|
||
| Insurance | 1 | $36B |
|
||
| Professional Services | 1 | $19B |
|
||
| Utilities | 1 | $9B |
|
||
| Consumer Goods | 1 | $3B |
|
||
Price history
+104.8% since first listed2 events — show timeline
- 2026-06-17 Listed $169,000 METROMLS
- 2000-10-13 Sold (Public Records) $82,500 Public Records
Property tax history
-0.2%/yrLatest (2024): $2,411 · +7.8% YoY. Source: county tax records.
Cash-flow waterfall
monthlySold comps — $/sqft
last 12 mo · ≤1 miLoading sold comps…