2801 Somerset Dr #401 · Lauderdale Lakes, FL
Flood risk 1/10 · Minimal
- FEMA flood zone
- AH
- Chance of flooding over 30 yrs
- 0.0%
- Est. flood insurance / yr
- $1,142 – $2,507
Fire risk 1/10 · Minimal
- Est. fire insurance / yr
- $947 – $1,759
Heat risk 10/10 · Severe
- Hot days now (above 105°F)
- 7 days/yr
- Hot days in 30 yrs
- 29 days/yr
Wind risk 10/10 · Severe
- Chance of severe wind over 30 yrs
- 99.0%
Air-quality risk 3/10 · Minor
- Unhealthy air days now
- 3 days/yr
- Unhealthy air days in 30 yrs
- 3 days/yr
Risk factors via First Street. Map © Google.
Why this score? — see what drove the B- grade
The composite is a weighted blend of 9 inputs, each scored 0–100. Each bar is that input's sub-score; the figure is the points it added to the 100-point composite (weight × sub-score).
- Cash flow +27.2/30.0
- 1% rule +10.0/10.0
- DSCR +9.4/10.0
- ARV discount +7.5/15.0
- Schools +4.1/10.0
- Livability +4.0/5.0
- Rent growth +3.2/5.0
- Condition / age +2.5/5.0
- Appreciation +0.0/10.0
$120,000
🖨 Deal sheet 📄 Offer letter ✓ Due diligence
Listing remarks
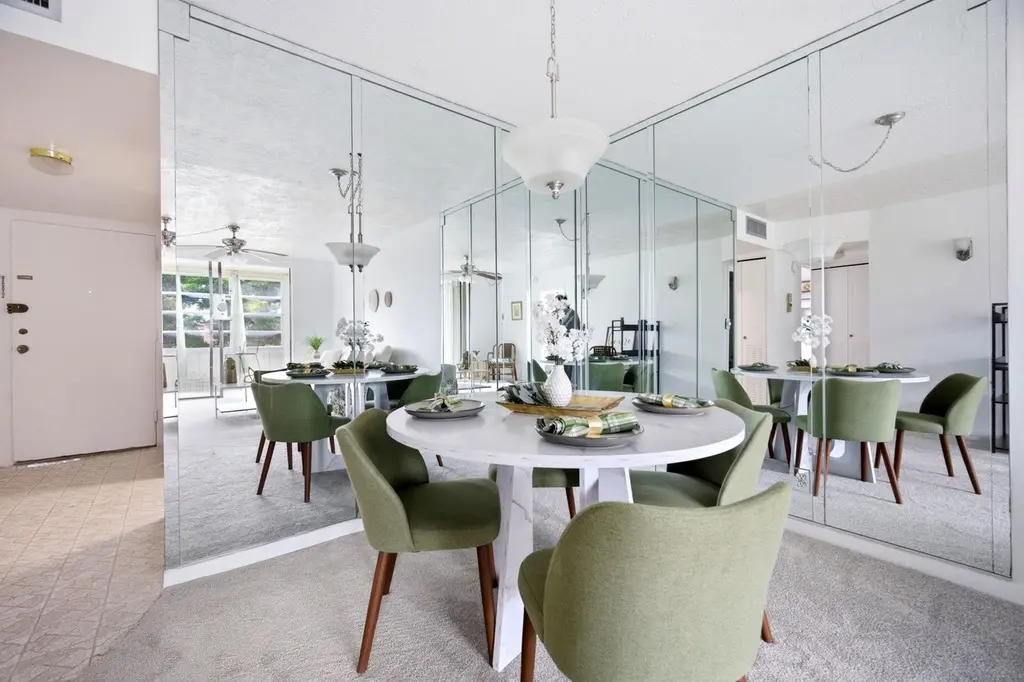
This 55+ unit in the Somerset community is waiting for you to move in and make it your own! Fresh paint, new carpet, and updated fixtures! Plenty of amenities to keep you active and busy! Quiet community for peace of mind and tranquility. Close to I-95 and the Turnpike, making shopping and the beaches minutes away! 50-year inspection passed and roof replaced in 2025. Schedule your showing today!
Key facts
- Updated fixtures
- Roof replaced
- $440 HOA
Tags
Property features AI
Finance
- Other: Senior community; Use entrance off Oakland Park Boulevard for directions
- HOA & community: Has association; Monthly HOA fee: $440; Association amenities include pool and pickleball court(s); HOA fee covers grounds maintenance, structure maintenance, pest control, elevator, recreation facilities, and pool service
Exterior
- Parking: Assigned parking
- Security: Security fence
- Home design: Condominium; Resale property; 4-story building; Building name: G; Not waterfront
- Construction: Block construction
- Exterior features: Fenced
Interior
- Kitchen: Disposal; Dishwasher; Electric range; Refrigerator
- Bedrooms: No main-level bedrooms
- Flooring: Carpet; Tile
- Bathrooms: 2 full bathrooms
- Heating & cooling: Central heating; Central air; Ceiling fans
- Interior features: Walk-in closets
Neighborhood map
What this means for you Summary
Snapshot
- This is a 2-bed/2.0-bath condo listed at $120k.
Deal economics
- At list price, monthly cash flow is $190 ($2k/yr) — positive.
- The deal already cash-flows at list — no discount required.
- Meets the 1% rule at list price ($2k rent vs $120k).
- Recommended offer: $109k (9.0% below list) — sets the bar for market timing.
- Cap rate 9.7% vs local median 5.6% in Lauderdale Lakes — top-decile yield for the area; either an underpriced asset or a hidden risk that comps aren't pricing in. Stress-test before assuming the spread holds.
Location & tenants
- Location reads 81/100 on livability (#100 in FL, #1,527 nationally) — a professional / high-income tenant draw. Strengths: commute A+, cost of living A+, housing A+; Watch: crime D+, amenities F, employment F.
- Broward (suburban): math 42% / reading 53% proficiency, ranked #46 of 73 in FL (top 63%) — families likely to look elsewhere, expect single-tenant / working-renter base with shorter leases.
- Zoned schools: Rock Island Elementary School (math 32% / reading 22%, grade F, #1,969 of 2,144 statewide, top 94%, 454 students, 91% FRL); William Dandy Middle School (math 26% / reading 37%, grade F, #453 of 571 statewide, top 81%, 784 students, 84% FRL); Boyd H. Anderson High School (math 10% / reading 14%, grade F, #622 of 667 statewide, top 93%, 2,038 students, 72% FRL) — zoned schools average 82% FRL vs 51% district-wide (31 pts higher); higher-poverty schools than district average — tighter screening recommended.
- Zoned-school proficiency averages 24% at this address vs 48% district-wide (-24 pts) — the specific schools serving this property underperform the Broward average; the district grade overstates school quality for this exact location.
- Market conditions: Rents rising (+2.8%/yr); 585 active listings in the ZIP; 40 comparable units currently listed for rent nearby; rentals at typical pace (median 21d on market — plan ~3-4 weeks tenant-placement turnaround); 2,111 units permitted in Broward County in 2024 (1,265 in 5+ unit buildings).
- This rent runs 42% of the median local income ($54k/yr) — at the standard rent-burdened threshold; future hikes will face affordability resistance.
Forward outlook
- Local home prices are declining (-3.0%/yr); year-one equity from $830 of loan paydown is wiped out by about $4k of value loss. Plan a longer hold.
- Broward County population projected at +34% by 2050 — long-run rental-demand tailwind backs the buy-and-hold thesis.
Negotiation context
- It's been on market 99 days — a 9% lower offer ($109k) is reasonable based on typical stale-listing flexibility.
- Current owner paid $25k; list at $120k implies a 380% gain — meaningful room to come down on a strong offer.
Risks & watch-outs
- Watch-outs: flood insurance adds $152/mo; HOA is 23% of rent.
- Climate carrying-cost: in FEMA flood zone AH (mandatory federal flood insurance); severe wind risk, 99% chance of damaging wind over 30y; extreme-heat days projected 7→29/yr by 2055 (HVAC capex compounding) — expect insurance premiums to compound above CPI over the hold.
Questions for the listing agent
- It's been on market 99 days. Have you received any prior offers? Is the seller open to a 9% concession, seller financing, or rate buy-down credit?
- Built in 1974 — when were the roof, HVAC, electrical panel, plumbing, and water heater last replaced?
- What's the actual annual flood-insurance premium (NFIP or private), and is the property in a SFHA with mandatory coverage?
- What does the HOA fee cover, when was the last increase, and are there any pending special assessments or reserve-fund shortfalls?
- Any open or pending special assessments — roof, HVAC, plumbing, elevator, façade? What's the per-unit balance and payoff schedule, and is the seller paying it off at close or rolling it to the buyer?
- Why hasn't it sold? Are there any deal-killer items the seller is aware of (foundation, flood, title, zoning, code violations)?
- Is there a deadline driving the sale (1031 exchange, divorce, estate, relocation)? That informs how much negotiation room exists.
- Crime grade is D in this area — have there been break-ins, vandalism, or insurance claims at this property in the last 3 years? What carrier currently insures it and at what premium?
- What's the average days-on-market for RENTAL listings here right now (not sales)? A rising rental-DOM trend means longer vacancies and softer asking-rent achievability than the comps imply.
- What's the recent tenant-quality profile in this submarket — average credit score on applications, eviction rate, late-payment / NSF rate, and stable-employment percentage? A property-management company in the area should have these aggregated.
- How much new apartment / multifamily construction is in the pipeline within 1–3 miles? Heavy new supply (>2% of stock underway) typically softens rents 12–24 months out; light construction supports rent growth.
Investment metrics
- 1% rule
- 1.57% ✓
- Cap rate
- 9.71%
- Cash-on-cash
- 12.22%
- DSCR
- 1.54
- GRM
- 5.3
CMA / ARV
No comps found within radius.
Projected returns pro-forma
-3.0% appreciation · 2.78% rent growth · sell at horizon
- IRR
- -6.0%
- Equity multiple
- 0.78×
- Total profit
- $-7,435
- Equity at exit
- $17,892
- IRR
- 3.6%
- Equity multiple
- 1.26×
- Total profit
- $8,706
- Equity at exit
- $10,375
Cash invested: $33,600 (down + closing). Projections, not guarantees.
Landlord ↔ Tenant lean methodology
- Overall (STATE)
- 87 Strongly Landlord-Friendly
- State Florida
- 87 Strongly Landlord-Friendly · R+3
- County
- — inherits STATE
- City
- — inherits STATE
ZIP-level market 33311
- Rents YoY
- 2.8%
- Active inventory
- 585
- Price-to-rent
- 5.3×
Monthly cashflow live
- Estimated rent
- $1,885 high interval (Pro) →
- Mortgage (P&I)
- −$629
- Tax from tax record
- −$28 /mo · $334/yr
- Insurance
- −$50
- Flood insurance flood zone
- −$152 /mo · $1,824/yr
- HOA
- −$440
- Vacancy / Maint / Mgmt
- −$396
- Net cashflow
- $190
Break-even live
UW: 25.0% down · 7.5% · 30yr · 1.5% tax · 5.0% vac · 8.0% maint · 8.0% mgmt
Financing live
Cash to close
- Down payment
- $30,000
- Closing costs
- $3,600
- Reserves months
- —
- Total cash needed
- —
Loan-product check · same deal, 3 products live
Conventional
25% down · 7.5% · 30yr
- Down + closing
- —
- Monthly P&I
- —
- Monthly cashflow
- —
- DSCR
- —
- Eligible?
- —
Personal DTI + credit; lowest rate.
DSCR
20% down · 8.5% · 30yr
- Down + closing
- —
- Monthly P&I
- —
- Monthly cashflow
- —
- DSCR
- —
- Eligible?
- —
No personal income docs; deal must DSCR.
Hard money
10% down · 12.0% · 12mo
- Down + closing
- —
- Monthly P&I
- —
- Monthly cashflow
- —
- DSCR
- —
- Eligible?
- —
Short-term bridge; refi at stabilization.
Rent comps 40 comps
| Address | Beds | Baths | Sqft | Rent | $/sqft | DOM | Units | Dist |
|---|---|---|---|---|---|---|---|---|
| 2801 Somerset Dr Lauderdale Lakes, FL | 2.0 | 2.0 | 865 | $1,775 | $2.05 | 24d | 2 | 0.02mi |
| 2811 Somerset Dr #412 Lauderdale Lakes, FL | 2.0 | 2.0 | 865 | $1,700 | $1.97 | 7d | 1 | 0.03mi |
| 2851 Somerset Dr Lauderdale Lakes, FL | 1.0–2.0 | 1.0–2.0 | 827 | $1,700 | $2.06 | 2d | 2 | 0.04mi |
| 2821 Somerset Dr #217 Lauderdale Lakes, FL | 1.0 | 1.0 | 748 | $1,400 | $1.87 | 2d | 1 | 0.08mi |
| 2871 Somerset Dr #207 Lauderdale Lakes, FL | 1.0 | 1.0 | 644 | $1,400 | $2.17 | 24d | 1 | 0.09mi |
| 2841 Somerset Dr Lauderdale Lakes, FL | 1.0 | 1.0 | 696 | $1,598 | $2.30 | 11d | 3 | 0.09mi |
| 2800 Somerset Dr Unit 418J Lauderdale Lakes, FL | 2.0 | 2.0 | 1010 | $1,800 | $1.78 | 14d | 1 | 0.14mi |
| 2725 Somerset Dr Lauderdale Lakes, FL | 1.0–2.0 | 1.0–2.0 | 990 | $2,250 | $2.27 | 24d | 1 | 0.18mi |
| 2830 Somerset Dr Lauderdale Lakes, FL | 2.0 | 2.0 | 1010 | $1,925 | $1.91 | 10d | 2 | 0.20mi |
| 3390 NW 30th St Unit 3 Lauderdale Lakes, FL | 2.0 | 1.0 | 800 | $1,650 | $2.06 | 24d | 1 | 0.27mi |
| 3541 NW 30th Pl Lauderdale Lakes, FL | 1.0–3.0 | 1.0–2.0 | 865 | $2,076 | $2.40 | 1d | 14 | 0.45mi |
| 3621 NW 30th Ct Oakland Park, FL | 2.0 | 2.5 | 1104 | $2,695 | $2.44 | 13d | 1 | 0.49mi |
| 3115 Oakland Shores Dr Unit E208 Oakland Park, FL | 1.0 | 1.0 | 760 | $1,700 | $2.24 | 24d | 1 | 0.58mi |
| 3115 Oakland Shores Dr Unit E208 Oakland Park, FL | 1.0 | 1.0 | 760 | $1,600 | $2.11 | 5d | 1 | 0.58mi |
| 3710 NW 21st St #305 Lauderdale Lakes, FL | 2.0 | 2.0 | 1100 | $1,650 | $1.50 | 24d | 1 | 0.63mi |
| 3123 Oakland Shores Dr Unit D112 Oakland Park, FL | 1.0 | 1.0 | 760 | $1,450 | $1.91 | 10d | 1 | 0.63mi |
| 3123 Oakland Shores Dr Unit D112 Oakland Park, FL | 1.0 | 1.0 | 760 | $1,450 | $1.91 | 20d | 1 | 0.63mi |
| 3119 Oakland Shores Dr Unit C212 Oakland Park, FL | 1.0 | 1.0 | 760 | $1,380 | $1.82 | 24d | 1 | 0.63mi |
| 3119 Oakland Shores Dr Unit C110 Oakland Park, FL | 2.0 | 2.0 | 1050 | $1,800 | $1.71 | 7d | 1 | 0.63mi |
| 3082 S Oakland Forest Dr #1301 Oakland Park, FL | 2.0 | 2.5 | 1098 | $1,975 | $1.80 | 20d | 1 | 0.66mi |
| 3610 NW 21st St Lauderdale Lakes, FL | 1.0–2.0 | 1.0–2.0 | 950 | $1,750 | $1.84 | 24d | 2 | 0.66mi |
| 3610 NW 21st St #413 Lauderdale Lakes, FL | 2.0 | 2.0 | 1100 | $1,750 | $1.59 | 20d | 1 | 0.66mi |
| 3610 NW 21st St #308 Lauderdale Lakes, FL | 2.0 | 2.0 | 1100 | $1,750 | $1.59 | 22d | 1 | 0.66mi |
| 3700 NW 21st St #203 Lauderdale Lakes, FL | 1.0 | 1.0 | 800 | $1,500 | $1.88 | 20d | 1 | 0.67mi |
| 3048 NW 20th St Unit n/a Fort Lauderdale, FL | 3.0 | 2.0 | 1107 | $2,800 | $2.53 | 24d | 1 | 0.68mi |
| 2700 NW 39th Way Lauderdale Lakes, FL | 2.0–3.0 | 1.0–1.5 | 858 | $1,750 | $2.04 | 3d | 6 | 0.69mi |
| 2040 NW 29th Ter Unit 2040 Fort Lauderdale, FL | 2.0 | 1.0 | 916 | $2,400 | $2.62 | 7d | 1 | 0.70mi |
| 2040 NW 29th Ter Unit 2040 Fort Lauderdale, FL | 2.0 | 1.0 | 916 | $2,600 | $2.84 | 14d | 1 | 0.70mi |
| 2721 NW 25th St Fort Lauderdale, FL | 3.0 | 2.0 | 1015 | $3,000 | $2.96 | 1d | 1 | 0.73mi |
| 3540 NW 34th Ter Lauderdale Lakes, FL | 2.0 | 1.0 | 1056 | $1,200 | $1.14 | 17d | 1 | 0.77mi |
| 4141 NW 26th St #316 Lauderhill, FL | 1.0 | 1.0 | 624 | $1,450 | $2.32 | 24d | 1 | 0.83mi |
| 2720 S Oakland Forest Dr Oakland Park, FL | 2.0 | 2.0 | 1100 | $2,050 | $1.86 | 24d | 1 | 0.85mi |
| 4121 NW 26th St Unit T16 Lauderhill, FL | 1.0 | 1.5 | 750 | $1,500 | $2.00 | 24d | 1 | 0.85mi |
| 2740 NW 21st St Unit 1261589P Fort Lauderdale, FL | 3.0 | 2.0 | 1097 | $3,396 | $3.10 | 24d | 1 | 0.87mi |
| 2611 NW 21st St Fort Lauderdale, FL | 3.0 | 1.0 | 880 | $2,700 | $3.07 | 2d | 1 | 0.92mi |
| 2611 NW 21st St Fort Lauderdale, FL | 3.0 | 1.0 | 880 | $2,590 | $2.94 | 1d | 1 | 0.92mi |
| 2890 N Oakland Forest Dr #204 Oakland Park, FL | 2.0 | 2.0 | 992 | $2,000 | $2.02 | 19d | 1 | 0.92mi |
| 2890 N Oakland Forest Dr #111 Oakland Park, FL | 2.0 | 2.0 | 1038 | $2,000 | $1.93 | 7d | 1 | 0.92mi |
| 2111 NW 26th Ave Unit 2111 Fort Lauderdale, FL | 3.0 | 1.0 | 880 | $2,200 | $2.50 | 24d | 1 | 0.93mi |
| 2733 S Oakland Forest Dr Oakland Park, FL | 2.0 | 2.0 | 1050 | $2,200 | $2.10 | 24d | 1 | 0.94mi |
HOA detail condo
- Monthly dues
- $440 · $5,280/yr
- Assessments
- None detected in remarks — confirm with the listing agent.
Listing history 17 events
-
2026-06-18days on market $120,000 Active 99 DOM
-
2026-06-17days on market $120,000 Active 98 DOM
-
2026-06-16days on market $120,000 Active 97 DOM
-
2026-06-15days on market $120,000 Active 96 DOM
-
2026-06-13days on market $120,000 Active 94 DOM
-
2026-06-09days on market $120,000 Active 90 DOM
-
2026-06-07days on market $120,000 Active 88 DOM
-
2026-06-04days on market $120,000 Active 85 DOM
-
2026-06-03days on market $120,000 Active 84 DOM
-
2026-06-02days on market $120,000 Active 83 DOM
-
2026-06-01days on market $120,000 Active 82 DOM
-
2026-05-31days on market $120,000 Active 81 DOM
-
2026-03-27price $120,000
-
2026-02-27$130,000 Active
-
2001-08-14soldstatus $25,000
-
1975-09-01soldstatus $26,700
-
1975-02-01soldstatus $25,000
ⓘ Source: listings_history table (triggers on properties + properties_extension) + one-shot
backfill from property_details.listing_events for pre-trigger history.
Tax reassessment forecast FL · Resets to sale price
- Current annual tax
- $334 · $28/mo
- Projected year-2 tax
- $996 · $83/mo
- Expected delta
- +$662/yr (+$55/mo · 198.3%)
ⓘ Screening estimate from a state-policy table — verify with the county assessor before closing.
Climate risk First Street
- Flood 1/10 Low FEMA zone AH · 0% chance over 30 yrs
- Wildfire 1/10 Low
- Heat 10/10 Extreme 7 d/yr ≥105°F today · 29 d/yr by 30 yrs out
- Wind 10/10 Extreme 99% chance of damaging wind over 30 yrs
- Air quality 3/10 Moderate 3 unhealthy d/yr today · 3 by 30 yrs out
Nearby sold comps map
Loading sold comps map…
Walkable amenities ~0.75 mi
Loading nearby amenities…
Taxation est. · year 1
- Rental income
- $22,622
- − Mortgage interest
- −$6,722
- − Property taxes
- −$334
- − Insurance
- −$2,424
- − Repairs & maintenance
- −$1,810
- − Management
- −$1,810
- − HOA
- −$5,280
- − Depreciation
- −$3,491
- Taxable income
- $751
- Est. tax owed @ 24.0%
- −$180
- After-tax cash flow
- $2,101/yr
For passive investors: Depreciation is non-cash, so a rental often shows a tax loss while cash-flowing — sheltering income. Rental losses are passive: they offset passive income freely, and up to $25,000/yr can offset ordinary (W-2) income if you actively participate and your MAGI is under $100k (phasing out to $0 by $150k); unused losses carry forward. On sale, claimed depreciation is recaptured at up to 25%, and gains may owe capital-gains tax (a 1031 exchange can defer both). Figures are a year-1 estimate at your 24.0% rate — not tax advice; consult a CPA.
Schools (NCES district)
- District
- Broward
- NCES district ID
- 1200180
- Math proficiency
- 42% ▼ -18.00%
- Reading proficiency
- 53% ▼ -5.00%
- Median HH income
- $52,139
- Composite
- 40.88/100
- National rank
- #3621
- State rank
- #46 of 73 in FL
Livability — Lauderdale Lakes
- Score
- 81/100
- State rank
- #100
- US rank
- #1527
Category grades
Schools grade is shown separately in the Schools card above.
Census & demographics
- Census place
- Lauderdale Lakes, FL
- County
- Broward County · 1,963,430 people
- Metro
- Miami-Fort Lauderdale-Pompano Beach, FL
- Population (ZIP)
- 74,898
- Household income
- $53,973
- Rent vs Own
- Severe rent burden
- 5068.0
Population outlook (Broward County) Hauer SSP2
- Today (2025)
- 2,207,033 people
- By 2030
- 2,360,704 · +7.0%
- By 2040
- 2,661,208 · +20.6%
- By 2050
- 2,946,698 · +33.5%
- By 2075
- 3,602,273 · +63.2%
- By 2100
- 3,970,984 · +79.9%
Race, ethnicity, and origin ACS 2023
- Neighborhood character
- Predominantly Black (77%)
- Race & ethnicity
- Black 77% Two or more races 9% White 9% Hispanic / Latino 9%
- Hispanic origin (detail)
- Mexican 1% Puerto Rican 2% Cuban 1%
- Common ancestry
- Hispanic 15% Lithuanian 1% Romanian 0%
- Foreign-born
- 24% · Canada, Jamaica
- Languages at home
- 78% English-only · French/Haitian/Cajun 14% Spanish 6% Other Indo-European 1%
Political lean MEDSL · Broward
- 2024 margin
- D (+17.0) · D 58.0% · R 41.0%
- 2008→2024 swing
- -17.8pp toward R · 2008: 34.7pp · 2024: 17.0pp
- All cycles
- 2024: D+17.0 2020: D+29.8 2016: D+35.0 2012: D+34.9 2008: D+34.7
Not yet ingested
- Civics
- —
Market trends
- HPI YoY
- ▼ -300.68%
- Current HPI
- 535.2504
- Rent YoY
- ▲ 2.78%
- Metro
- Miami-Fort Lauderdale-Pompano Beach, FL
- State GDP YoY
- ▲ 3.28%
- F500 in state
- 36
Industry mix (Fortune 500 HQ in FL)
| Industry | F500 HQs | Revenue |
|---|---|---|
| Industrial Technology | 2 | $29B |
|
||
| Insurance | 2 | $17B |
|
||
| Retail | 1 | $60B |
|
||
| Technology Distribution | 1 | $58B |
|
||
| Homebuilding | 1 | $35B |
|
||
| Technology Manufacturing | 1 | $35B |
|
||
Price history
+380.0% since first listed5 events — show timeline
- 2026-03-27 Price Changed $120,000 Beaches MLS
- 2026-02-27 Listed $130,000 Beaches MLS
- 2001-08-14 Sold (Public Records) $25,000 Public Records
- 1975-09-01 Sold (Public Records) $26,700 Public Records
- 1975-02-01 Sold (Public Records) $25,000 Public Records
Property tax history
-0.7%/yrLatest (2025): $334 · +0.0% YoY. Source: county tax records.
Cash-flow waterfall
monthlySold comps — $/sqft
last 12 mo · ≤1 miLoading sold comps…