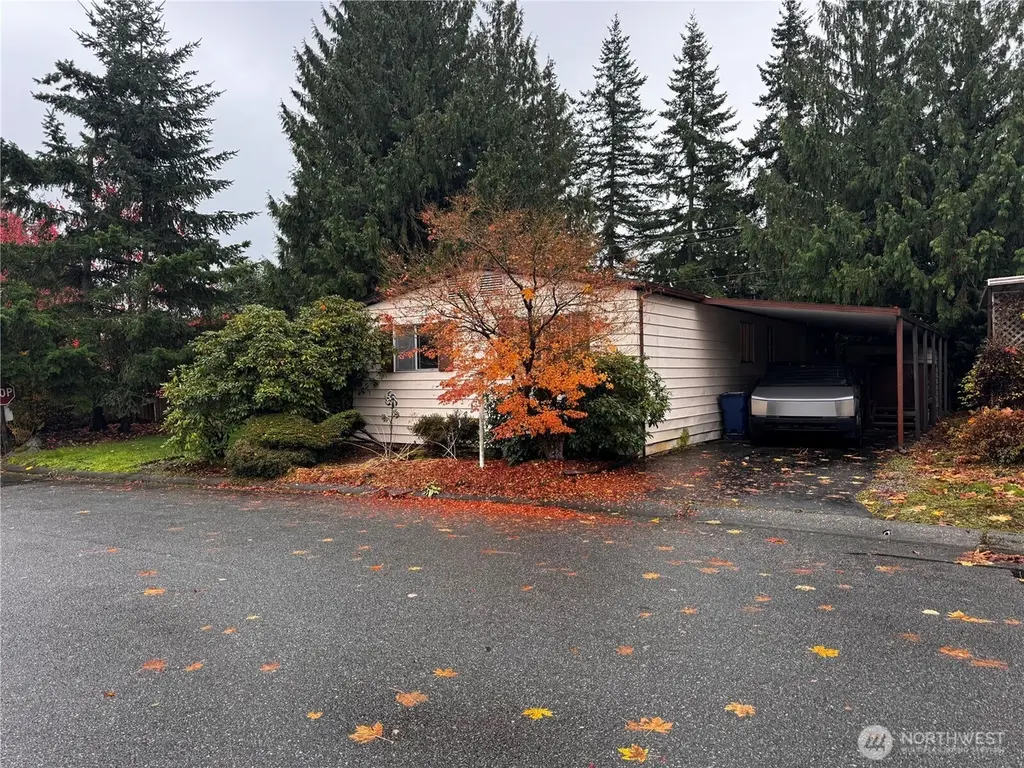
815 124th St SW #1 · Lake Stickney, WA
Flood risk No data
- FEMA flood zone
- —
- Chance of flooding over 30 yrs
- —
- Est. flood insurance / yr
- —
Fire risk No data
- Est. fire insurance / yr
- —
Heat risk No data
- Hot days now (above threshold)
- —
- Hot days in 30 yrs
- —
Wind risk No data
- Chance of severe wind over 30 yrs
- —
Air-quality risk No data
- Unhealthy air days now
- —
- Unhealthy air days in 30 yrs
- —
Risk factors via First Street. Map © Google.
Why this score? — see what drove the B+ grade
The composite is a weighted blend of 9 inputs, each scored 0–100. Each bar is that input's sub-score; the figure is the points it added to the 100-point composite (weight × sub-score).
- Cash flow +30.0/30.0
- ARV discount +15.0/15.0
- 1% rule +10.0/10.0
- DSCR +10.0/10.0
- Schools +4.8/10.0
- Livability +3.7/5.0
- Condition / age +2.5/5.0
- Rent growth +2.1/5.0
- Appreciation +0.0/10.0
$99,000
🖨 Deal sheet 📄 Offer letter ✓ Due diligence
Listing remarks
Welcome to this desirable 55+ gated community! This charming and well-maintained home offers comfortable, low-maintenance living with modern updates throughout. Inside, you’ll find a spacious primary suite and stylish vinyl plank flooring. The bright kitchen includes a cozy eating area and is enhanced by modern light fixtures with NEW cook top range and NEW oven. Relax in the inviting living room, complete with a warm fireplace, built-in storage, and custom bookshelves — perfect for displaying décor or your favorite reads. Additional conveniences include an in-unit washer and dryer, a covered carport, and extra storage. A wonderful blend of comfort, style, and community a
Key facts
- Gated community
- Modern updates
- Covered carport
Tags
Neighborhood map
What this means for you Summary
Snapshot
- This is a 3-bed/2.0-bath manufactured listed at $99k.
Deal economics
- At list price, monthly cash flow is $1k ($15k/yr) — positive.
- The deal already cash-flows at list — no discount required.
- Meets the 1% rule at list price ($2k rent vs $99k).
- Recommended offer: $87k (12.0% below list) — sets the bar for market timing.
- Cap rate 21.5% vs local median 2.4% in Lake Stickney — top-decile yield for the area; either an underpriced asset or a hidden risk that comps aren't pricing in. Stress-test before assuming the spread holds.
Location & tenants
- Location reads 73/100 on livability (#192 in WA) — a middle-class / working-renter tenant base. Strengths: commute A+, employment A, health & safety A; Watch: schools D, amenities D-, cost of living F.
- Mukilteo School District (suburban): math 47% / reading 59% proficiency, ranked #111 of 291 in WA (top 38%) — acceptable for families but not a draw, mixed tenant base, ~2y average lease.
- Market conditions: Rents soft (-1.7%/yr); 167 active listings in the ZIP; 40 comparable units currently listed for rent nearby; rentals leasing fast (median 5d on market — plan ~1-2 weeks tenant-placement turnaround); 3,982 units permitted in Snohomish County in 2024 (1,492 in 5+ unit buildings).
- This rent runs 42% of the median local income ($69k/yr) — at the standard rent-burdened threshold; future hikes will face affordability resistance.
Forward outlook
- Local home prices are declining (-3.0%/yr); year-one equity from $684 of loan paydown is wiped out by about $3k of value loss. Plan a longer hold.
- Snohomish County population projected at +30% by 2050 — long-run rental-demand tailwind backs the buy-and-hold thesis.
- At projected returns (-3.0% appreciation + 0.0% rent growth), your $28k cash investment doubles in ~3 years — after that, you're playing with house money.
Negotiation context
- It's been on market 223 days — a 12% lower offer ($87k) is reasonable based on typical stale-listing flexibility.
Questions for the listing agent
- It's been on market 223 days. Have you received any prior offers? Is the seller open to a 12% concession, seller financing, or rate buy-down credit?
- Built in 1978 — when were the roof, HVAC, electrical panel, plumbing, and water heater last replaced?
- Why hasn't it sold? Are there any deal-killer items the seller is aware of (foundation, flood, title, zoning, code violations)?
- Is there a deadline driving the sale (1031 exchange, divorce, estate, relocation)? That informs how much negotiation room exists.
- Schools are D-rated, which usually means shorter tenancies and higher turnover. Who's the typical renter profile here, and what's been the actual vacancy rate?
- What's the average days-on-market for RENTAL listings here right now (not sales)? A rising rental-DOM trend means longer vacancies and softer asking-rent achievability than the comps imply.
- What's the recent tenant-quality profile in this submarket — average credit score on applications, eviction rate, late-payment / NSF rate, and stable-employment percentage? A property-management company in the area should have these aggregated.
- How much new for-sale + rental construction is in the pipeline within 1–3 miles? Heavy new supply typically softens prices + rents 12–24 months out; constrained supply supports both.
Investment metrics
- 1% rule
- 2.43% ✓
- Cap rate
- 21.50%
- Cash-on-cash
- 54.32%
- DSCR
- 3.42
- GRM
- 3.4
CMA / ARV
- ARV (median comp)
- $192,776
- List price
- $99,000
- Delta
- -48.65%
- Verdict
- UNDERPRICED
- Comps
- 18 within 1.0 mi
Show comp detail 12 sales within ~0.75 mi
| Address | Dist | Beds/Ba | Sqft | Sold | Price | $/sf | Match |
|---|---|---|---|---|---|---|---|
| 815 124th St SW | 0.00mi | 2/2.0 (-1) | 1,458 (-0%) | 2mo | $290,000 | $199 | 93 |
| 815 124th St SW #52 | 0.00mi | 2/2.0 (-1) | 1,436 (-2%) | 4mo | $149,900 | $104 | 89 |
| 815 124th St SW #27 | 0.00mi | 2/2.0 (-1) | 1,436 (-2%) | 9mo | $105,000 | $73 | 85 |
| 815 124th St SW #22 | 0.00mi | 2/2.0 (-1) | 1,436 (-2%) | 10mo | $200,000 | $139 | 84 |
| 815 124th St SW #29 | 0.00mi | 2/2.0 (-1) | 1,440 (-1%) | 12mo | $264,950 | $184 | 83 |
| 815 124 St SW #117 | 0.00mi | 2/2.0 (-1) | 1,334 (-9%) | 6mo | $130,000 | $97 | 76 |
| 815 124th St SW #140 | 0.00mi | 3/2.0 | 1,319 (-10%) | 11mo | $230,000 | $174 | 75 |
| 11500 Meridian Ave S #91 | 0.68mi | 3/2.0 | 1,456 (-0%) | 2mo | $226,000 | $155 | 67 |
| 12605 E Gibson Rd #50 | 0.25mi | 3/2.0 | 1,325 (-9%) | 14mo | $165,000 | $125 | 62 |
| 12030 2nd Dr SE | 0.72mi | 2/2.0 (-1) | 1,436 (-2%) | 10mo | $485,000 | $338 | 51 |
| 11500 Meridian Ave S #49 | 0.68mi | 3/2.0 | 1,620 (+11%) | 3mo | $245,000 | $151 | 48 |
| 11500 Meridian Ave S #22 | 0.68mi | 3/2.0 | 1,290 (-12%) | 10mo | $199,000 | $154 | 41 |
Match score weights: distance 35% · size 25% · config 20% · recency 20%. Top-matched comps best support the ARV.
Projected returns pro-forma
-3.0% appreciation · 0.0% rent growth · sell at horizon
- IRR
- 49.1%
- Equity multiple
- 3.05×
- Total profit
- $56,838
- Equity at exit
- $14,761
- IRR
- 53.4%
- Equity multiple
- 5.52×
- Total profit
- $125,193
- Equity at exit
- $8,560
Cash invested: $27,720 (down + closing). Projections, not guarantees.
Landlord ↔ Tenant lean methodology
- Overall (STATE)
- 28 Tenant-Leaning
- State Washington
- 28 Tenant-Leaning · D+8
- County
- — inherits STATE
- City
- — inherits STATE
ZIP-level market 98204
- Rents YoY
- -1.7%
- Active inventory
- 167
- Price-to-rent
- 3.4×
Monthly cashflow live
- Estimated rent
- $2,408 high interval (Pro) →
- Mortgage (P&I)
- −$519
- Tax from tax record
- −$87 /mo · $1,040/yr
- Insurance
- −$41
- HOA
- −$0
- Vacancy / Maint / Mgmt
- −$506
- Net cashflow
- $1,255
Break-even live
UW: 25.0% down · 7.5% · 30yr · 1.5% tax · 5.0% vac · 8.0% maint · 8.0% mgmt
Financing live
Cash to close
- Down payment
- $24,750
- Closing costs
- $2,970
- Reserves months
- —
- Total cash needed
- —
Loan-product check · same deal, 3 products live
Conventional
25% down · 7.5% · 30yr
- Down + closing
- —
- Monthly P&I
- —
- Monthly cashflow
- —
- DSCR
- —
- Eligible?
- —
Personal DTI + credit; lowest rate.
DSCR
20% down · 8.5% · 30yr
- Down + closing
- —
- Monthly P&I
- —
- Monthly cashflow
- —
- DSCR
- —
- Eligible?
- —
No personal income docs; deal must DSCR.
Hard money
10% down · 12.0% · 12mo
- Down + closing
- —
- Monthly P&I
- —
- Monthly cashflow
- —
- DSCR
- —
- Eligible?
- —
Short-term bridge; refi at stabilization.
Rent comps 40 comps
| Address | Beds | Baths | Sqft | Rent | $/sqft | DOM | Units | Dist |
|---|---|---|---|---|---|---|---|---|
| 820 124th St SW Apt D Everett, WA | 2.0 | 1.5 | 960 | $1,595 | $1.66 | 5d | 1 | 0.09mi |
| 12522 8th Ave W Everett, WA | 1.0–3.0 | 1.0–2.0 | 1005 | $2,496 | $2.48 | 5d | 8 | 0.16mi |
| 12600 4th Ave W Everett, WA | 2.0 | 2.5 | 1336 | $2,295 | $1.72 | 17d | 1 | 0.24mi |
| 222 124th St SW Unit A2 Everett, WA | 3.0 | 2.5 | 1560 | $2,975 | $1.91 | 5d | 1 | 0.32mi |
| 12121 Admiralty Way Everett, WA | 1.0–3.0 | 1.0–2.0 | 1116 | $2,855 | $2.56 | 3d | 18 | 0.36mi |
| 12433 Admiralty Way Everett, WA | 1.0–3.0 | 1.0–2.0 | 1073 | $2,849 | $2.65 | 2d | 32 | 0.37mi |
| 11812 E Gibson Rd Everett, WA | 2.0 | 2.0 | 956 | $1,810 | $1.89 | 2d | 7 | 0.40mi |
| 1007 130th St SW Everett, WA | 1.0–2.0 | 1.0–2.0 | 796 | $1,800 | $2.26 | 2d | 9 | 0.40mi |
| 1108 Center Rd Everett, WA | 2.0 | 2.0 | 1200 | $2,150 | $1.79 | 15d | 1 | 0.43mi |
| 12402 Admiralty Way Everett, WA | 1.0–3.0 | 1.0–2.0 | 842 | $2,370 | $2.81 | 2d | 16 | 0.44mi |
| 11727 12th Ave W #77 Everett, WA | 3.0 | 2.5 | 1533 | $3,100 | $2.02 | 22d | 1 | 0.45mi |
| 11719 12th Ave W Everett, WA | 3.0 | 2.5 | 1533 | $2,800 | $1.83 | 44d | 1 | 0.46mi |
| 12907 E Gibson Rd Everett, WA | 1.0–2.0 | 1.0–2.0 | 859 | $2,085 | $2.43 | 5d | 4 | 0.46mi |
| 12907 E Gibson Rd Everett, WA | 1.0–2.0 | 1.0–2.0 | 775 | $2,081 | $2.69 | 2d | 5 | 0.46mi |
| 12530 Admiralty Way Unit D304 Everett, WA | 2.0 | 2.0 | 1050 | $2,400 | $2.29 | 5d | 1 | 0.61mi |
| 13004 Meridian Ave S Everett, WA | 1.0–3.0 | 1.0–2.0 | 1025 | $2,280 | $2.22 | 2d | 1 | 0.62mi |
| 133 124th St SE Everett, WA | 1.0–2.0 | 1.0–2.0 | 820 | $2,055 | $2.50 | 2d | 9 | 0.65mi |
| 1020 112th St SW Everett, WA | 1.0–2.0 | 1.0–2.0 | 853 | $1,752 | $2.05 | 2d | 7 | 0.66mi |
| 128 127th St SE Everett, WA | 3.0 | 1.0–2.0 | 884 | $3,296 | $3.73 | 2d | 10 | 0.66mi |
| 11207 9th Pl W Everett, WA | 2.0 | 1.0 | 995 | $1,899 | $1.91 | 20d | 7 | 0.71mi |
| 923 112th St SW Everett, WA | 1.0–3.0 | 1.0–2.0 | 858 | $2,305 | $2.69 | 2d | 24 | 0.76mi |
| 305 127th St SE Unit A Everett, WA | 2.0 | 2.5 | 1456 | $2,649 | $1.82 | 44d | 1 | 0.78mi |
| 4 112th St SW Unit A Everett, WA | 3.0 | 2.5 | 1661 | $3,300 | $1.99 | 44d | 1 | 0.85mi |
| 12118 Highway 99 Everett, WA | 1.0–5.0 | 1.0–3.0 | 1117 | $2,236 | $2.00 | 2d | 5 | 0.87mi |
| 1730 112th St SW Everett, WA | 1.0–2.0 | 1.0–2.0 | 805 | $2,100 | $2.61 | 2d | 6 | 0.90mi |
| 13117 3rd Ave SE Unit J1 Everett, WA | 3.0 | 3.0 | 1659 | $3,249 | $1.96 | 44d | 1 | 0.92mi |
| 11026 Meridian Dr SE Everett, WA | 3.0 | 2.5 | 1700 | $3,000 | $1.76 | 44d | 1 | 0.96mi |
| 418 138th Pl SW Everett, WA | 3.0 | 2.0 | 1600 | $3,000 | $1.88 | 44d | 1 | 0.96mi |
| 11401 3rd Ave SE Everett, WA | 2.0 | 1.0–2.0 | 862 | $1,962 | $2.28 | 2d | 13 | 1.00mi |
| 11625 Center Rd Unit C Everett, WA | 3.0 | 2.5 | 1608 | $3,200 | $1.99 | 44d | 1 | 1.03mi |
| 2301 116th St SW Unit E Everett, WA | 3.0 | 2.5 | 1400 | $2,595 | $1.85 | 44d | 1 | 1.06mi |
| 14029 9th Pl W Lynnwood, WA | 4.0 | 2.5 | 1777 | $3,200 | $1.80 | 5d | 1 | 1.09mi |
| 2020 Hollow Dale Pl Unit A Everett, WA | 3.0 | 2.5 | 1525 | $2,650 | $1.74 | 44d | 1 | 1.15mi |
| 609 142nd St SW Lynnwood, WA | 3.0 | 2.0 | 1646 | $3,399 | $2.07 | 44d | 1 | 1.16mi |
| 515 112th St SE Everett, WA | 2.0–3.0 | 2.0–2.5 | 1050 | $2,345 | $2.23 | 3d | 3 | 1.16mi |
| 525 112th St SE Everett, WA | 1.0–2.0 | 1.0–2.0 | 1019 | $2,416 | $2.37 | 2d | 6 | 1.18mi |
| 12318 26th Pl W Everett, WA | 3.0 | 2.5 | 1558 | $3,000 | $1.93 | 5d | 1 | 1.21mi |
| 13730 Manor Way Unit F2 Lynnwood, WA | 3.0 | 3.5 | 1626 | $3,400 | $2.09 | 44d | 1 | 1.26mi |
| 13510 N Creek Dr Mill Creek, WA | 1.0–4.0 | 1.0–2.0 | 1020 | $2,024 | $1.98 | 4d | 1 | 1.30mi |
| 13401 Dumas Rd Mill Creek, WA | 1.0–2.0 | 1.0–2.0 | 872 | $2,237 | $2.56 | 2d | 5 | 1.34mi |
Listing history 18 events
-
2026-06-18days on market $99,000 Active 223 DOM
-
2026-06-17days on market $99,000 Active 222 DOM
-
2026-06-16days on market $99,000 Active 221 DOM
-
2026-06-15days on market $99,000 Active 220 DOM
-
2026-06-13days on market $99,000 Active 218 DOM
-
2026-06-09days on market $99,000 Active 214 DOM
-
2026-06-08days on market $99,000 Active 213 DOM
-
2026-06-07days on market $99,000 Active 212 DOM
-
2026-06-04days on market $99,000 Active 209 DOM
-
2026-06-03days on market $99,000 Active 208 DOM
-
2026-06-02days on market $99,000 Active 207 DOM
-
2026-06-01days on market $99,000 Active 206 DOM
-
2026-05-31days on market $99,000 Active 205 DOM
-
2026-04-23price $99,000
-
2026-03-05price $110,000
-
2026-01-22price $120,000
-
2025-12-02price $150,000
-
2025-11-07$175,000 Active
ⓘ Source: listings_history table (triggers on properties + properties_extension) + one-shot
backfill from property_details.listing_events for pre-trigger history.
Tax reassessment forecast WA · Resets to sale price
- Current annual tax
- $1,040 · $87/mo
- Projected year-2 tax
- $1,040 · $87/mo
- Expected delta
- $0/yr ($0/mo · 0.0%)
ⓘ Screening estimate from a state-policy table — verify with the county assessor before closing.
Nearby sold comps map
Loading sold comps map…
Walkable amenities ~0.75 mi
Loading nearby amenities…
Taxation est. · year 1
- Rental income
- $28,891
- − Mortgage interest
- −$5,546
- − Property taxes
- −$1,040
- − Insurance
- −$495
- − Repairs & maintenance
- −$2,311
- − Management
- −$2,311
- − Depreciation
- −$2,880
- Taxable income
- $14,307
- Est. tax owed @ 24.0%
- −$3,434
- After-tax cash flow
- $11,624/yr
For passive investors: Depreciation is non-cash, so a rental often shows a tax loss while cash-flowing — sheltering income. Rental losses are passive: they offset passive income freely, and up to $25,000/yr can offset ordinary (W-2) income if you actively participate and your MAGI is under $100k (phasing out to $0 by $150k); unused losses carry forward. On sale, claimed depreciation is recaptured at up to 25%, and gains may owe capital-gains tax (a 1031 exchange can defer both). Figures are a year-1 estimate at your 24.0% rate — not tax advice; consult a CPA.
Schools (NCES district)
- District
- Mukilteo School District
- NCES district ID
- 5305430
- Math proficiency
- 47% ▼ -2.00%
- Reading proficiency
- 59% ▬ 0.00%
- Median HH income
- $60,807
- Composite
- 48.17/100
- National rank
- #4733
- State rank
- #111 of 291 in WA
Livability — Lake Stickney
- Score
- 73/100
- State rank
- #192
- US rank
- #5224
Category grades
Schools grade is shown separately in the Schools card above.
Census & demographics
- County
- Snohomish County · 786,756 people
- Metro
- Seattle-Tacoma-Bellevue, WA
- Population (ZIP)
- 45,130
- Household income
- $68,513
- Rent vs Own
- Severe rent burden
- 2874.0
Population outlook (Snohomish County) Hauer SSP2
- Today (2025)
- 899,800 people
- By 2030
- 960,975 · +6.8%
- By 2040
- 1,074,447 · +19.4%
- By 2050
- 1,171,954 · +30.2%
- By 2075
- 1,384,849 · +53.9%
- By 2100
- 1,497,296 · +66.4%
Race, ethnicity, and origin ACS 2023
- Neighborhood character
- Highly diverse neighborhood (Simpson 0.71)
- Race & ethnicity
- White 46% Hispanic / Latino 22% Asian 14% Two or more races 11% Black 9% Pacific Islander 2%
- Hispanic origin (detail)
- Mexican 17%
- Common ancestry
- Subsaharan African 4% Italian 2% Portuguese 2%
- Foreign-born
- 31% · Canada, Vietnam, South Korea
- Languages at home
- 58% English-only · Spanish 18% Russian/Polish/Slavic 6% Vietnamese 5%
Political lean MEDSL · Snohomish
- 2024 margin
- D (+19.0) · D 57.8% · R 38.9% · Other 3.3%
- 2008→2024 swing
- +0.1pp no change · 2008: 18.9pp · 2024: 19.0pp
- All cycles
- 2024: D+19.0 2020: D+20.6 2016: D+16.6 2012: D+16.2 2008: D+18.9
Not yet ingested
- Civics
- —
Market trends
- HPI YoY
- ▼ -540.03%
- Current HPI
- 321.7923
- Rent YoY
- ▼ -1.70%
- Metro
- Seattle-Tacoma-Bellevue, WA
- State GDP YoY
- ▲ 4.65%
- F500 in state
- 22
Industry mix (Fortune 500 HQ in WA)
| Industry | F500 HQs | Revenue |
|---|---|---|
| Retail | 2 | $269B |
|
||
| Technology / Retail | 1 | $638B |
|
||
| Technology | 1 | $245B |
|
||
| Telecommunications | 1 | $38B |
|
||
| Food / Beverage | 1 | $36B |
|
||
| Automotive / Trucks | 1 | $34B |
|
||
Price history
-43.4% since first listed5 events — show timeline
- 2026-04-23 Price Changed $99,000 NWMLS as Distributed by MLS Grid
- 2026-03-05 Price Changed $110,000 NWMLS as Distributed by MLS Grid
- 2026-01-22 Price Changed $120,000 NWMLS as Distributed by MLS Grid
- 2025-12-02 Price Changed $150,000 NWMLS as Distributed by MLS Grid
- 2025-11-07 Listed $175,000 NWMLS as Distributed by MLS Grid
Property tax history
+11.3%/yrLatest (2026): $1,040 · +10011.7% YoY. Source: county tax records.
Cash-flow waterfall
monthlySold comps — $/sqft
last 12 mo · ≤1 miLoading sold comps…