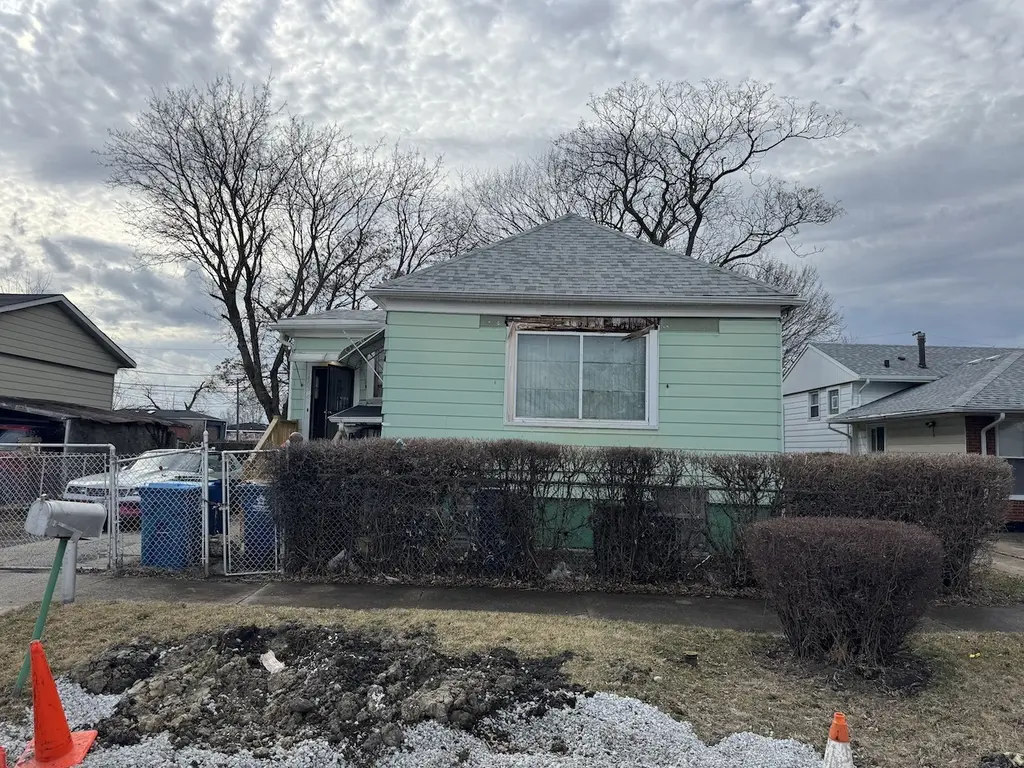
14630 Cooper Ave · Dixmoor, IL
Flood risk 4/10 · Minor
- FEMA flood zone
- AH
- Chance of flooding over 30 yrs
- 0.22%
- Est. flood insurance / yr
- $810 – $3,808
Fire risk 1/10 · Minimal
- Est. fire insurance / yr
- $804 – $1,492
Heat risk 3/10 · Minor
- Hot days now (above 102°F)
- 7 days/yr
- Hot days in 30 yrs
- 15 days/yr
Wind risk 2/10 · Minimal
- Chance of severe wind over 30 yrs
- —
Air-quality risk 3/10 · Minor
- Unhealthy air days now
- 4 days/yr
- Unhealthy air days in 30 yrs
- 4 days/yr
Risk factors via First Street. Map © Google.
Why this score? — see what drove the C- grade
The composite is a weighted blend of 9 inputs, each scored 0–100. Each bar is that input's sub-score; the figure is the points it added to the 100-point composite (weight × sub-score).
- Cash flow +15.0/30.0
- Appreciation +10.0/10.0
- ARV discount +7.5/15.0
- 1% rule +5.0/10.0
- DSCR +5.0/10.0
- Livability +3.8/5.0
- Rent growth +2.5/5.0
- Condition / age +2.5/5.0
- Schools +0.7/10.0
$30,000
🖨 Deal sheet (PDF) 📄 Offer letter ✓ Due diligence
Listing remarks
Attention Investors! Come prepared to renovate this single-family home sitting on a spacious double lot that boasts 3 bedrooms, 2 bathrooms, and a 2-car detached garage, offering a fantastic value-add opportunity. Beyond the property's immense potential, the home is conveniently located within West Harvey-Dixmoor SD 147. The location offers excellent proximity to everyday community amenities, sitting just minutes away from the Western Avenue commercial corridor, local municipal and police buildings, and major regional medical facilities like UChicago Medicine Ingalls Memorial Hospital and Grand Prairie Health Center.
Key facts
- Double lot
- 3,136 sq ft lot
- 2 garage spots
Tags
Neighborhood map
What this means for you Summary
Snapshot
- This is a 3-bed/1.0-bath single-family listed at $30k.
Deal economics
- At list price, monthly cash flow is $840 ($10k/yr) — positive.
- The deal already cash-flows at list — no discount required.
- Meets the 1% rule at list price ($2k rent vs $30k).
- Recommended offer: $30k (1.5% below list) — sets the bar for market timing.
Location & tenants
- Location reads 76/100 on livability (#202 in IL, #3,730 nationally) — a middle-class / working-renter tenant base. Strengths: commute A+, cost of living A+, housing A+; Watch: employment D, amenities F, health & safety F.
- Thornton Twp Hsd 205 (suburban): math 7% / reading 8% proficiency, ranked #594 of 620 in IL (top 96%) — low school quality limits family demand, transient renter base, plan for 1-2y turnover.
- Zoned schools: Martin L King Elem School (303 students, 0% FRL); Rosa L Parks Middle School (319 students, 0% FRL); Thornton Township High School (math 7% / reading 7%, grade F, #605 of 693 statewide, top 87%, 1,628 students, 0% FRL).
- Market conditions: 133 active listings in the ZIP; 3 comparable units currently listed for rent nearby; rentals at typical pace (median 26d on market — plan ~3-4 weeks tenant-placement turnaround); 6,272 units permitted in Cook County in 2024 (4,658 in 5+ unit buildings).
Forward outlook
- In year one you build about $3k of equity ($207 loan paydown + $3k appreciation (10.0% local appreciation)).
- At projected returns (10.0% appreciation + 3.0% rent growth), your $8k cash investment doubles in ~1 year — after that, you're playing with house money.
- By year 9, paydown + projected appreciation supports a ~$33k cash-out refi (75% LTV) — recoverable capital for the next deal without selling this one.
Negotiation context
- It's been on market 26 days — a 2% lower offer ($30k) is reasonable based on typical stale-listing flexibility.
Risks & watch-outs
- Watch-outs: flood insurance adds $192/mo; built in 1908 — expect roof / HVAC / electrical / plumbing capex.
- Climate carrying-cost: in FEMA flood zone AH (mandatory federal flood insurance) — expect insurance premiums to compound above CPI over the hold.
Questions for the listing agent
- Built in 1908 — when were the roof, HVAC, electrical panel, plumbing, and water heater last replaced?
- What's the actual annual flood-insurance premium (NFIP or private), and is the property in a SFHA with mandatory coverage?
- Is there a deadline driving the sale (1031 exchange, divorce, estate, relocation)? That informs how much negotiation room exists.
- Schools are F-rated, which usually means shorter tenancies and higher turnover. Who's the typical renter profile here, and what's been the actual vacancy rate?
- What's the average days-on-market for RENTAL listings here right now (not sales)? A rising rental-DOM trend means longer vacancies and softer asking-rent achievability than the comps imply.
- What's the recent tenant-quality profile in this submarket — average credit score on applications, eviction rate, late-payment / NSF rate, and stable-employment percentage? A property-management company in the area should have these aggregated.
- How much new for-sale + rental construction is in the pipeline within 1–3 miles? Heavy new supply typically softens prices + rents 12–24 months out; constrained supply supports both.
Investment metrics
- 1% rule
- 5.23% ✓
- Cap rate
- 47.59%
- Cash-on-cash
- 147.48%
- DSCR
- 7.56
- GRM
- 1.6
CMA / ARV
- ARV (on-the-fly)
- $124,950
- Comps found
- 12
Show comp detail 12 sales within ~0.75 mi
| Address | Dist | Beds/Ba | Sqft | Sold | Price | $/sf | Match |
|---|---|---|---|---|---|---|---|
| 14525 Oakley St | 0.21mi | 3/2.0 | 1,052 (+0%) | 7mo | $240,000 | $228 | 80 |
| 14839 Cooper Ave | 0.27mi | 3/1.0 | 992 (-6%) | 7mo | $42,000 | $42 | 72 |
| 110 W 150th St | 0.57mi | 3/1.0 | 1,008 (-4%) | 0mo | $101,250 | $100 | 66 |
| 14918 Western Ave | 0.48mi | 2/1.0 (-1) | 1,000 (-5%) | 1mo | $72,000 | $72 | 64 |
| 14542 S Campbell Ave | 0.72mi | 3/1.0 | 1,143 (+9%) | 2mo | $238,500 | $209 | 51 |
| 14921 Lincoln Ave | 0.49mi | 3/1.0 | 900 (-14%) | 6mo | $149,900 | $167 | 48 |
| 14911 Page Ave | 0.63mi | 3/1.5 | 923 (-12%) | 2mo | $110,000 | $119 | 47 |
| 14727 Wood St | 0.48mi | 3/1.5 | 900 (-14%) | 6mo | $60,000 | $67 | 46 |
| 14913 Leavitt Ave | 0.34mi | 4/2.0 (+1) | 1,200 (+14%) | 6mo | $168,000 | $140 | 46 |
| 15024 Western Ave | 0.59mi | 2/1.0 (-1) | 900 (-14%) | 3mo | $18,000 | $20 | 42 |
| 14902 Paulina St | 0.64mi | 2/1.0 (-1) | 1,200 (+14%) | 1mo | $90,000 | $75 | 41 |
| 14247 Davis Ct | 0.55mi | 3/2.0 | 1,206 (+15%) | 8mo | $262,000 | $217 | 39 |
Match score weights: distance 35% · size 25% · config 20% · recency 20%. Top-matched comps best support the ARV.
Projected returns pro-forma
10.0% appreciation · 3.0% rent growth · sell at horizon
- IRR
- —
- Equity multiple
- 9.33×
- Total profit
- $69,978
- Equity at exit
- $27,026
- IRR
- —
- Equity multiple
- 20.56×
- Total profit
- $164,285
- Equity at exit
- $58,283
Cash invested: $8,400 (down + closing). Projections, not guarantees.
Landlord ↔ Tenant lean methodology
- Overall (STATE)
- 43 Moderately Tenant-Leaning
- State Illinois
- 43 Moderately Tenant-Leaning · D+7
- County
- — inherits STATE
- City
- — inherits STATE
ZIP-level market 60426
- Home prices YoY
- 6.9%
- Active inventory
- 133
- Price-to-rent
- 1.6×
Monthly cashflow live
- Estimated rent
- $1,569 medium interval (Pro) →
- Mortgage (P&I)
- −$157
- Tax est. 1.5%
- −$38 /mo · $450/yr
- Insurance
- −$12
- Flood insurance flood zone
- −$192 /mo · $2,309/yr
- HOA
- −$0
- Vacancy / Maint / Mgmt
- −$330
- Net cashflow
- $840
Break-even live
Sensitivity live
| Price | -10% $861 | -5% $850 | +0% $840 | +5% $830 | +10% $819 |
|---|---|---|---|---|---|
| Rent | -10% $716 | -5% $778 | +0% $840 | +5% $902 | +10% $964 |
| Rate | -1.0pp $855 | -0.5pp $848 | base $840 | +0.5pp $832 | +1.0pp $824 |
UW: 25.0% down · 7.5% · 30yr · 1.5% tax · 5.0% vac · 8.0% maint · 8.0% mgmt
Financing live
Cash to close
- Down payment
- $7,500
- Closing costs
- $900
- Reserves months
- —
- Total cash needed
- —
Loan-product check · same deal, 3 products live
Conventional
25% down · 7.5% · 30yr
- Down + closing
- —
- Monthly P&I
- —
- Monthly cashflow
- —
- DSCR
- —
- Eligible?
- —
Personal DTI + credit; lowest rate.
DSCR
20% down · 8.5% · 30yr
- Down + closing
- —
- Monthly P&I
- —
- Monthly cashflow
- —
- DSCR
- —
- Eligible?
- —
No personal income docs; deal must DSCR.
Hard money
10% down · 12.0% · 12mo
- Down + closing
- —
- Monthly P&I
- —
- Monthly cashflow
- —
- DSCR
- —
- Eligible?
- —
Short-term bridge; refi at stabilization.
Rent comps 3 comps
| Address | Beds | Baths | Sqft | Rent | $/sqft | DOM | Units | Dist |
|---|---|---|---|---|---|---|---|---|
| 14629 Hoyne Ave Dixmoor, IL | 3.0 | 1.0 | 920 | $1,495 | $1.62 | 26d | 1 | 0.12mi |
| 14802 Cooper Ave Harvey, IL | 3.0 | 1.5 | 1200 | $1,700 | $1.42 | 26d | 1 | 0.16mi |
| 14521 Richmond Ave Unit 3 Posen, IL | 2.0 | 1.0 | 850 | $1,375 | $1.62 | 26d | 1 | 1.21mi |
Listing history 17 events
-
2026-06-22status $30,000 Pending 26 DOM
-
2026-06-21days on market $30,000 Active 26 DOM
-
2026-06-18days on market $30,000 Active 23 DOM
-
2026-06-17days on market $30,000 Active 22 DOM
-
2026-06-16days on market $30,000 Active 21 DOM
-
2026-06-15days on market $30,000 Active 20 DOM
-
2026-06-13days on market $30,000 Active 18 DOM
-
2026-06-13pricedays on market $30,000 Active 17 DOM
-
2026-06-09days on market $45,000 Active 14 DOM
-
2026-06-08days on market $45,000 Active 13 DOM
-
2026-06-07days on market $45,000 Active 12 DOM
-
2026-06-04days on market $45,000 Active 9 DOM
-
2026-06-03days on market $45,000 Active 8 DOM
-
2026-06-02days on market $45,000 Active 7 DOM
-
2026-06-01days on market $45,000 Active 6 DOM
-
2026-05-31days on market $45,000 Active 5 DOM
-
2026-05-26$45,000 Active
ⓘ Source: listings_history table (triggers on properties + properties_extension) + one-shot
backfill from property_details.listing_events for pre-trigger history.
Climate risk First Street
- Flood 4/10 Moderate FEMA zone AH · 22% chance over 30 yrs
- Wildfire 1/10 Low
- Heat 3/10 Moderate 7 d/yr ≥102°F today · 15 d/yr by 30 yrs out
- Wind 2/10 Low
- Air quality 3/10 Moderate 4 unhealthy d/yr today · 4 by 30 yrs out
Nearby sold comps map
Loading sold comps map…
Walkable amenities ~0.75 mi
Loading nearby amenities…
Taxation est. · year 1
- Rental income
- $18,831
- − Mortgage interest
- −$1,680
- − Property taxes
- −$450
- − Insurance
- −$2,459
- − Repairs & maintenance
- −$1,506
- − Management
- −$1,506
- − Depreciation
- −$873
- Taxable income
- $10,356
- Est. tax owed @ 24.0%
- −$2,485
- After-tax cash flow
- $7,594/yr
For passive investors: Depreciation is non-cash, so a rental often shows a tax loss while cash-flowing — sheltering income. Rental losses are passive: they offset passive income freely, and up to $25,000/yr can offset ordinary (W-2) income if you actively participate and your MAGI is under $100k (phasing out to $0 by $150k); unused losses carry forward. On sale, claimed depreciation is recaptured at up to 25%, and gains may owe capital-gains tax (a 1031 exchange can defer both). Figures are a year-1 estimate at your 24.0% rate — not tax advice; consult a CPA.
Schools (NCES district)
- District
- Thornton Twp Hsd 205
- NCES district ID
- 1738970
- Math proficiency
- 7% ▬ 0.00%
- Reading proficiency
- 8% ▼ -2.00%
- Median HH income
- $43,392
- Composite
- 6.92/100
- National rank
- #9976
- State rank
- #594 of 620 in IL
Livability — Dixmoor
- Score
- 76/100
- State rank
- #202
- US rank
- #3730
Category grades
Schools grade is shown separately in the Schools card above.
Census & demographics
- Census place
- Dixmoor, IL
- Population (ZIP)
- 23,066
Population outlook (Cook County) Hauer SSP2
- Today (2025)
- 5,347,519 people
- By 2030
- 5,357,703 · +0.2%
- By 2040
- 5,324,924 · -0.4%
- By 2050
- 5,230,762 · -2.2%
- By 2075
- 4,785,735 · -10.5%
- By 2100
- 4,188,836 · -21.7%
Race, ethnicity, and origin ACS 2023
- Neighborhood character
- Majority Black (59%)
- Race & ethnicity
- Black 59% Hispanic / Latino 33% Two or more races 12% White 3% Asian 2%
- Hispanic origin (detail)
- Mexican 31%
- Foreign-born
- 17% · Canada
- Languages at home
- 67% English-only · Spanish 30% Other Indo-European 2% French/Haitian/Cajun 1%
Political lean MEDSL · Cook
- 2024 margin
- Solid D (+42.0) · D 70.4% · R 28.4% · Other 1.2%
- 2008→2024 swing
- -11.4pp toward R · 2008: 53.4pp · 2024: 42.0pp
- All cycles
- 2024: D+42.0 2020: D+50.3 2016: D+53.0 2012: D+49.4 2008: D+53.4
Not yet ingested
- Civics
- —
Market trends
- HPI YoY
- ▲ 20.36%
- Current HPI
- 313.7895
- Rent YoY
- —
- Metro
- —
- State GDP YoY
- ▲ 1.59%
- F500 in state
- 60
Industry mix (Fortune 500 HQ in IL)
| Industry | F500 HQs | Revenue |
|---|---|---|
| Insurance | 4 | $201B |
|
||
| Consumer Goods | 4 | $87B |
|
||
| Industrial Machinery | 3 | $64B |
|
||
| Healthcare | 2 | $55B |
|
||
| Retail / Pharmacy | 1 | $148B |
|
||
| Agriculture / Food | 1 | $86B |
|
||
Price history
1 event — show timeline
- 2026-05-26 Listed $45,000 MRED as Distributed by MLS Grid
Property tax history
+1.6%/yrLatest (2023): $1,607 · +25.3% YoY. Source: county tax records.
Cash-flow waterfall
monthlySold comps — $/sqft
last 12 mo · ≤1 miLoading sold comps…