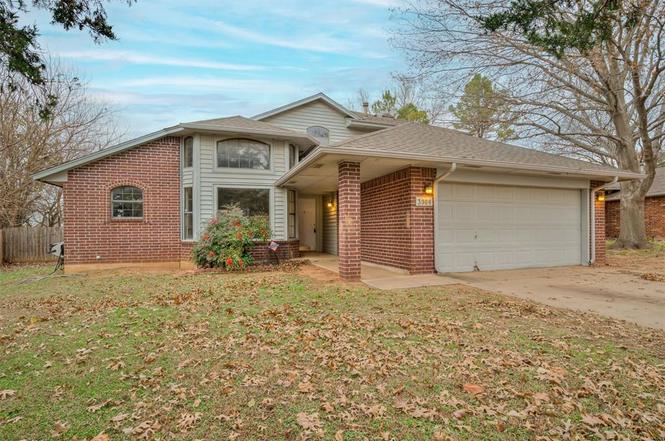
3908 Goshawk Cir · Norman, OK
Flood risk 1/10 · Minimal
- FEMA flood zone
- X (unshaded)
- Chance of flooding over 30 yrs
- 0.0%
- Est. flood insurance / yr
- $507 – $1,088
Fire risk 4/10 · Minor
- Est. fire insurance / yr
- $2,463 – $4,575
Heat risk 6/10 · Moderate
- Hot days now (above 108°F)
- 7 days/yr
- Hot days in 30 yrs
- 19 days/yr
Wind risk 3/10 · Minor
- Chance of severe wind over 30 yrs
- 5.0%
Air-quality risk 2/10 · Minimal
- Unhealthy air days now
- 1 days/yr
- Unhealthy air days in 30 yrs
- 1 days/yr
Risk factors via First Street. Map © Google.
Why this score? — see what drove the D+ grade
The composite is a weighted blend of 9 inputs, each scored 0–100. Each bar is that input's sub-score; the figure is the points it added to the 100-point composite (weight × sub-score).
- ARV discount +15.0/15.0
- Cash flow +13.7/30.0
- Livability +4.2/5.0
- DSCR +4.1/10.0
- Rent growth +3.7/5.0
- 1% rule +3.4/10.0
- Schools +2.6/10.0
- Condition / age +2.5/5.0
- Appreciation +0.0/10.0
$220,000
🖨 Deal sheet (PDF) 📄 Offer letter ✓ Due diligence
Listing remarks
WOW JUST REDUCED TO $220K - Tucked into a quiet pocket neighborhood on a dead-end street, just minutes from the University of Oklahoma, this hidden jewel offers space, privacy, and opportunity in a central Norman location with Eagle Cliff Park nearby. This 1.5-story home features an expansive backyard that offers space, privacy, and possibility. Upstairs, the home opens into a private retreat with a generous separate sitting area that could easily be used as an office or flex space, along with a primary bedroom featuring balcony access overlooking the backyard. The primary suite includes dual vanities, two separate closets, an oversized garden tub, and a separate shower, giving everyone the
Key facts
- Balcony access
- Dead-end street
- Expansive backyard
Tags
Property features AI
Finance
- Other: Lot approximately 0.3 acre; Located in the Eagle Cliff 6 addition; No storm shelter; Vacant and active listing
- Financial info: Listing sold as-is; Loan qualification allowed; Not assumable
- HOA & community: No mandatory association dues
Exterior
- Parking: Asphalt driveway; 2-car garage
- Utilities: Cable available; Electricity available; Natural gas available; High-speed internet available; Public utilities
- Home design: Single-family residence; One and one-half level; Residential property
- Construction: Brick and frame construction; Composition roof; Slab foundation
- Exterior features: Interior lot; No exterior special features listed
Interior
- Kitchen: Free-standing electric range/oven; Dishwasher; Disposal
- Bedrooms: 3 bedrooms
- Flooring: Carpet; Tile
- Bathrooms: 2 full bathrooms
- Interior features: In-law plan; Gas log fireplace; Dishwasher; Disposal; Water heater
- Laundry & utility: Water heater
Neighborhood map
What this means for you Summary
Snapshot
- This is a 3-bed/2.0-bath single-family listed at $220k.
Deal economics
- At list price, monthly cash flow is $15 ($179/yr) — positive.
- The deal already cash-flows at list — no discount required.
- To meet the 1% rule (rent ≥ 1% of price), the offer needs to be $186k (15.5% below list).
- Recommended offer: $186k (15.5% below list) — sets the bar for 1% rule.
- Cap rate 6.4% vs local median 3.6% in Norman — top-decile yield for the area; either an underpriced asset or a hidden risk that comps aren't pricing in. Stress-test before assuming the spread holds.
Location & tenants
- Location reads 85/100 on livability (#1 in OK, #557 nationally) — a professional / high-income tenant draw. Strengths: amenities A+, commute A+, cost of living A+.
- Norman (suburban): math 27% / reading 32% proficiency, ranked #61 of 270 in OK (top 23%) — low school quality limits family demand, transient renter base, plan for 1-2y turnover.
- Zoned schools: Madison Es (math 22% / reading 17%, grade F, #479 of 845 statewide, top 63%, 347 students, 0% FRL); Irving Ms (math 14% / reading 20%, grade F, #193 of 345 statewide, top 60%, 788 students, 0% FRL); Norman Hs (math 27% / reading 44%, grade F, #46 of 447 statewide, top 10%, 2,137 students, 0% FRL) — zoned schools average 0% FRL vs 39% district-wide (39 pts lower); this property's tenant base skews higher-income than the district average.
- Market conditions: Rents rising fast (+4.8%/yr); 383 active listings in the ZIP; 14 comparable units currently listed for rent nearby; rentals leasing fast (median 5d on market — plan ~1-2 weeks tenant-placement turnaround); solid renter incomes; 592 units permitted in Cleveland County in 2024 (12 in 5+ unit buildings).
Forward outlook
- Local home prices are declining (-3.0%/yr); year-one equity from $2k of loan paydown is wiped out by about $7k of value loss. Plan a longer hold.
- Cleveland County population projected at +40% by 2050 — long-run rental-demand tailwind backs the buy-and-hold thesis.
Negotiation context
- It's been on market 171 days — a 12% lower offer ($194k) is reasonable based on typical stale-listing flexibility.
- 2 sale attempts with the ask held roughly flat each time — persistent listings suggest the price (not the market) is what's stuck; bring a comps-based counter.
Risks & watch-outs
- Climate carrying-cost: extreme-heat days projected 7→19/yr by 2055 (HVAC capex compounding) — expect insurance premiums to compound above CPI over the hold.
Questions for the listing agent
- It's been on market 171 days. Have you received any prior offers? Is the seller open to a 16% concession, seller financing, or rate buy-down credit?
- Why hasn't it sold? Are there any deal-killer items the seller is aware of (foundation, flood, title, zoning, code violations)?
- Is there a deadline driving the sale (1031 exchange, divorce, estate, relocation)? That informs how much negotiation room exists.
- The area grade is low — what's the realistic commute time and amenity access for the typical tenant pool here? Any planned neighborhood developments (good or bad) we should know about?
- What's the average days-on-market for RENTAL listings here right now (not sales)? A rising rental-DOM trend means longer vacancies and softer asking-rent achievability than the comps imply.
- What's the recent tenant-quality profile in this submarket — average credit score on applications, eviction rate, late-payment / NSF rate, and stable-employment percentage? A property-management company in the area should have these aggregated.
- How much new for-sale + rental construction is in the pipeline within 1–3 miles? Heavy new supply typically softens prices + rents 12–24 months out; constrained supply supports both.
Investment metrics
- 1% rule
- 0.84% ✗
- Cap rate
- 6.37%
- Cash-on-cash
- 0.29%
- DSCR
- 1.01
- GRM
- 9.9
CMA / ARV
- ARV (on-the-fly)
- $283,294
- Comps found
- 12
Show comp detail 12 sales within ~0.75 mi
| Address | Dist | Beds/Ba | Sqft | Sold | Price | $/sf | Match |
|---|---|---|---|---|---|---|---|
| 721 Gyrfalcon Dr | 0.09mi | 3/2.0 | 1,765 (-2%) | 1mo | $260,000 | $147 | 92 |
| 4020 Bald Eagle Dr | 0.24mi | 3/2.0 | 1,826 (+2%) | 2mo | $255,000 | $140 | 84 |
| 605 Verreaux Dr | 0.19mi | 3/2.0 | 1,905 (+6%) | 3mo | $265,000 | $139 | 78 |
| 4204 Caracara Ct | 0.30mi | 3/2.0 | 1,722 (-4%) | 2mo | $285,000 | $166 | 78 |
| 705 Night Hawk Dr | 0.22mi | 3/2.0 | 1,647 (-8%) | 2mo | $260,000 | $158 | 74 |
| 713 Gyrfalcon Dr | 0.08mi | 4/2.0 (+1) | 1,984 (+11%) | 1mo | $284,000 | $143 | 72 |
| 4412 Spotted Owl Cir | 0.50mi | 3/2.0 | 1,821 (+2%) | 4mo | $274,500 | $151 | 71 |
| 4217 Caracara Ct | 0.35mi | 3/2.0 | 1,694 (-6%) | 4mo | $275,000 | $162 | 71 |
| 3916 Presidio Dr | 0.32mi | 3/2.0 | 1,948 (+9%) | 5mo | $315,000 | $162 | 66 |
| 516 Sperry Dr | 0.27mi | 3/2.0 | 1,541 (-14%) | 2mo | $260,000 | $169 | 62 |
| 4405 Spotted Owl Cir | 0.49mi | 3/2.0 | 1,539 (-14%) | 0mo | $241,000 | $157 | 53 |
| 3605 Addison Ave | 0.72mi | 4/2.0 (+1) | 1,890 (+5%) | 1mo | $345,000 | $183 | 51 |
Match score weights: distance 35% · size 25% · config 20% · recency 20%. Top-matched comps best support the ARV.
Projected returns pro-forma
-3.0% appreciation · 4.77% rent growth · sell at horizon
- IRR
- -14.0%
- Equity multiple
- 0.49×
- Total profit
- $-31,345
- Equity at exit
- $32,803
- IRR
- -2.6%
- Equity multiple
- 0.81×
- Total profit
- $-11,798
- Equity at exit
- $19,022
Cash invested: $61,600 (down + closing). Projections, not guarantees.
Landlord ↔ Tenant lean methodology
- Overall (STATE)
- 83 Strongly Landlord-Friendly
- State Oklahoma
- 83 Strongly Landlord-Friendly · R+20
- County
- — inherits STATE
- City
- — inherits STATE
ZIP-level market 73072
- Rents YoY
- 4.8%
- Active inventory
- 383
- Price-to-rent
- 9.9×
Monthly cashflow live
- Estimated rent
- $1,858 high interval (Pro) →
- Mortgage (P&I)
- −$1,154
- Tax from tax record
- −$208 /mo · $2,490/yr
- Insurance
- −$92
- HOA
- −$0
- Vacancy / Maint / Mgmt
- −$390
- Net cashflow
- $15
Break-even live
Sensitivity live
| Price | -10% $139 | -5% $77 | +0% $15 | +5% $-47 | +10% $-110 |
|---|---|---|---|---|---|
| Rent | -10% $-132 | -5% $-58 | +0% $15 | +5% $88 | +10% $162 |
| Rate | -1.0pp $126 | -0.5pp $71 | base $15 | +0.5pp $-42 | +1.0pp $-100 |
UW: 25.0% down · 7.5% · 30yr · 1.5% tax · 5.0% vac · 8.0% maint · 8.0% mgmt
Financing live
Cash to close
- Down payment
- $55,000
- Closing costs
- $6,600
- Reserves months
- —
- Total cash needed
- —
Loan-product check · same deal, 3 products live
Conventional
25% down · 7.5% · 30yr
- Down + closing
- —
- Monthly P&I
- —
- Monthly cashflow
- —
- DSCR
- —
- Eligible?
- —
Personal DTI + credit; lowest rate.
DSCR
20% down · 8.5% · 30yr
- Down + closing
- —
- Monthly P&I
- —
- Monthly cashflow
- —
- DSCR
- —
- Eligible?
- —
No personal income docs; deal must DSCR.
Hard money
10% down · 12.0% · 12mo
- Down + closing
- —
- Monthly P&I
- —
- Monthly cashflow
- —
- DSCR
- —
- Eligible?
- —
Short-term bridge; refi at stabilization.
Rent comps 14 comps
| Address | Beds | Baths | Sqft | Rent | $/sqft | DOM | Units | Dist |
|---|---|---|---|---|---|---|---|---|
| 3701 Truman Dr Norman, OK | 3.0 | 2.0 | 1534 | $1,800 | $1.17 | 25d | 1 | 0.24mi |
| 720 Night Hawk Dr Norman, OK | 3.0 | 2.0 | 1570 | $1,750 | $1.11 | 3d | 1 | 0.27mi |
| 427 Dalton Ln Norman, OK | 4.0 | 2.0 | 1666 | $1,775 | $1.07 | 25d | 1 | 0.34mi |
| 3810 Reid Pryor Rd Norman, OK | 3.0 | 2.0 | 2052 | $2,300 | $1.12 | 25d | 1 | 0.38mi |
| 4403 12th Ave SE Norman, OK | 1.0–2.0 | 1.0–2.0 | 950 | $2,581 | $2.72 | 3d | 23 | 0.51mi |
| 905 Accipiter St Norman, OK | 3.0 | 2.0 | 1654 | $1,695 | $1.02 | 3d | 1 | 0.53mi |
| 3816 Lleyton Dr Norman, OK | 4.0 | 2.0 | 1565 | $2,095 | $1.34 | 6d | 1 | 0.85mi |
| 3816 Lleyton Dr Norman, OK | 4.0 | 2.0 | 1565 | $2,095 | $1.34 | 3d | 1 | 0.85mi |
| 3903 Lleyton Dr Norman, OK | 3.0 | 2.0 | 1300 | $1,750 | $1.35 | 19d | 1 | 0.90mi |
| 3903 Lleyton Dr Norman, OK | 3.0 | 2.0 | 1300 | $1,750 | $1.35 | 25d | 1 | 0.90mi |
| 3417 Shadow St Norman, OK | 3.0 | 2.0 | 1378 | $1,500 | $1.09 | 5d | 1 | 0.97mi |
| 1600 Ann Branden Blvd Norman, OK | 1.0–3.0 | 1.0–2.0 | 1052 | $1,829 | $1.74 | 3d | 14 | 1.06mi |
| 3400 Lyric St Norman, OK | 3.0 | 2.0 | 1387 | $1,850 | $1.33 | 3d | 1 | 1.17mi |
| 2301 Bretford Way Norman, OK | 4.0 | 2.0 | 2084 | $2,495 | $1.20 | 5d | 1 | 1.43mi |
Listing history 19 events
-
2026-06-21days on market $220,000 Active 171 DOM
-
2026-06-18days on market $220,000 Active 168 DOM
-
2026-06-17days on market $220,000 Active 167 DOM
-
2026-06-16days on market $220,000 Active 166 DOM
-
2026-06-15days on market $220,000 Active 165 DOM
-
2026-06-13days on market $220,000 Active 163 DOM
-
2026-06-09days on market $220,000 Active 159 DOM
-
2026-06-08days on market $220,000 Active 158 DOM
-
2026-06-07days on market $220,000 Active 157 DOM
-
2026-06-05days on market $220,000 Active 154 DOM
-
2026-06-03days on market $220,000 Active 153 DOM
-
2026-06-02days on market $220,000 Active 152 DOM
-
2026-06-01days on market $220,000 Active 151 DOM
-
2026-05-31days on market $220,000 Active 150 DOM
-
2026-05-16status Active
-
2026-05-01status Pending
-
2026-04-13price $220,000
-
2026-02-27price $225,000
-
2025-12-17$230,000 Active
ⓘ Source: listings_history table (triggers on properties + properties_extension) + one-shot
backfill from property_details.listing_events for pre-trigger history.
Tax reassessment forecast OK · Resets to sale price
- Current annual tax
- $2,490 · $208/mo
- Projected year-2 tax
- $2,490 · $208/mo
- Expected delta
- $0/yr ($0/mo · 0.0%)
ⓘ Screening estimate from a state-policy table — verify with the county assessor before closing.
Climate risk First Street
- Flood 1/10 Low FEMA zone X (unshaded) · 0% chance over 30 yrs
- Wildfire 4/10 Moderate
- Heat 6/10 Major 7 d/yr ≥108°F today · 19 d/yr by 30 yrs out
- Wind 3/10 Moderate 5% chance of damaging wind over 30 yrs
- Air quality 2/10 Low 1 unhealthy d/yr today · 1 by 30 yrs out
Nearby sold comps map
Loading sold comps map…
Walkable amenities ~0.75 mi
Loading nearby amenities…
Taxation est. · year 1
- Rental income
- $22,296
- − Mortgage interest
- −$12,323
- − Property taxes
- −$2,490
- − Insurance
- −$1,100
- − Repairs & maintenance
- −$1,784
- − Management
- −$1,784
- − Depreciation
- −$6,400
- Taxable loss
- −$3,585
- Est. tax savings @ 24.0%
- +$860
- After-tax cash flow
- $1,040/yr
For passive investors: Depreciation is non-cash, so a rental often shows a tax loss while cash-flowing — sheltering income. Rental losses are passive: they offset passive income freely, and up to $25,000/yr can offset ordinary (W-2) income if you actively participate and your MAGI is under $100k (phasing out to $0 by $150k); unused losses carry forward. On sale, claimed depreciation is recaptured at up to 25%, and gains may owe capital-gains tax (a 1031 exchange can defer both). Figures are a year-1 estimate at your 24.0% rate — not tax advice; consult a CPA.
Schools (NCES district)
- District
- Norman
- NCES district ID
- 4021720
- Math proficiency
- 27% ▼ -9.00%
- Reading proficiency
- 32% ▼ -8.00%
- Median HH income
- $48,940
- Composite
- 25.67/100
- National rank
- #7395
- State rank
- #61 of 270 in OK
Livability — Norman
- Score
- 85/100
- State rank
- #1
- US rank
- #557
Category grades
Schools grade is shown separately in the Schools card above.
Census & demographics
- Census place
- Norman, OK
- County
- Cleveland County · 239,547 people
- City population
- 123,141
- Metro
- Oklahoma City, OK
- Population (ZIP)
- 50,881
- Household income
- $78,546
- Rent vs Own
- Severe rent burden
- 2491.0
Population outlook (Cleveland County) Hauer SSP2
- Today (2025)
- 323,621 people
- By 2030
- 349,070 · +7.9%
- By 2040
- 400,168 · +23.7%
- By 2050
- 454,101 · +40.3%
- By 2075
- 602,926 · +86.3%
- By 2100
- 734,485 · +127.0%
Race, ethnicity, and origin ACS 2023
- Neighborhood character
- Predominantly White (72%)
- Race & ethnicity
- White 72% Two or more races 10% Hispanic / Latino 8% Asian 6% Native American 4% Black 3%
- Hispanic origin (detail)
- Mexican 5%
- Common ancestry
- Slovak 2% Italian 2% Lithuanian 2%
- Foreign-born
- 7% · China, Canada, Dominican Republic
- Languages at home
- 89% English-only · Spanish 4% Chinese 3% Other Indo-European 1%
Political lean MEDSL · Cleveland
- 2024 margin
- R (+14.9) · D 41.4% · R 56.4% · Other 2.2%
- 2008→2024 swing
- +9.1pp toward D · 2008: -24.0pp · 2024: -14.9pp
- All cycles
- 2024: R+14.9 2020: R+14.1 2016: R+21.7 2012: R+25.9 2008: R+24.0
Not yet ingested
- Civics
- —
Market trends
- HPI YoY
- ▼ -190.27%
- Current HPI
- 221.8007
- Rent YoY
- ▲ 4.77%
- Metro
- Oklahoma City, OK
- State GDP YoY
- ▲ 1.55%
- F500 in state
- 6
Industry mix (Fortune 500 HQ in OK)
| Industry | F500 HQs | Revenue |
|---|---|---|
| Energy | 3 | $48B |
|
||
Price history
-4.3% since first listed5 events — show timeline
- 2026-05-16 Relisted — MLSOK
- 2026-05-01 Pending — MLSOK
- 2026-04-13 Price Changed $220,000 MLSOK
- 2026-02-27 Price Changed $225,000 MLSOK
- 2025-12-17 Listed $230,000 MLSOK
Property tax history
+2.0%/yrLatest (2024): $2,490 · +4.8% YoY. Source: county tax records.
Cash-flow waterfall
monthlySold comps — $/sqft
last 12 mo · ≤1 miLoading sold comps…