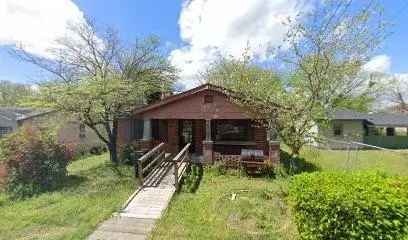
2361 Adams Ave · Macon-Bibb County, GA
Flood risk 1/10 · Minimal
- FEMA flood zone
- X (unshaded)
- Chance of flooding over 30 yrs
- 0.0%
- Est. flood insurance / yr
- $507 – $1,088
Fire risk 1/10 · Minimal
- Est. fire insurance / yr
- $963 – $1,789
Heat risk 7/10 · Major
- Hot days now (above 108°F)
- 7 days/yr
- Hot days in 30 yrs
- 17 days/yr
Wind risk 6/10 · Moderate
- Chance of severe wind over 30 yrs
- 66.0%
Air-quality risk 3/10 · Minor
- Unhealthy air days now
- 3 days/yr
- Unhealthy air days in 30 yrs
- 4 days/yr
Risk factors via First Street. Map © Google.
Why this score? — see what drove the B- grade
The composite is a weighted blend of 9 inputs, each scored 0–100. Each bar is that input's sub-score; the figure is the points it added to the 100-point composite (weight × sub-score).
- Cash flow +30.0/30.0
- DSCR +10.0/10.0
- 1% rule +9.3/10.0
- ARV discount +7.5/15.0
- Rent growth +3.8/5.0
- Livability +2.5/5.0
- Condition / age +2.5/5.0
- Schools +1.2/10.0
- Appreciation +0.0/10.0
$75,000
🖨 Deal sheet 📄 Offer letter ✓ Due diligence
Listing remarks
2 bedroom, 1 bathroom fixer upper. Great for investors or those looking for sweat equity. Bring your imagination and bring this home back to life. NO SELLER DISCLOSURES. Sold as is.
Key facts
- 5,662 sq ft lot
- Built 1950
- Listed 25 days
Property features AI
Exterior
- Parking: Driveway parking; Open parking available
- Security: No security features listed
- Utilities: Public water; Public sewer; 110-volt electric service; Cable available; Electricity available; Natural gas available; Phone available; Sewer available; Water available
- Home design: One-level property
- Construction: Brick construction; Shingle roof; Slab foundation; Property listed as fixer
- Exterior features: City street frontage; Asphalt road access; GPS-friendly directions
Interior
- Kitchen: No kitchen features listed; No appliances specifically listed
- Bedrooms: One main-level bedroom; No special bedroom features listed
- Flooring: Other flooring
- Bathrooms: One full bathroom on the main level; No master bathroom features listed
- Heating & cooling: No heating or cooling details listed
- Interior features: Other interior features; Wood window frames; No shared/common walls; Crawl space
- Laundry & utility: No laundry or utility appliances listed
Neighborhood map
What this means for you Summary
Snapshot
- This is a 2-bed/1.0-bath single-family listed at $75k.
Deal economics
- At list price, monthly cash flow is $374 ($4k/yr) — positive.
- The deal already cash-flows at list — no discount required.
- Meets the 1% rule at list price ($1k rent vs $75k).
- Recommended offer: $74k (1.5% below list) — sets the bar for market timing.
- Cap rate 12.3% vs local median 5.4% in Macon-Bibb County — top-decile yield for the area; either an underpriced asset or a hidden risk that comps aren't pricing in. Stress-test before assuming the spread holds.
Location & tenants
- Location reads: area grade B — affects rentability + tenant quality, not the cash-flow math above.
- Bibb County (urban): math 11% / reading 18% proficiency, ranked #161 of 174 in GA (top 92%) — low school quality limits family demand, transient renter base, plan for 1-2y turnover; 75% free/reduced lunch — lower-income household profile, screen leases tightly.
- Zoned schools: Hartley Elementary School (math 2% / reading 2%, grade F, #1,204 of 1,228 statewide, top 100%, 438 students, 100% FRL); Ballard Hudson Middle School (math 4% / reading 9%, grade F, #457 of 470 statewide, top 98%, 744 students, 100% FRL); Southwest High School (math 2% / reading 17%, grade F, #365 of 424 statewide, top 88%, 800 students, 100% FRL) — zoned schools average 100% FRL vs 75% district-wide (25 pts higher); higher-poverty schools than district average — tighter screening recommended.
- Market conditions: Rents rising fast (+5.0%/yr); 207 active listings in the ZIP; 40 comparable units currently listed for rent nearby; rentals lingering (median 44d on market — plan ~5-8 weeks vacancy on turnover, expect pricing pressure); 60% of comp listings sitting > 30 days — soft ceiling on asking rent; lower-income renter base — watch delinquency; 154 units permitted in Bibb County in 2024 (0 in 5+ unit buildings).
- This rent runs 43% of the median local income ($30k/yr) — at the standard rent-burdened threshold; future hikes will face affordability resistance.
Forward outlook
- Local home prices are declining (-3.0%/yr); year-one equity from $519 of loan paydown is wiped out by about $2k of value loss. Plan a longer hold.
- Bibb County population projected at -12% by 2050 — secular population decline; favor cash flow + early exit over multi-decade hold.
- At projected returns (-3.0% appreciation + 5.0% rent growth), your $21k cash investment doubles in ~6 years — after that, you're playing with house money.
Negotiation context
- It's been on market 26 days — a 2% lower offer ($74k) is reasonable based on typical stale-listing flexibility.
Risks & watch-outs
- Watch-outs: built in 1950 — expect roof / HVAC / electrical / plumbing capex.
- Climate carrying-cost: major wind risk, 66% chance of damaging wind over 30y; extreme-heat days projected 7→17/yr by 2055 (HVAC capex compounding) — expect insurance premiums to compound above CPI over the hold.
Questions for the listing agent
- Built in 1950 — when were the roof, HVAC, electrical panel, plumbing, and water heater last replaced?
- Is there a deadline driving the sale (1031 exchange, divorce, estate, relocation)? That informs how much negotiation room exists.
- What's the average days-on-market for RENTAL listings here right now (not sales)? A rising rental-DOM trend means longer vacancies and softer asking-rent achievability than the comps imply.
- What's the recent tenant-quality profile in this submarket — average credit score on applications, eviction rate, late-payment / NSF rate, and stable-employment percentage? A property-management company in the area should have these aggregated.
- How much new for-sale + rental construction is in the pipeline within 1–3 miles? Heavy new supply typically softens prices + rents 12–24 months out; constrained supply supports both.
Investment metrics
- 1% rule
- 1.43% ✓
- Cap rate
- 12.27%
- Cash-on-cash
- 21.34%
- DSCR
- 1.95
- GRM
- 5.8
CMA / ARV
- ARV (on-the-fly)
- $39,780
- Comps found
- 12
Show comp detail 12 sales within ~0.75 mi
| Address | Dist | Beds/Ba | Sqft | Sold | Price | $/sf | Match |
|---|---|---|---|---|---|---|---|
| 1191 Carroll St | 0.12mi | 3/1.0 (+1) | 1,131 (+11%) | 6mo | $70,000 | $62 | 66 |
| 1355 Harris St | 0.23mi | 3/1.0 (+1) | 1,102 (+8%) | 9mo | $102,000 | $93 | 64 |
| 2017 Lowe St | 0.48mi | 3/1.0 (+1) | 1,025 (+0%) | 10mo | $47,000 | $46 | 63 |
| 670 Poppy Ave | 0.52mi | 3/2.0 (+1) | 1,056 (+4%) | 1mo | $30,000 | $28 | 60 |
| 1162 Ruben Drive Dr Unit m | 0.54mi | 2/1.0 | 960 (-6%) | 8mo | $19,500 | $20 | 58 |
| 1162 Ruben Dr | 0.54mi | 2/1.0 | 960 (-6%) | 8mo | $19,500 | $20 | 58 |
| 853 Grayson Ave | 0.65mi | 3/1.0 (+1) | 984 (-4%) | 4mo | $38,000 | $39 | 56 |
| 2008 Cedar Ave | 0.41mi | 3/2.0 (+1) | 1,008 (-1%) | 18mo | $73,000 | $72 | 54 |
| 2332 Ballard Pl | 0.43mi | 2/1.0 | 868 (-15%) | 14mo | $25,000 | $29 | 44 |
| 2278 Ballard Pl | 0.42mi | 3/1.0 (+1) | 868 (-15%) | 14mo | $25,000 | $29 | 39 |
| 703 Edwards Ave | 0.75mi | 3/1.0 (+1) | 932 (-9%) | 9mo | $105,000 | $113 | 38 |
| 2288 Ballard Pl | 0.42mi | 3/1.0 (+1) | 868 (-15%) | 17mo | $30,000 | $35 | 36 |
Match score weights: distance 35% · size 25% · config 20% · recency 20%. Top-matched comps best support the ARV.
Projected returns pro-forma
-3.0% appreciation · 5.03% rent growth · sell at horizon
- IRR
- 16.0%
- Equity multiple
- 1.66×
- Total profit
- $13,854
- Equity at exit
- $11,183
- IRR
- 26.0%
- Equity multiple
- 3.49×
- Total profit
- $52,186
- Equity at exit
- $6,485
Cash invested: $21,000 (down + closing). Projections, not guarantees.
Landlord ↔ Tenant lean methodology
- Overall (STATE)
- 90 Strongly Landlord-Friendly
- State Georgia
- 90 Strongly Landlord-Friendly · R+3
- County
- — inherits STATE
- City
- — inherits STATE
ZIP-level market 31206
- Rents YoY
- 5.0%
- Active inventory
- 207
- Price-to-rent
- 5.8×
Monthly cashflow live
- Estimated rent
- $1,070 high interval (Pro) →
- Mortgage (P&I)
- −$393
- Tax from tax record
- −$48 /mo · $570/yr
- Insurance
- −$31
- HOA
- −$0
- Vacancy / Maint / Mgmt
- −$225
- Net cashflow
- $374
Break-even live
UW: 25.0% down · 7.5% · 30yr · 1.5% tax · 5.0% vac · 8.0% maint · 8.0% mgmt
Financing live
Cash to close
- Down payment
- $18,750
- Closing costs
- $2,250
- Reserves months
- —
- Total cash needed
- —
Loan-product check · same deal, 3 products live
Conventional
25% down · 7.5% · 30yr
- Down + closing
- —
- Monthly P&I
- —
- Monthly cashflow
- —
- DSCR
- —
- Eligible?
- —
Personal DTI + credit; lowest rate.
DSCR
20% down · 8.5% · 30yr
- Down + closing
- —
- Monthly P&I
- —
- Monthly cashflow
- —
- DSCR
- —
- Eligible?
- —
No personal income docs; deal must DSCR.
Hard money
10% down · 12.0% · 12mo
- Down + closing
- —
- Monthly P&I
- —
- Monthly cashflow
- —
- DSCR
- —
- Eligible?
- —
Short-term bridge; refi at stabilization.
Rent comps 40 comps
| Address | Beds | Baths | Sqft | Rent | $/sqft | DOM | Units | Dist |
|---|---|---|---|---|---|---|---|---|
| 2445 Lowe St Macon, GA | 2.0 | 1.0 | 940 | $890 | $0.95 | 43d | 1 | 0.36mi |
| 1575 Winston Dr Macon, GA | 3.0 | 2.0 | 1215 | $1,350 | $1.11 | 20d | 1 | 0.51mi |
| 1089 Brisbane St Macon, GA | 3.0 | 1.0 | 816 | $1,075 | $1.32 | 13d | 1 | 0.58mi |
| 806 Armory Dr Unit B Macon, GA | 3.0 | 1.0 | 1100 | $975 | $0.89 | 43d | 1 | 0.66mi |
| 3080 Rice Mill Rd Unit C-1 Macon, GA | 3.0 | 1.5 | 1100 | $925 | $0.84 | 20d | 1 | 0.69mi |
| 3080 Rice Mill Rd Macon, GA | 3.0 | 1.0 | 1100 | $950 | $0.86 | 43d | 1 | 0.69mi |
| 3080 Rice Mill Rd Unit M-5 Macon, GA | 1.0 | 1.0 | 875 | $750 | $0.86 | 43d | 1 | 0.69mi |
| 3149 Somerset Dr Macon, GA | 2.0 | 1.0 | 897 | $745 | $0.83 | 43d | 1 | 0.77mi |
| 424 Pansy Ave Macon, GA | 2.0 | 1.0 | 810 | $850 | $1.05 | 43d | 1 | 0.80mi |
| 672 Bowden St Macon, GA | 2.0 | 1.0 | 1076 | $900 | $0.84 | 20d | 1 | 0.81mi |
| 771 Harold St Macon, GA | 2.0 | 1.0 | 950 | $1,250 | $1.32 | 13d | 1 | 0.89mi |
| 3238 Somerset Dr Macon, GA | 3.0 | 1.0 | 1100 | $975 | $0.89 | 13d | 1 | 0.90mi |
| 1164 Newberg Ave Macon, GA | 3.0 | 1.0 | 1100 | $1,195 | $1.09 | 43d | 1 | 0.98mi |
| 569 Colquitt St Macon, GA | 1.0 | 1.0 | 1330 | $650 | $0.49 | 43d | 1 | 1.02mi |
| 663 Williams St Macon, GA | 3.0 | 1.0 | 911 | $980 | $1.08 | 43d | 1 | 1.02mi |
| 837 Newberg Ave Macon, GA | 3.0 | 1.0 | 966 | $750 | $0.78 | 43d | 1 | 1.03mi |
| 1868 Sussex Dr Macon, GA | 3.0 | 2.0 | 1450 | $1,500 | $1.03 | 43d | 1 | 1.08mi |
| 1460 Brentwood Ave Macon, GA | 3.0 | 2.0 | 1148 | $1,250 | $1.09 | 20d | 1 | 1.08mi |
| 520 Nelson St Macon, GA | 3.0 | 1.0 | 1208 | $1,225 | $1.01 | 13d | 1 | 1.11mi |
| 558 Cleveland St Macon, GA | 2.0 | 1.0 | 924 | $925 | $1.00 | 43d | 1 | 1.11mi |
| 495 Pittman St Macon, GA | 3.0 | 2.0 | 1324 | $995 | $0.75 | 43d | 1 | 1.12mi |
| 1463 Bankston Ave Macon, GA | 2.0 | 1.0 | 960 | $950 | $0.99 | 43d | 1 | 1.13mi |
| 738 Liberty St Unit 738 Macon, GA | 2.0 | 1.0 | 1378 | $989 | $0.72 | 20d | 1 | 1.20mi |
| 738 Liberty St Unit 730 Macon, GA | 2.0 | 1.0 | 1376 | $680 | $0.49 | 20d | 1 | 1.20mi |
| 1635 2nd St Macon, GA | 3.0 | 2.0 | 1159 | $1,500 | $1.29 | 43d | 1 | 1.23mi |
| 1782 Eveline Ave Macon, GA | 3.0 | 1.0 | 900 | $1,050 | $1.17 | 43d | 1 | 1.24mi |
| 3685 Rice Mill Rd Macon, GA | 3.0 | 1.0 | 1152 | $1,450 | $1.26 | 43d | 1 | 1.25mi |
| 832 Elm St Macon, GA | 3.0 | 2.0 | 1121 | $1,175 | $1.05 | 43d | 1 | 1.29mi |
| 3034 Churchill St Macon, GA | 2.0 | 1.0 | 872 | $900 | $1.03 | 20d | 1 | 1.31mi |
| 1528 Wellworth Ave Macon, GA | 3.0 | 1.0 | 1126 | $1,000 | $0.89 | 20d | 1 | 1.31mi |
| 1347 Jackson St Macon, GA | 3.0 | 2.0 | 1435 | $1,300 | $0.91 | 43d | 1 | 1.32mi |
| 2154 Napier Ave Macon, GA | 3.0 | 1.0 | 1344 | $1,400 | $1.04 | 20d | 1 | 1.33mi |
| 3778 Spencer Cir Macon, GA | 3.0 | 1.0 | 864 | $1,300 | $1.50 | 20d | 1 | 1.33mi |
| 1268 College St Unit 1 Macon, GA | 2.0 | 2.0 | 1500 | $1,730 | $1.15 | 43d | 1 | 1.33mi |
| 3423 Flamingo Dr Macon, GA | 3.0 | 1.0 | 1048 | $895 | $0.85 | 43d | 1 | 1.34mi |
| 3837 Spencer Cir Macon, GA | 3.0 | 1.0 | 1080 | $1,300 | $1.20 | 43d | 1 | 1.35mi |
| 1596 Burton Ave Macon, GA | 3.0 | 1.0 | 1117 | $895 | $0.80 | 13d | 1 | 1.35mi |
| 1249 Duncan Ave Unit B Macon, GA | 2.0 | 2.0 | 700 | $1,095 | $1.56 | 43d | 1 | 1.37mi |
| 1249 Duncan Ave Unit C Macon, GA | 2.0 | 2.0 | 900 | $795 | $0.88 | 43d | 1 | 1.37mi |
| 1232 Shamrock St Macon, GA | 3.0 | 2.0 | 1282 | $1,700 | $1.33 | 13d | 1 | 1.38mi |
Listing history 17 events
-
2026-06-19days on market $75,000 Active 26 DOM
-
2026-06-18days on market $75,000 Active 25 DOM
-
2026-06-17days on market $75,000 Active 24 DOM
-
2026-06-16days on market $75,000 Active 23 DOM
-
2026-06-15days on market $75,000 Active 22 DOM
-
2026-06-14days on market $75,000 Active 20 DOM
-
2026-06-13days on market $75,000 Active 19 DOM
-
2026-06-10days on market $75,000 Active 17 DOM
-
2026-06-09days on market $75,000 Active 16 DOM
-
2026-06-08days on market $75,000 Active 15 DOM
-
2026-06-07days on market $75,000 Active 14 DOM
-
2026-06-03days on market $75,000 Active 10 DOM
-
2026-06-02days on market $75,000 Active 9 DOM
-
2026-06-01days on market $75,000 Active 8 DOM
-
2026-05-31days on market $75,000 Active 7 DOM
-
2026-05-30days on market $75,000 Active 6 DOM
-
2026-05-24$75,000 Active
ⓘ Source: listings_history table (triggers on properties + properties_extension) + one-shot
backfill from property_details.listing_events for pre-trigger history.
Tax reassessment forecast GA · Resets to sale price
- Current annual tax
- $570 · $48/mo
- Projected year-2 tax
- $690 · $58/mo
- Expected delta
- +$120/yr (+$10/mo · 21.0%)
ⓘ Screening estimate from a state-policy table — verify with the county assessor before closing.
Climate risk First Street
- Flood 1/10 Low FEMA zone X (unshaded) · 0% chance over 30 yrs
- Wildfire 1/10 Low
- Heat 7/10 Severe 7 d/yr ≥108°F today · 17 d/yr by 30 yrs out
- Wind 6/10 Major 66% chance of damaging wind over 30 yrs
- Air quality 3/10 Moderate 3 unhealthy d/yr today · 4 by 30 yrs out
Nearby sold comps map
Loading sold comps map…
Walkable amenities ~0.75 mi
Loading nearby amenities…
Taxation est. · year 1
- Rental income
- $12,844
- − Mortgage interest
- −$4,201
- − Property taxes
- −$570
- − Insurance
- −$375
- − Repairs & maintenance
- −$1,028
- − Management
- −$1,028
- − Depreciation
- −$2,182
- Taxable income
- $3,461
- Est. tax owed @ 24.0%
- −$831
- After-tax cash flow
- $3,651/yr
For passive investors: Depreciation is non-cash, so a rental often shows a tax loss while cash-flowing — sheltering income. Rental losses are passive: they offset passive income freely, and up to $25,000/yr can offset ordinary (W-2) income if you actively participate and your MAGI is under $100k (phasing out to $0 by $150k); unused losses carry forward. On sale, claimed depreciation is recaptured at up to 25%, and gains may owe capital-gains tax (a 1031 exchange can defer both). Figures are a year-1 estimate at your 24.0% rate — not tax advice; consult a CPA.
Schools (NCES district)
- District
- Bibb County
- NCES district ID
- 1300420
- Math proficiency
- 11% ▼ -14.00%
- Reading proficiency
- 18% ▼ -11.00%
- Median HH income
- $37,426
- Composite
- 12.13/100
- National rank
- #9654
- State rank
- #161 of 174 in GA
Livability — Macon-Bibb County
No livability data for this city. (Only ~50 U.S. cities are tracked.)
Census & demographics
- Census place
- Macon-Bibb County, GA
- County
- Bibb County · 164,332 people
- City population
- 143,186
- Metro
- Macon-Bibb County, GA
- Population (ZIP)
- 24,310
- Household income
- $30,042
- Rent vs Own
- Severe rent burden
- 1335.0
Population outlook (Bibb County) Hauer SSP2
- Today (2025)
- 148,772 people
- By 2030
- 145,904 · -1.9%
- By 2040
- 139,404 · -6.3%
- By 2050
- 131,603 · -11.5%
- By 2075
- 111,050 · -25.4%
- By 2100
- 83,346 · -44.0%
Race, ethnicity, and origin ACS 2023
- Neighborhood character
- Predominantly Black (76%)
- Race & ethnicity
- Black 76% White 12% Hispanic / Latino 8% Two or more races 4%
- Hispanic origin (detail)
- Mexican 5% Puerto Rican 1%
- Common ancestry
- Lithuanian 1% Italian 1%
- Foreign-born
- 4% · Canada
- Languages at home
- 91% English-only · Spanish 8%
Political lean MEDSL · Bibb
- 2024 margin
- Strong D (+22.4) · D 61.0% · R 38.5%
- 2008→2024 swing
- +4.4pp toward D · 2008: 18.0pp · 2024: 22.4pp
- All cycles
- 2024: D+22.4 2020: D+23.8 2016: D+20.2 2012: D+20.0 2008: D+18.0
Not yet ingested
- Civics
- —
Market trends
- HPI YoY
- ▼ -80.17%
- Current HPI
- 148.6765
- Rent YoY
- ▲ 5.03%
- Metro
- Macon-Bibb County, GA
- State GDP YoY
- ▲ 2.66%
- F500 in state
- 28
Industry mix (Fortune 500 HQ in GA)
| Industry | F500 HQs | Revenue |
|---|---|---|
| Paper / Packaging | 2 | $29B |
|
||
| Retail | 1 | $160B |
|
||
| Transportation / Logistics | 1 | $91B |
|
||
| Airlines | 1 | $62B |
|
||
| Consumer Goods | 1 | $47B |
|
||
| Utilities | 1 | $25B |
|
||
Price history
1 event — show timeline
- 2026-05-24 Listed $75,000 FMLS
Property tax history
+12.2%/yrLatest (2025): $570 · +45.4% YoY. Source: county tax records.
Cash-flow waterfall
monthlySold comps — $/sqft
last 12 mo · ≤1 miLoading sold comps…