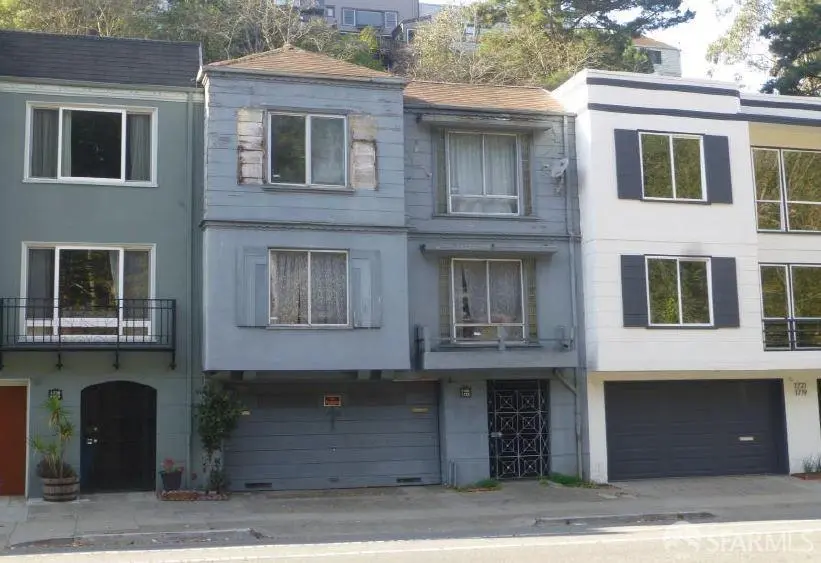
 Duplex
1723-1725 7th Ave · San Francisco, CA
Flood risk 9/10 · Severe
- FEMA flood zone
- X (unshaded)
- Chance of flooding over 30 yrs
- 0.79%
- Est. flood insurance / yr
- $507 – $1,088
Fire risk 2/10 · Minimal
- Est. fire insurance / yr
- $659 – $1,223
Heat risk 1/10 · Minimal
- Hot days now (above 76°F)
- 7 days/yr
- Hot days in 30 yrs
- 15 days/yr
Wind risk 1/10 · Minimal
- Chance of severe wind over 30 yrs
- —
Air-quality risk 7/10 · Major
- Unhealthy air days now
- 13 days/yr
- Unhealthy air days in 30 yrs
- 13 days/yr
Risk factors via First Street. Map © Google.
Why this score? — see what drove the D grade
The composite is a weighted blend of 9 inputs, each scored 0–100. Each bar is that input's sub-score; the figure is the points it added to the 100-point composite (weight × sub-score).
- ARV discount +15.0/15.0
- Cash flow +7.3/30.0
- Schools +5.0/10.0
- Rent growth +4.9/5.0
- Livability +3.8/5.0
- 1% rule +2.5/10.0
- Condition / age +2.5/5.0
- DSCR +1.4/10.0
- Appreciation +0.0/10.0
$1,200,000
🖨 Deal sheet (PDF) 📄 Offer letter ✓ Due diligence
Multi-family units
County records classify this as Multi-Family (2-4 Unit). Listing-text estimate: 2 units. confirmed
Listing remarks MLS
Don't blink and miss this spectacular investment opportunity at an affordable price. This classic duplex in the heart of San Francisco. This convenient Inner location is near University of California San Francisco, California Academy of Sciences, Botanical Garden, Golden Gate Park, public transportation, coffee shops, shopping, outdoor recreational activities, a variety of cuisine, museums, entertainment, and everything else that the City offers. This four-bedroom, two-bathroom duplex boasts a two-car garage plus driveway All potential buyers are asked to check with City, County, Zoning, Tax, and other records to determine all details on this property listed above to their satisfaction. This is an AS-IS SALE property. Buyers are responsible to perform their due diligence prior to bidding. Buyers' premium paid at closing by buyer.
Key facts
- Near shopping
- Near coffee shops
- Classic duplex
Tags
Neighborhood map
What this means for you Summary
Snapshot
- This is a 2 × 2-bed/?-bath units multifamily listed at $1.20M.
Deal economics
- At list price, monthly cash flow is $-2k ($-20k/yr) — negative. Per door: $-843/mo.
- To cash-flow at today's rent, offer at most $902k (24.8% below list).
- To meet the 1% rule (rent ≥ 1% of price), the offer needs to be $896k (25.3% below list).
- Recommended offer: $896k (25.3% below list) — sets the bar for 1% rule.
- Cap rate 4.7% vs local median 2.1% in San Francisco — top-decile yield for the area; either an underpriced asset or a hidden risk that comps aren't pricing in. Stress-test before assuming the spread holds.
Location & tenants
- Location reads 76/100 on livability (#90 in CA, #3,143 nationally) — a middle-class / working-renter tenant base. Strengths: amenities A+, commute A+, employment A+; Watch: crime F, cost of living F.
- San Francisco Unified (urban): math 50% / reading 56% proficiency, ranked #322 of 1,400 in CA (top 23%) — acceptable for families but not a draw, mixed tenant base, ~2y average lease.
- Zoned schools: Lilienthal (Claire) Elementary (669 students, 19% FRL); Giannini (A.P.) Middle (1,192 students, 34% FRL); Lowell High (2,632 students, 37% FRL) — zoned schools average 30% FRL vs 49% district-wide (19 pts lower); this property's tenant base skews higher-income than the district average.
- Market conditions: Rents rising fast (+9.7%/yr); 65 active listings in the ZIP; 18 comparable units currently listed for rent nearby; rentals at typical pace (median 26d on market — plan ~3-4 weeks tenant-placement turnaround); 44% of comp listings sitting > 30 days — soft ceiling on asking rent; high-income renter base; 750 units permitted in San Francisco County in 2024 (688 in 5+ unit buildings).
- At $8,964/mo this rent would consume 74% of the median local household income ($146k/yr) (locally 2227% of renters already pay >50% of income on rent) — very limited rent-growth headroom before tenants either downsize or default.
Forward outlook
- Local home prices are declining (-3.0%/yr); year-one equity from $8k of loan paydown is wiped out by about $36k of value loss. Plan a longer hold.
- San Francisco County population projected at +39% by 2050 — long-run rental-demand tailwind backs the buy-and-hold thesis.
Negotiation context
- It's been on market 498 days — a 12% lower offer ($1.06M) is reasonable based on typical stale-listing flexibility.
- 4 sale attempts since 4y ago with the ask held roughly flat each time — persistent listings suggest the price (not the market) is what's stuck; bring a comps-based counter.
Risks & watch-outs
- Watch-outs: flood insurance adds $66/mo; built in 1948 — expect roof / HVAC / electrical / plumbing capex.
- Climate carrying-cost: severe flood risk — expect insurance premiums to compound above CPI over the hold.
Questions for the listing agent
- What do current leases actually rent for vs. the listed asking? Can we see a recent rent roll and the last 12 months of T-12 income?
- It's been on market 498 days. Have you received any prior offers? Is the seller open to a 25% concession, seller financing, or rate buy-down credit?
- Can we see the unit-by-unit rent roll, current vacancy, and any below-market leases? What's the average tenancy length?
- What capital expenditures (roof, boiler, parking lot, exteriors) have been made in the last 5 years, and what's planned in the next 2?
- Built in 1948 — when were the roof, HVAC, electrical panel, plumbing, and water heater last replaced?
- What's the actual annual flood-insurance premium (NFIP or private), and is the property in a SFHA with mandatory coverage?
- Why hasn't it sold? Are there any deal-killer items the seller is aware of (foundation, flood, title, zoning, code violations)?
- Is there a deadline driving the sale (1031 exchange, divorce, estate, relocation)? That informs how much negotiation room exists.
- Schools are B-rated — typically a magnet for longer-tenancy family renters. What's the average tenant stay here, and is there a school-zone premium baked into asking?
- Crime grade is F in this area — have there been break-ins, vandalism, or insurance claims at this property in the last 3 years? What carrier currently insures it and at what premium?
- The area grade is low — what's the realistic commute time and amenity access for the typical tenant pool here? Any planned neighborhood developments (good or bad) we should know about?
- What's the average days-on-market for RENTAL listings here right now (not sales)? A rising rental-DOM trend means longer vacancies and softer asking-rent achievability than the comps imply.
- What's the recent tenant-quality profile in this submarket — average credit score on applications, eviction rate, late-payment / NSF rate, and stable-employment percentage? A property-management company in the area should have these aggregated.
- How much new apartment / multifamily construction is in the pipeline within 1–3 miles? Heavy new supply (>2% of stock underway) typically softens rents 12–24 months out; light construction supports rent growth.
Investment metrics
- 1% rule
- 0.75% ✗
- Cap rate
- 4.67%
- Cash-on-cash
- -5.78%
- DSCR
- 0.74
- GRM
- 11.2
CMA / ARV
- ARV (median comp)
- $1,829,997
- List price
- $1,200,000
- Delta
- -34.43%
- Verdict
- UNDERPRICED
- Comps
- 20 within 1.0 mi
Show comp detail 4 sales within ~0.75 mi
| Address | Dist | Beds/Ba | Sqft | Sold | Price | $/sf | Match |
|---|---|---|---|---|---|---|---|
| 1719-1721 7th Ave | 0.00mi | 4/2.0 | 2,510 (+6%) | 18mo | $1,620,000 | $645 | 75 |
| 1421-1423 7th Ave | 0.39mi | 4/2.0 | 2,488 (+5%) | 22mo | $1,950,000 | $784 | 56 |
| 2049-2055 9th Ave | 0.43mi | 4/— | 2,216 (-7%) | 16mo | $1,655,000 | $747 | 56 |
| 1204-1206 Funston Ave | 0.74mi | 4/2.0 | 2,230 (-6%) | 11mo | $2,150,000 | $964 | 46 |
Match score weights: distance 35% · size 25% · config 20% · recency 20%. Top-matched comps best support the ARV.
Projected returns pro-forma
-3.0% appreciation · 8.0% rent growth · sell at horizon
- IRR
- -20.9%
- Equity multiple
- 0.24×
- Total profit
- $-254,029
- Equity at exit
- $178,924
- IRR
- -5.3%
- Equity multiple
- 0.58×
- Total profit
- $-142,123
- Equity at exit
- $103,754
Cash invested: $336,000 (down + closing). Projections, not guarantees.
Landlord ↔ Tenant lean methodology
- Overall (CITY)
- 0 Strongly Tenant-Friendly
- State California
- 18 Strongly Tenant-Friendly · D+13
- County
- — inherits STATE
- City San Francisco
- 0 Strongly Tenant-Friendly · D+57
ZIP-level market 94122
- Rents YoY
- 9.7%
- Active inventory
- 65
- Price-to-rent
- 22.3×
Monthly cashflow live
- Estimated rent
- $8,964 high interval (Pro) →
- Mortgage (P&I)
- −$6,293
- Tax from tax record
- −$1,908 /mo · $22,897/yr
- Insurance
- −$500
- Flood insurance flood zone
- −$66 /mo · $798/yr
- HOA
- −$0
- Vacancy / Maint / Mgmt
- −$1,882
- Net cashflow
- $-1,686
Break-even live
Sensitivity live
| Price | -10% $-1,007 | -5% $-1,346 | +0% $-1,686 | +5% $-2,026 | +10% $-2,365 |
|---|---|---|---|---|---|
| Rent | -10% $-2,394 | -5% $-2,040 | +0% $-1,686 | +5% $-1,332 | +10% $-978 |
| Rate | -1.0pp $-1,082 | -0.5pp $-1,381 | base $-1,686 | +0.5pp $-1,997 | +1.0pp $-2,313 |
2-unit breakdown (identical units grouped — click to expand)
| Units | Beds | Baths | Est. rent |
|---|---|---|---|
| 2× units | 2 | — | $8,964 |
| #1 | 2 | — | $4,482 |
| #2 | 2 | — | $4,482 |
| Total (2 units) | $8,964 | ||
UW: 25.0% down · 7.5% · 30yr · 1.5% tax · 5.0% vac · 8.0% maint · 8.0% mgmt
Financing live
Cash to close
- Down payment
- $300,000
- Closing costs
- $36,000
- Reserves months
- —
- Total cash needed
- —
Loan-product check · same deal, 3 products live
Conventional
25% down · 7.5% · 30yr
- Down + closing
- —
- Monthly P&I
- —
- Monthly cashflow
- —
- DSCR
- —
- Eligible?
- —
Personal DTI + credit; lowest rate.
DSCR
20% down · 8.5% · 30yr
- Down + closing
- —
- Monthly P&I
- —
- Monthly cashflow
- —
- DSCR
- —
- Eligible?
- —
No personal income docs; deal must DSCR.
Hard money
10% down · 12.0% · 12mo
- Down + closing
- —
- Monthly P&I
- —
- Monthly cashflow
- —
- DSCR
- —
- Eligible?
- —
Short-term bridge; refi at stabilization.
Rent comps 18 comps
| Address | Beds | Baths | Sqft | Rent | $/sqft | DOM | Units | Dist |
|---|---|---|---|---|---|---|---|---|
| 525 Kirkham St San Francisco, CA | 4.0 | 2.0 | 1600 | $6,995 | $4.37 | 25d | 1 | 0.32mi |
| 13 Warren Dr San Francisco, CA | 3.0 | 3.0 | 1900 | $8,750 | $4.61 | 45d | 1 | 0.43mi |
| 80 Castenada Ave San Francisco, CA | 4.0 | 2.5 | 1900 | $11,000 | $5.79 | 0d | 1 | 0.44mi |
| 62 Cragmont Ave San Francisco, CA | 3.0 | 2.0 | 1734 | $7,100 | $4.09 | 45d | 1 | 0.44mi |
| 1265 Stanyan St San Francisco, CA | 3.0 | 2.0 | 2005 | $13,900 | $6.93 | 9d | 1 | 0.72mi |
| 61 Marview Way San Francisco, CA | 3.0 | 2.0 | 1581 | $8,200 | $5.19 | 9d | 1 | 0.77mi |
| 61 Marview Way San Francisco, CA | 3.0 | 2.0 | 1581 | $8,450 | $5.34 | 26d | 1 | 0.77mi |
| 2059 20th Ave San Francisco, CA | 4.0 | 3.0 | 1700 | $7,250 | $4.26 | 26d | 1 | 0.87mi |
| 2317 Cecilia Ave San Francisco, CA | 4.0 | 3.5 | 2150 | $8,800 | $4.09 | 23d | 1 | 0.91mi |
| 22 Mountview Ct San Francisco, CA | 4.0 | 2.0 | 1900 | $7,400 | $3.89 | 45d | 1 | 0.95mi |
| 82 Parnassus Ave San Francisco, CA | 3.0 | 1.0 | 1701 | $2,800 | $1.65 | 3d | 1 | 1.02mi |
| 643 Cole St San Francisco, CA | 3.0 | 1.5 | 1600 | $5,245 | $3.28 | 45d | 1 | 1.14mi |
| 65 High St Unit NA San Francisco, CA | 4.0 | 3.0 | 2315 | $9,950 | $4.30 | 45d | 1 | 1.25mi |
| 1436 Waller St Unit 1436 San Francisco, CA | 3.0 | 2.0 | 1800 | $6,890 | $3.83 | 45d | 1 | 1.29mi |
| 2422 Pacheco St San Francisco, CA | 4.0 | 3.0 | 1761 | $12,000 | $6.81 | 45d | 1 | 1.29mi |
| 1801 29th Ave San Francisco, CA | 3.0 | 2.0 | 1800 | $5,800 | $3.22 | 25d | 1 | 1.29mi |
| 143 Corbett Ave San Francisco, CA | 4.0 | 4.0 | 2500 | $10,500 | $4.20 | 45d | 1 | 1.29mi |
| 623 8th Ave Unit 623 San Francisco, CA | 3.0 | 1.5 | 1660 | $6,295 | $3.79 | 6d | 1 | 1.43mi |
Listing history 22 events
-
2026-06-21days on market $1,200,000 Active 498 DOM
-
2026-06-18days on market $1,200,000 Active 495 DOM
-
2026-06-17days on market $1,200,000 Active 494 DOM
-
2026-06-16days on market $1,200,000 Active 493 DOM
-
2026-06-15days on market $1,200,000 Active 492 DOM
-
2026-06-13days on market $1,200,000 Active 490 DOM
-
2026-06-13days on market $1,200,000 Active 489 DOM
-
2026-06-09days on market $1,200,000 Active 486 DOM
-
2026-06-08days on market $1,200,000 Active 485 DOM
-
2026-06-07days on market $1,200,000 Active 484 DOM
-
2026-06-04days on market $1,200,000 Active 481 DOM
-
2026-06-03days on market $1,200,000 Active 480 DOM
-
2026-06-02days on market $1,200,000 Active 479 DOM
-
2026-06-01days on market $1,200,000 Active 478 DOM
-
2026-05-31days on market $1,200,000 Active 477 DOM
-
2025-02-11status Active 841-char remark
Show marketing remark (841 chars)
Don't blink and miss this spectacular investment opportunity at an affordable price. This classic duplex in the heart of San Francisco. This convenient Inner location is near University of California San Francisco, California Academy of Sciences, Botanical Garden, Golden Gate Park, public transportation, coffee shops, shopping, outdoor recreational activities, a variety of cuisine, museums, entertainment, and everything else that the City offers. This four-bedroom, two-bathroom duplex boasts a two-car garage plus driveway All potential buyers are asked to check with City, County, Zoning, Tax, and other records to determine all details on this property listed above to their satisfaction. This is an AS-IS SALE property. Buyers are responsible to perform their due diligence prior to bidding. Buyers' premium paid at closing by buyer.
-
2025-01-21$1,200,000 Active 841-char remark
Show marketing remark (841 chars)
Don't blink and miss this spectacular investment opportunity at an affordable price. This classic duplex in the heart of San Francisco. This convenient Inner location is near University of California San Francisco, California Academy of Sciences, Botanical Garden, Golden Gate Park, public transportation, coffee shops, shopping, outdoor recreational activities, a variety of cuisine, museums, entertainment, and everything else that the City offers. This four-bedroom, two-bathroom duplex boasts a two-car garage plus driveway All potential buyers are asked to check with City, County, Zoning, Tax, and other records to determine all details on this property listed above to their satisfaction. This is an AS-IS SALE property. Buyers are responsible to perform their due diligence prior to bidding. Buyers' premium paid at closing by buyer.
-
2022-04-01price $1,803,300
-
2022-03-17price $1,834,500
-
2022-03-16status Active
-
2022-03-04historical Contingent - No Show
-
2022-02-04$1,908,000 Active
ⓘ Source: listings_history table (triggers on properties + properties_extension) + one-shot
backfill from property_details.listing_events for pre-trigger history.
Tax reassessment forecast CA · Resets to sale price
- Current annual tax
- $22,897 · $1,908/mo
- Projected year-2 tax
- $22,897 · $1,908/mo
- Expected delta
- $0/yr ($0/mo · 0.0%)
ⓘ Screening estimate from a state-policy table — verify with the county assessor before closing.
Climate risk First Street
- Flood 9/10 Extreme FEMA zone X (unshaded) · 79% chance over 30 yrs
- Wildfire 2/10 Low
- Heat 1/10 Low 7 d/yr ≥76°F today · 15 d/yr by 30 yrs out
- Wind 1/10 Low
- Air quality 7/10 Severe 13 unhealthy d/yr today · 13 by 30 yrs out
Nearby sold comps map
Loading sold comps map…
Walkable amenities ~0.75 mi
Loading nearby amenities…
Taxation est. · year 1
- Rental income
- $107,568
- − Mortgage interest
- −$67,219
- − Property taxes
- −$22,897
- − Insurance
- −$6,798
- − Repairs & maintenance
- −$8,605
- − Management
- −$8,605
- − Depreciation
- −$34,909
- Taxable loss
- −$41,465
- Est. tax savings @ 24.0%
- +$9,952
- After-tax cash flow
- $-10,279/yr
For passive investors: Depreciation is non-cash, so a rental often shows a tax loss while cash-flowing — sheltering income. Rental losses are passive: they offset passive income freely, and up to $25,000/yr can offset ordinary (W-2) income if you actively participate and your MAGI is under $100k (phasing out to $0 by $150k); unused losses carry forward. On sale, claimed depreciation is recaptured at up to 25%, and gains may owe capital-gains tax (a 1031 exchange can defer both). Figures are a year-1 estimate at your 24.0% rate — not tax advice; consult a CPA.
Schools (NCES district)
- District
- San Francisco Unified
- NCES district ID
- 0634410
- Math proficiency
- 50% ▬ 0.00%
- Reading proficiency
- 56% ▲ 1.00%
- Median HH income
- $81,249
- Composite
- 50.14/100
- National rank
- #4088
- State rank
- #322 of 1400 in CA
Livability — San Francisco
- Score
- 76/100
- State rank
- #90
- US rank
- #3143
Category grades
Schools grade is shown separately in the Schools card above.
Census & demographics
- Census place
- San Francisco, CA
- County
- San Francisco County · 827,552 people
- City population
- 827,552
- Metro
- San Francisco-Oakland-Berkeley, CA
- Population (ZIP)
- 55,819
- Household income
- $146,250
- Rent vs Own
- Severe rent burden
- 2227.0
Population outlook (San Francisco County) Hauer SSP2
- Today (2025)
- 1,030,936 people
- By 2030
- 1,110,409 · +7.7%
- By 2040
- 1,270,010 · +23.2%
- By 2050
- 1,435,001 · +39.2%
- By 2075
- 1,779,074 · +72.6%
- By 2100
- 1,966,767 · +90.8%
Race, ethnicity, and origin ACS 2023
- Neighborhood character
- Diverse neighborhood (Simpson 0.66)
- Race & ethnicity
- Asian 44% White 36% Hispanic / Latino 11% Two or more races 11% Black 2%
- Hispanic origin (detail)
- Mexican 4%
- Common ancestry
- Italian 2% Scotch-Irish 2% Lithuanian 2%
- Foreign-born
- 36% · China, Canada, Vietnam
- Languages at home
- 54% English-only · Chinese 26% Spanish 7% Other Indo-European 3%
Political lean MEDSL · San Francisco
- 2024 margin
- Solid D (+64.8) · D 80.3% · R 15.5% · Other 4.1%
- 2008→2024 swing
- -5.7pp toward R · 2008: 70.5pp · 2024: 64.8pp
- All cycles
- 2024: D+64.8 2020: D+72.5 2016: D+76.1 2012: D+70.2 2008: D+70.5
Not yet ingested
- Civics
- —
Market trends
- HPI YoY
- ▼ -946.32%
- Current HPI
- 314.9762
- Rent YoY
- ▲ 9.73%
- Metro
- San Francisco-Oakland-Berkeley, CA
- State GDP YoY
- ▲ 3.21%
- F500 in state
- 116
Industry mix (Fortune 500 HQ in CA)
| Industry | F500 HQs | Revenue |
|---|---|---|
| Technology | 27 | $1,492B |
|
||
| Financial Services | 3 | $174B |
|
||
| Retail | 3 | $44B |
|
||
| Insurance | 3 | $26B |
|
||
| Media / Entertainment | 2 | $115B |
|
||
| Pharmaceuticals / Biotech | 2 | $62B |
|
||
Price history
-37.1% since first listed7 events — show timeline
- 2025-02-11 Relisted — San Francisco MLS
- 2025-01-21 Listed $1,200,000 San Francisco MLS
- 2022-04-01 Price Changed $1,803,300 San Francisco MLS
- 2022-03-17 Price Changed $1,834,500 San Francisco MLS
- 2022-03-16 Relisted — San Francisco MLS
- 2022-03-04 Contingent — San Francisco MLS
- 2022-02-04 Listed $1,908,000 San Francisco MLS
Property tax history
+5.5%/yrLatest (2025): $22,897 · +6.5% YoY. Source: county tax records.
Cash-flow waterfall
monthlySold comps — $/sqft
last 12 mo · ≤1 miLoading sold comps…