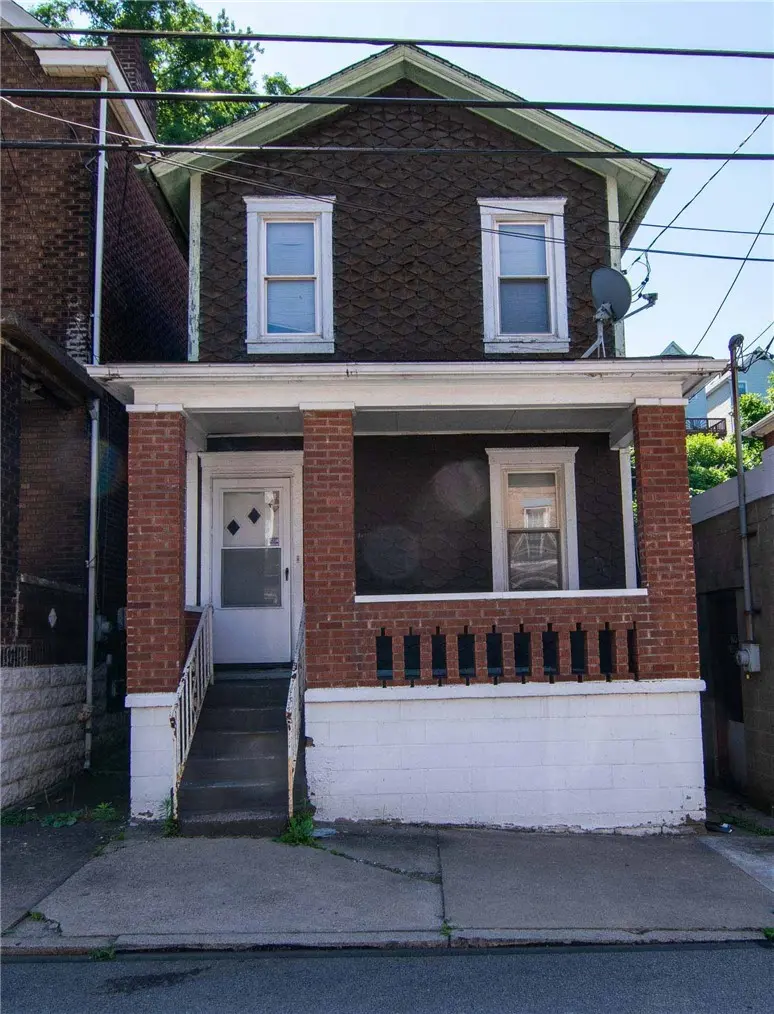
238 Fleet St · Rankin, PA
Flood risk 9/10 · Severe
- FEMA flood zone
- X (unshaded)
- Chance of flooding over 30 yrs
- 0.99%
- Est. flood insurance / yr
- $473 – $860
Fire risk 1/10 · Minimal
- Est. fire insurance / yr
- $511 – $949
Heat risk 4/10 · Minor
- Hot days now (above 98°F)
- 7 days/yr
- Hot days in 30 yrs
- 18 days/yr
Wind risk 2/10 · Minimal
- Chance of severe wind over 30 yrs
- 0.0%
Air-quality risk 4/10 · Minor
- Unhealthy air days now
- 4 days/yr
- Unhealthy air days in 30 yrs
- 5 days/yr
Risk factors via First Street. Map © Google.
Why this score? — see what drove the B+ grade
The composite is a weighted blend of 9 inputs, each scored 0–100. Each bar is that input's sub-score; the figure is the points it added to the 100-point composite (weight × sub-score).
- Cash flow +30.0/30.0
- ARV discount +15.0/15.0
- 1% rule +10.0/10.0
- DSCR +10.0/10.0
- Appreciation +4.2/10.0
- Livability +3.8/5.0
- Rent growth +2.5/5.0
- Condition / age +2.5/5.0
- Schools +1.8/10.0
$65,900
🖨 Deal sheet 📄 Offer letter ✓ Due diligence
Listing remarks MLS
Check out this 2 bedroom, 1 bath single family home located in Rankin PA, affordable and manageable for first time home buyers or investors. The kitchen was renovated last year. The property is not far from the waterfront, giving potential prospects plenty to do in the area.
Key facts
- Waterfront proximity
- Kitchen renovated
- 1,999 sq ft lot
Tags
Neighborhood map
What this means for you Summary
Snapshot
- This is a 2-bed/1.0-bath single-family listed at $66k.
Deal economics
- At list price, monthly cash flow is $393 ($5k/yr) — positive.
- The deal already cash-flows at list — no discount required.
- Meets the 1% rule at list price ($1k rent vs $66k).
- Recommended offer: $60k (9.0% below list) — sets the bar for market timing.
Location & tenants
- Location reads 75/100 on livability (#431 in PA, #3,947 nationally) — a middle-class / working-renter tenant base. Strengths: crime A+, commute A+, cost of living A+; Watch: schools F, amenities F, employment F.
- Woodland Hills SD (suburban): math 13% / reading 30% proficiency, ranked #486 of 539 in PA (top 90%) — low school quality limits family demand, transient renter base, plan for 1-2y turnover; 69% free/reduced lunch — lower-income household profile, screen leases tightly.
- Market conditions: 37 active listings in the ZIP; 17 comparable units currently listed for rent nearby; rentals at typical pace (median 24d on market — plan ~3-4 weeks tenant-placement turnaround); lower-income renter base — watch delinquency; 2,996 units permitted in Allegheny County in 2024 (1,588 in 5+ unit buildings).
- This rent runs 33% of the median local income ($40k/yr) — at the standard rent-burdened threshold; future hikes will face affordability resistance.
Forward outlook
- Local home prices are declining (-1.6%/yr); year-one equity from $456 of loan paydown is wiped out by about $1k of value loss. Plan a longer hold.
- At projected returns (-1.6% appreciation + 3.0% rent growth), your $18k cash investment doubles in ~5 years — after that, you're playing with house money.
Negotiation context
- It's been on market 109 days — a 9% lower offer ($60k) is reasonable based on typical stale-listing flexibility.
- 8 sale attempts since 18y ago; this cycle's ask is 10% above the opening price — seller raised mid-cycle; expect resistance to lowballs.
- Current owner paid $38k; list at $66k implies a 73% gain — meaningful room to come down on a strong offer.
Risks & watch-outs
- Watch-outs: flood insurance adds $56/mo; built in 1900 — expect roof / HVAC / electrical / plumbing capex.
- Climate carrying-cost: severe flood risk — expect insurance premiums to compound above CPI over the hold.
Questions for the listing agent
- It's been on market 109 days. Have you received any prior offers? Is the seller open to a 9% concession, seller financing, or rate buy-down credit?
- Built in 1900 — when were the roof, HVAC, electrical panel, plumbing, and water heater last replaced?
- What's the actual annual flood-insurance premium (NFIP or private), and is the property in a SFHA with mandatory coverage?
- Why hasn't it sold? Are there any deal-killer items the seller is aware of (foundation, flood, title, zoning, code violations)?
- Is there a deadline driving the sale (1031 exchange, divorce, estate, relocation)? That informs how much negotiation room exists.
- Schools are F-rated, which usually means shorter tenancies and higher turnover. Who's the typical renter profile here, and what's been the actual vacancy rate?
- What's the average days-on-market for RENTAL listings here right now (not sales)? A rising rental-DOM trend means longer vacancies and softer asking-rent achievability than the comps imply.
- What's the recent tenant-quality profile in this submarket — average credit score on applications, eviction rate, late-payment / NSF rate, and stable-employment percentage? A property-management company in the area should have these aggregated.
- How much new for-sale + rental construction is in the pipeline within 1–3 miles? Heavy new supply typically softens prices + rents 12–24 months out; constrained supply supports both.
Investment metrics
- 1% rule
- 1.68% ✓
- Cap rate
- 14.47%
- Cash-on-cash
- 29.20%
- DSCR
- 2.30
- GRM
- 5.0
CMA / ARV
- ARV (median comp)
- $88,270
- List price
- $65,900
- Delta
- -25.34%
- Verdict
- UNDERPRICED
- Comps
- 20 within 1.0 mi
Show comp detail 10 sales within ~0.75 mi
| Address | Dist | Beds/Ba | Sqft | Sold | Price | $/sf | Match |
|---|---|---|---|---|---|---|---|
| 116 Lilmont Dr | 0.47mi | 3/2.0 (+1) | 1,000 (+4%) | 1mo | $255,000 | $255 | 62 |
| 2691 Woodstock Ave | 0.38mi | 3/1.5 (+1) | 910 (-5%) | 9mo | $100,000 | $110 | 59 |
| 2457 S Braddock Ave | 0.58mi | 2/1.0 | 988 (+3%) | 12mo | $105,000 | $106 | 58 |
| 2342 Buena Vis | 0.73mi | 2/1.0 | 950 (-1%) | 18mo | $90,000 | $95 | 50 |
| 169 E Marigold St | 0.73mi | 2/1.5 | 1,040 (+8%) | 1mo | $116,000 | $112 | 49 |
| 806 Coalmont St | 0.65mi | 2/1.0 | 918 (-4%) | 16mo | $35,000 | $38 | 49 |
| 93 Lilmont Dr | 0.53mi | 3/2.0 (+1) | 1,000 (+4%) | 13mo | $193,000 | $193 | 49 |
| 416 Mills Ave | 0.37mi | 2/1.0 | 1,072 (+12%) | 18mo | $8,500 | $8 | 48 |
| 165 E Marigold St | 0.74mi | 2/1.0 | 827 (-14%) | 7mo | $150,000 | $181 | 36 |
| 107 Lilmont Dr | 0.46mi | 3/1.5 (+1) | 1,100 (+15%) | 14mo | $250,000 | $227 | 36 |
Match score weights: distance 35% · size 25% · config 20% · recency 20%. Top-matched comps best support the ARV.
Projected returns pro-forma
-1.62% appreciation · 3.0% rent growth · sell at horizon
- IRR
- 22.4%
- Equity multiple
- 1.99×
- Total profit
- $18,298
- Equity at exit
- $13,962
- IRR
- 28.5%
- Equity multiple
- 3.81×
- Total profit
- $51,869
- Equity at exit
- $13,061
Cash invested: $18,452 (down + closing). Projections, not guarantees.
Landlord ↔ Tenant lean methodology
- Overall (STATE)
- 62 Landlord-Friendly
- State Pennsylvania
- 62 Landlord-Friendly · EVEN
- County
- — inherits STATE
- City
- — inherits STATE
ZIP-level market 15104
- Home prices YoY
- -1.1%
- Active inventory
- 37
- Price-to-rent
- 5.0×
Monthly cashflow live
- Estimated rent
- $1,109 high interval (Pro) →
- Mortgage (P&I)
- −$346
- Tax from tax record
- −$54 /mo · $653/yr
- Insurance
- −$27
- Flood insurance flood zone
- −$56 /mo · $666/yr
- HOA
- −$0
- Vacancy / Maint / Mgmt
- −$233
- Net cashflow
- $393
Break-even live
UW: 25.0% down · 7.5% · 30yr · 1.5% tax · 5.0% vac · 8.0% maint · 8.0% mgmt
Financing live
Cash to close
- Down payment
- $16,475
- Closing costs
- $1,977
- Reserves months
- —
- Total cash needed
- —
Loan-product check · same deal, 3 products live
Conventional
25% down · 7.5% · 30yr
- Down + closing
- —
- Monthly P&I
- —
- Monthly cashflow
- —
- DSCR
- —
- Eligible?
- —
Personal DTI + credit; lowest rate.
DSCR
20% down · 8.5% · 30yr
- Down + closing
- —
- Monthly P&I
- —
- Monthly cashflow
- —
- DSCR
- —
- Eligible?
- —
No personal income docs; deal must DSCR.
Hard money
10% down · 12.0% · 12mo
- Down + closing
- —
- Monthly P&I
- —
- Monthly cashflow
- —
- DSCR
- —
- Eligible?
- —
Short-term bridge; refi at stabilization.
Rent comps 17 comps
| Address | Beds | Baths | Sqft | Rent | $/sqft | DOM | Units | Dist |
|---|---|---|---|---|---|---|---|---|
| 144 Comrie Ave Braddock, PA | 3.0 | 1.0 | 1000 | $1,250 | $1.25 | 23d | 1 | 0.21mi |
| 2673 Woodstock Ave Pittsburgh, PA | 3.0 | 1.0 | 1000 | $1,190 | $1.19 | 23d | 1 | 0.41mi |
| 207 Montana Ave Pittsburgh, PA | 2.0 | 1.0 | 840 | $1,000 | $1.19 | 23d | 1 | 0.67mi |
| 2319 S Braddock Ave Unit 2 Pittsburgh, PA | 1.0 | 1.0 | 600 | $1,090 | $1.82 | 23d | 1 | 0.79mi |
| 817 Kirkpatrick Ave Unit 8171-A Braddock, PA | 2.0 | 1.0 | 866 | $800 | $0.92 | 43d | 1 | 0.80mi |
| 2255 Hawthorne Ave Unit 2255 Swissvale, PA | 2.0 | 1.0 | 1020 | $1,000 | $0.98 | 12d | 1 | 0.89mi |
| 7801 Lloyd Ave Unit 105 Pittsburgh, PA | 1.0 | 1.0 | 750 | $970 | $1.29 | 23d | 1 | 0.95mi |
| 214 Vine St Homestead, PA | 2.0 | 1.0 | 1034 | $1,150 | $1.11 | 43d | 1 | 0.98mi |
| 2121 Milligan Ave Unit 6 Pittsburgh, PA | 2.0 | 1.0 | 800 | $1,300 | $1.62 | 4d | 1 | 1.02mi |
| 2121 Milligan Ave Unit 3 Pittsburgh, PA | 2.0 | 1.0 | 800 | $1,195 | $1.49 | 43d | 1 | 1.02mi |
| 1003 Smokey Wood Dr Swissvale, PA | 1.0–2.0 | 1.0 | 874 | $1,475 | $1.69 | 4d | 4 | 1.08mi |
| 7467 Schoyer Ave Pittsburgh, PA | 1.0 | 1.0 | 900 | $895 | $0.99 | 2d | 1 | 1.31mi |
| 1635 Ardmore Blvd Pittsburgh, PA | 1.0 | 1.0 | 650 | $800 | $1.23 | 21d | 1 | 1.44mi |
| 7340 Whipple St Swissvale, PA | 1.0 | 1.0 | 685 | $920 | $1.34 | 23d | 2 | 1.45mi |
| 7338 Whipple St Unit 10 Swissvale, PA | 1.0 | 1.0 | 685 | $920 | $1.34 | 23d | 1 | 1.45mi |
| 7122 Harrison Ave Unit 1 Pittsburgh, PA | 1.0 | 1.0 | 820 | $1,100 | $1.34 | 16d | 1 | 1.46mi |
| 227 Parklane Dr Unit Parklane Dr unit North Braddock, PA | 3.0 | 1.0 | 1107 | $1,500 | $1.36 | 12d | 1 | 1.50mi |
Listing history 23 events
-
2026-03-19price $65,900 275-char remark
Show marketing remark (275 chars)
Check out this 2 bedroom, 1 bath single family home located in Rankin PA, affordable and manageable for first time home buyers or investors. The kitchen was renovated last year. The property is not far from the waterfront, giving potential prospects plenty to do in the area.
-
2026-02-25price $69,900 275-char remark
Show marketing remark (275 chars)
Check out this 2 bedroom, 1 bath single family home located in Rankin PA, affordable and manageable for first time home buyers or investors. The kitchen was renovated last year. The property is not far from the waterfront, giving potential prospects plenty to do in the area.
-
2026-02-25status Active 275-char remark
Show marketing remark (275 chars)
Check out this 2 bedroom, 1 bath single family home located in Rankin PA, affordable and manageable for first time home buyers or investors. The kitchen was renovated last year. The property is not far from the waterfront, giving potential prospects plenty to do in the area.
-
2025-12-07$60,000 Active 275-char remark
Show marketing remark (275 chars)
Check out this 2 bedroom, 1 bath single family home located in Rankin PA, affordable and manageable for first time home buyers or investors. The kitchen was renovated last year. The property is not far from the waterfront, giving potential prospects plenty to do in the area.
-
2024-08-08price $73,000 395-char remark
Show marketing remark (395 chars)
Check out this 2 bedroom, 1 bath single family home located in Rankin PA, perfect for a first time homebuyer or investor. The kitchen was renovated last year. Hot water tank installed within the last couple of years. The property is not far from the waterfront, giving potential prospects plenty to do in the area such as the movies, Dave & Buster's, many restaurants and even the Improve.
-
2024-07-30$70,000 Active 395-char remark
Show marketing remark (395 chars)
Check out this 2 bedroom, 1 bath single family home located in Rankin PA, perfect for a first time homebuyer or investor. The kitchen was renovated last year. Hot water tank installed within the last couple of years. The property is not far from the waterfront, giving potential prospects plenty to do in the area such as the movies, Dave & Buster's, many restaurants and even the Improve.
-
2023-06-27historical
-
2023-01-19soldstatus $38,000
-
2023-01-17status Pending
-
2023-01-13soldstatus $38,000 Closed
-
2022-12-20historical Contingent
-
2022-10-20status Active
-
2022-10-11historical Contingent
-
2022-10-05status Active
-
2022-09-29price $45,000
-
2022-09-29status Active
-
2022-08-23price $45
-
2022-08-04$50,000 Active
-
2013-12-26soldstatus $28,000
-
2008-12-22soldstatus $9,000
-
2008-12-18soldstatus $9,000
-
2008-06-30$15,000
-
1984-02-02soldstatus $12,000
ⓘ Source: listings_history table (triggers on properties + properties_extension) + one-shot
backfill from property_details.listing_events for pre-trigger history.
Tax reassessment forecast PA · Partial reset (capped growth)
- Current annual tax
- $653 · $54/mo
- Projected year-2 tax
- $847 · $71/mo
- Expected delta
- +$194/yr (+$16/mo · 29.8%)
ⓘ Screening estimate from a state-policy table — verify with the county assessor before closing.
Climate risk First Street
- Flood 9/10 Extreme FEMA zone X (unshaded) · 99% chance over 30 yrs
- Wildfire 1/10 Low
- Heat 4/10 Moderate 7 d/yr ≥98°F today · 18 d/yr by 30 yrs out
- Wind 2/10 Low 0% chance of damaging wind over 30 yrs
- Air quality 4/10 Moderate 4 unhealthy d/yr today · 5 by 30 yrs out
Nearby sold comps map
Loading sold comps map…
Walkable amenities ~0.75 mi
Loading nearby amenities…
Taxation est. · year 1
- Rental income
- $13,312
- − Mortgage interest
- −$3,691
- − Property taxes
- −$653
- − Insurance
- −$996
- − Repairs & maintenance
- −$1,065
- − Management
- −$1,065
- − Depreciation
- −$1,917
- Taxable income
- $3,925
- Est. tax owed @ 24.0%
- −$942
- After-tax cash flow
- $3,779/yr
For passive investors: Depreciation is non-cash, so a rental often shows a tax loss while cash-flowing — sheltering income. Rental losses are passive: they offset passive income freely, and up to $25,000/yr can offset ordinary (W-2) income if you actively participate and your MAGI is under $100k (phasing out to $0 by $150k); unused losses carry forward. On sale, claimed depreciation is recaptured at up to 25%, and gains may owe capital-gains tax (a 1031 exchange can defer both). Figures are a year-1 estimate at your 24.0% rate — not tax advice; consult a CPA.
Schools (NCES district)
- District
- Woodland Hills SD
- NCES district ID
- 4216500
- Math proficiency
- 13% ▼ -13.00%
- Reading proficiency
- 30% ▼ -10.00%
- Median HH income
- $41,803
- Composite
- 18.31/100
- National rank
- #8954
- State rank
- #486 of 539 in PA
Livability — Rankin
- Score
- 75/100
- State rank
- #431
- US rank
- #3947
Category grades
Schools grade is shown separately in the Schools card above.
Census & demographics
- Census place
- Rankin, PA
- County
- Allegheny County · 1,022,028 people
- City population
- 8,034
- Metro
- Pittsburgh, PA
- Population (ZIP)
- 8,034
- Household income
- $40,104
- Rent vs Own
- Severe rent burden
- 515.0
Population outlook (Allegheny County) Hauer SSP2
- Today (2025)
- 1,250,282 people
- By 2030
- 1,256,482 · +0.5%
- By 2040
- 1,256,318 · +0.5%
- By 2050
- 1,244,169 · -0.5%
- By 2075
- 1,197,693 · -4.2%
- By 2100
- 1,093,187 · -12.6%
Race, ethnicity, and origin ACS 2023
- Neighborhood character
- Diverse neighborhood (Simpson 0.56)
- Race & ethnicity
- Black 59% White 31% Two or more races 6% Hispanic / Latino 3%
- Common ancestry
- Romanian 4% Hispanic 1% Lithuanian 1%
- Foreign-born
- 0%
- Languages at home
- 97% English-only · Spanish 2%
Political lean MEDSL · Allegheny
- 2024 margin
- Strong D (+20.3) · D 59.7% · R 39.4%
- 2008→2024 swing
- +4.8pp toward D · 2008: 15.5pp · 2024: 20.3pp
- All cycles
- 2024: D+20.3 2020: D+20.4 2016: D+16.4 2012: D+14.4 2008: D+15.5
Not yet ingested
- Civics
- —
Market trends
- HPI YoY
- ▼ -1.62%
- Current HPI
- 138.912
- Rent YoY
- —
- Metro
- Pittsburgh, PA
- State GDP YoY
- ▲ 1.68%
- F500 in state
- 34
Industry mix (Fortune 500 HQ in PA)
| Industry | F500 HQs | Revenue |
|---|---|---|
| Healthcare | 2 | $309B |
|
||
| Insurance | 2 | $27B |
|
||
| Telecommunications / Media | 1 | $124B |
|
||
| Industrial Distribution | 1 | $22B |
|
||
| Financial Services | 1 | $20B |
|
||
| Chemicals / Materials | 1 | $18B |
|
||
Price history
+449.2% since first listed23 events — show timeline
- 2026-03-19 Price Changed $65,900 West Penn MLS
- 2026-02-25 Price Changed $69,900 West Penn MLS
- 2026-02-25 Relisted — West Penn MLS
- 2025-12-07 Listed $60,000 West Penn MLS
- 2024-08-08 Price Changed $73,000 West Penn MLS
- 2024-07-30 Listed $70,000 West Penn MLS
- 2023-06-27 Rental Removed — TURBOTENANT
- 2023-01-19 Sold (Public Records) $38,000 Public Records
- 2023-01-17 Pending — West Penn MLS
- 2023-01-13 Sold (MLS) $38,000 West Penn MLS
- 2022-12-20 Contingent — West Penn MLS
- 2022-10-20 Relisted — West Penn MLS
- 2022-10-11 Contingent — West Penn MLS
- 2022-10-05 Relisted — West Penn MLS
- 2022-09-29 Price Changed $45,000 West Penn MLS
- 2022-09-29 Relisted — West Penn MLS
- 2022-08-23 Price Changed $45 West Penn MLS
- 2022-08-04 Listed $50,000 West Penn MLS
- 2013-12-26 Sold (Public Records) $28,000 Public Records
- 2008-12-22 Sold (Public Records) $9,000 Public Records
- 2008-12-18 Sold (MLS) $9,000 West Penn MLS
- 2008-06-30 Listed $15,000 West Penn MLS
- 1984-02-02 Sold (Public Records) $12,000 Public Records
Property tax history
+2.0%/yrLatest (2026): $653 · +3.0% YoY. Source: county tax records.
Cash-flow waterfall
monthlySold comps — $/sqft
last 12 mo · ≤1 miLoading sold comps…