203 Harold Dr · Decatur, AL
Flood risk 1/10 · Minimal
- FEMA flood zone
- X (unshaded)
- Chance of flooding over 30 yrs
- 0.0%
- Est. flood insurance / yr
- $507 – $1,088
Fire risk 5/10 · Moderate
- Est. fire insurance / yr
- $916 – $1,700
Heat risk 5/10 · Moderate
- Hot days now (above 105°F)
- 7 days/yr
- Hot days in 30 yrs
- 19 days/yr
Wind risk 4/10 · Minor
- Chance of severe wind over 30 yrs
- 21.0%
Air-quality risk 2/10 · Minimal
- Unhealthy air days now
- 1 days/yr
- Unhealthy air days in 30 yrs
- 1 days/yr
Risk factors via First Street. Map © Google.
Why this score? — see what drove the D grade
The composite is a weighted blend of 9 inputs, each scored 0–100. Each bar is that input's sub-score; the figure is the points it added to the 100-point composite (weight × sub-score).
- Cash flow +13.8/30.0
- ARV discount +7.5/15.0
- DSCR +4.2/10.0
- 1% rule +3.9/10.0
- Livability +3.6/5.0
- Schools +2.7/10.0
- Rent growth +2.5/5.0
- Condition / age +2.5/5.0
- Appreciation +0.0/10.0
$159,999
🖨 Deal sheet (PDF) 📄 Offer letter ✓ Due diligence
Listing remarks
Looking for space without giving up convenience? This one checks all the boxes! Sitting on . 8 acres, this 3 bed, 2 full bath home features an open floor plan, private master suite, huge front and back yards, storage building, and even a storm shelter. Country vibes with city access - don't miss this one!
Key facts
- Open floor plan
- Private master suite
- Storage building
Tags
Property features AI
Finance
- Other: Property includes 1,120 square feet of living area
- HOA & community: No association; Located in the Stone Acres subdivision
Exterior
- Parking: Gravel driveway
- Utilities: Septic tank
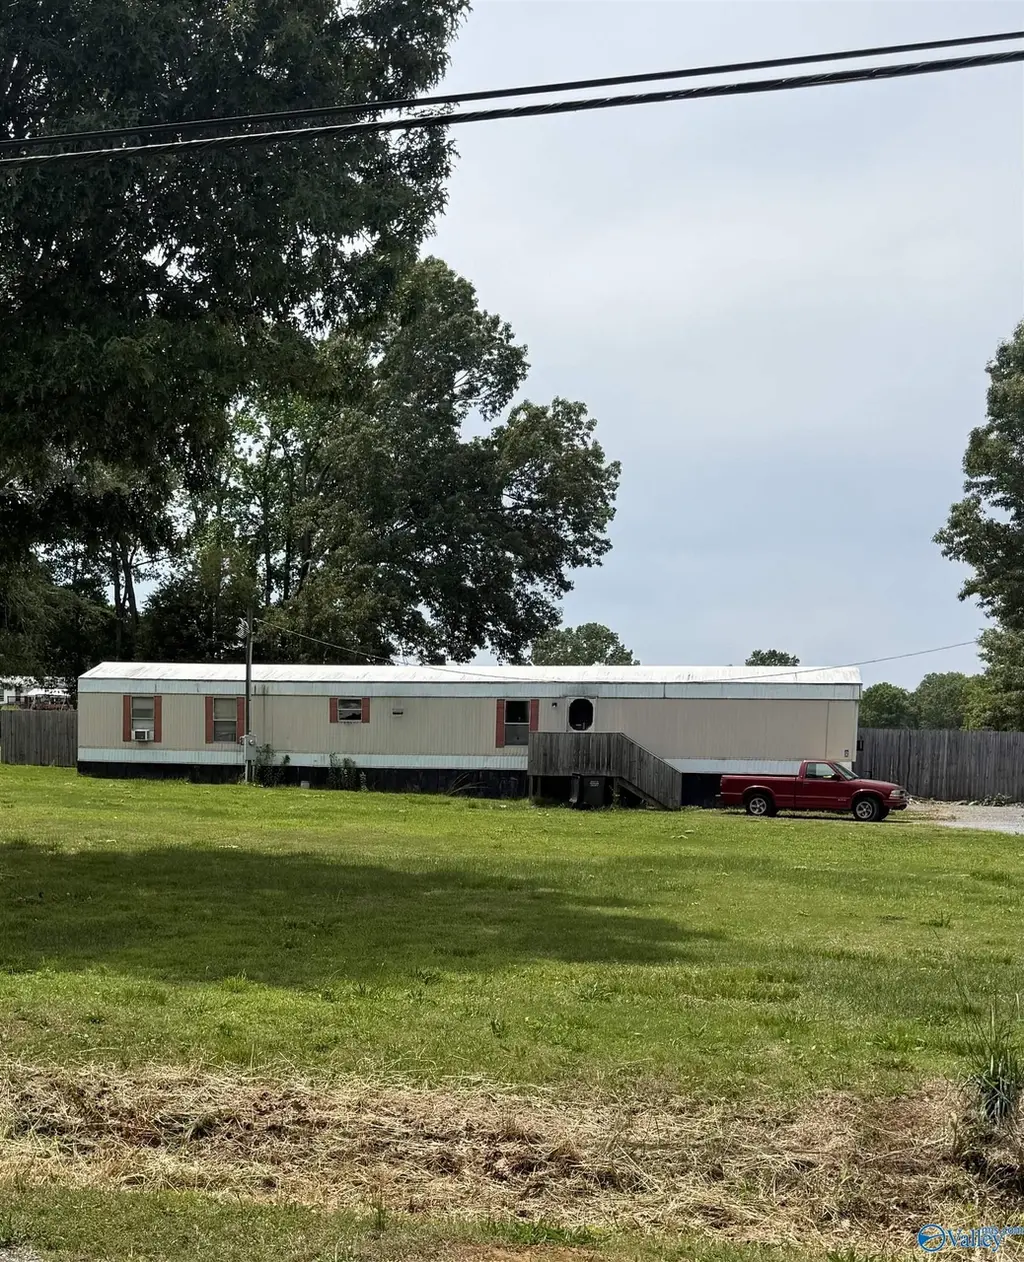
- Home design: Manufactured home (residential); Built in 1988
- Construction: See remarks for foundation details
- Exterior features: Covered patio; Front porch; Private pool; 0.8-acre lot
Interior
- Bathrooms: Two full bathrooms
- Heating & cooling: Central heating; Multiple window air conditioning units
- Interior features: Seven total rooms; Storm shelter
Neighborhood map
What this means for you Summary
Snapshot
- This is a 3-bed/2.0-bath land listed at $160k.
Deal economics
- At list price, monthly cash flow is $15 ($182/yr) — positive.
- The deal already cash-flows at list — no discount required.
- To meet the 1% rule (rent ≥ 1% of price), the offer needs to be $142k (11.3% below list).
- Recommended offer: $142k (11.3% below list) — sets the bar for 1% rule.
- Cap rate 6.4% vs local median 4.0% in Decatur — top-decile yield for the area; either an underpriced asset or a hidden risk that comps aren't pricing in. Stress-test before assuming the spread holds.
Location & tenants
- Location reads 72/100 on livability (#28 in AL) — a middle-class / working-renter tenant base. Strengths: cost of living A+, housing A+, health & safety A+; Watch: employment D+, crime F, amenities F.
- Morgan County (rural): math 19% / reading 43% proficiency, ranked #61 of 129 in AL (top 47%) — families likely to look elsewhere, expect single-tenant / working-renter base with shorter leases.
- Zoned schools: West Morgan Elementary School (math 22% / reading 42%, grade F, #331 of 627 statewide, top 57%, 616 students, 70% FRL); West Morgan Middle School (math 9% / reading 34%, grade F, #185 of 257 statewide, top 73%, 426 students, 71% FRL); West Morgan High School (math 2% / reading 12%, grade F, #265 of 305 statewide, top 89%, 438 students, 65% FRL) — zoned schools average 69% FRL vs 44% district-wide (25 pts higher); higher-poverty schools than district average — tighter screening recommended.
- Market conditions: 403 active listings in the ZIP; solid renter incomes; 231 units permitted in Morgan County in 2024 (0 in 5+ unit buildings).
Forward outlook
- Local home prices are declining (-3.0%/yr); year-one equity from $1k of loan paydown is wiped out by about $5k of value loss. Plan a longer hold.
- Morgan County population projected at -11% by 2050 — secular population decline; favor cash flow + early exit over multi-decade hold.
Negotiation context
- It's been on market 34 days — a 3% lower offer ($155k) is reasonable based on typical stale-listing flexibility.
- Current owner paid $23k; list at $160k implies a 596% gain — meaningful room to come down on a strong offer.
Risks & watch-outs
- Climate carrying-cost: moderate wildfire risk; extreme-heat days projected 7→19/yr by 2055 (HVAC capex compounding) — expect insurance premiums to compound above CPI over the hold.
Questions for the listing agent
- It's been on market 34 days. Have you received any prior offers? Is the seller open to a 11% concession, seller financing, or rate buy-down credit?
- Is there a deadline driving the sale (1031 exchange, divorce, estate, relocation)? That informs how much negotiation room exists.
- Crime grade is F in this area — have there been break-ins, vandalism, or insurance claims at this property in the last 3 years? What carrier currently insures it and at what premium?
- The area grade is low — what's the realistic commute time and amenity access for the typical tenant pool here? Any planned neighborhood developments (good or bad) we should know about?
- What's the average days-on-market for RENTAL listings here right now (not sales)? A rising rental-DOM trend means longer vacancies and softer asking-rent achievability than the comps imply.
- What's the recent tenant-quality profile in this submarket — average credit score on applications, eviction rate, late-payment / NSF rate, and stable-employment percentage? A property-management company in the area should have these aggregated.
- How much new for-sale + rental construction is in the pipeline within 1–3 miles? Heavy new supply typically softens prices + rents 12–24 months out; constrained supply supports both.
Investment metrics
- 1% rule
- 0.89% ✗
- Cap rate
- 6.41%
- Cash-on-cash
- 0.41%
- DSCR
- 1.02
- GRM
- 9.4
CMA / ARV
No comps found within radius.
Projected returns pro-forma
-3.0% appreciation · 3.0% rent growth · sell at horizon
- IRR
- -15.6%
- Equity multiple
- 0.44×
- Total profit
- $-24,940
- Equity at exit
- $23,856
- IRR
- -7.2%
- Equity multiple
- 0.54×
- Total profit
- $-20,387
- Equity at exit
- $13,834
Cash invested: $44,800 (down + closing). Projections, not guarantees.
Landlord ↔ Tenant lean methodology
- Overall (STATE)
- 90 Strongly Landlord-Friendly
- State Alabama
- 90 Strongly Landlord-Friendly · R+15
- County
- — inherits STATE
- City
- — inherits STATE
ZIP-level market 35603
- Active inventory
- 403
- Price-to-rent
- 9.4×
Monthly cashflow live
- Estimated rent
- $1,419 medium interval (Pro) →
- Mortgage (P&I)
- −$839
- Tax est. 1.5%
- −$200 /mo · $2,400/yr
- Insurance
- −$67
- HOA
- −$0
- Vacancy / Maint / Mgmt
- −$298
- Net cashflow
- $15
Break-even live
Sensitivity live
| Price | -10% $126 | -5% $70 | +0% $15 | +5% $-40 | +10% $-95 |
|---|---|---|---|---|---|
| Rent | -10% $-97 | -5% $-41 | +0% $15 | +5% $71 | +10% $127 |
| Rate | -1.0pp $96 | -0.5pp $56 | base $15 | +0.5pp $-26 | +1.0pp $-68 |
UW: 25.0% down · 7.5% · 30yr · 1.5% tax · 5.0% vac · 8.0% maint · 8.0% mgmt
Financing live
Cash to close
- Down payment
- $40,000
- Closing costs
- $4,800
- Reserves months
- —
- Total cash needed
- —
Loan-product check · same deal, 3 products live
Conventional
25% down · 7.5% · 30yr
- Down + closing
- —
- Monthly P&I
- —
- Monthly cashflow
- —
- DSCR
- —
- Eligible?
- —
Personal DTI + credit; lowest rate.
DSCR
20% down · 8.5% · 30yr
- Down + closing
- —
- Monthly P&I
- —
- Monthly cashflow
- —
- DSCR
- —
- Eligible?
- —
No personal income docs; deal must DSCR.
Hard money
10% down · 12.0% · 12mo
- Down + closing
- —
- Monthly P&I
- —
- Monthly cashflow
- —
- DSCR
- —
- Eligible?
- —
Short-term bridge; refi at stabilization.
Listing history 17 events
-
2026-06-21days on market $159,999 Active 34 DOM
-
2026-06-18days on market $159,999 Active 31 DOM
-
2026-06-17days on market $159,999 Active 30 DOM
-
2026-06-16days on market $159,999 Active 29 DOM
-
2026-06-15days on market $159,999 Active 28 DOM
-
2026-06-14days on market $159,999 Active 26 DOM
-
2026-06-13days on market $159,999 Active 25 DOM
-
2026-06-10days on market $159,999 Active 23 DOM
-
2026-06-09days on market $159,999 Active 22 DOM
-
2026-06-08days on market $159,999 Active 21 DOM
-
2026-06-07days on market $159,999 Active 20 DOM
-
2026-06-02days on market $159,999 Active 15 DOM
-
2026-06-01days on market $159,999 Active 14 DOM
-
2026-05-31days on market $159,999 Active 13 DOM
-
2026-05-30days on market $159,999 Active 12 DOM
-
2026-05-18$159,999 Active
-
2002-01-28soldstatus $23,000
ⓘ Source: listings_history table (triggers on properties + properties_extension) + one-shot
backfill from property_details.listing_events for pre-trigger history.
Climate risk First Street
- Flood 1/10 Low FEMA zone X (unshaded) · 0% chance over 30 yrs
- Wildfire 5/10 Major
- Heat 5/10 Major 7 d/yr ≥105°F today · 19 d/yr by 30 yrs out
- Wind 4/10 Moderate 21% chance of damaging wind over 30 yrs
- Air quality 2/10 Low 1 unhealthy d/yr today · 1 by 30 yrs out
Nearby sold comps map
Loading sold comps map…
Walkable amenities ~0.75 mi
Loading nearby amenities…
Taxation est. · year 1
- Rental income
- $17,026
- − Mortgage interest
- −$8,962
- − Property taxes
- −$2,400
- − Insurance
- −$800
- − Repairs & maintenance
- −$1,362
- − Management
- −$1,362
- − Depreciation
- −$4,655
- Taxable loss
- −$2,515
- Est. tax savings @ 24.0%
- +$604
- After-tax cash flow
- $786/yr
For passive investors: Depreciation is non-cash, so a rental often shows a tax loss while cash-flowing — sheltering income. Rental losses are passive: they offset passive income freely, and up to $25,000/yr can offset ordinary (W-2) income if you actively participate and your MAGI is under $100k (phasing out to $0 by $150k); unused losses carry forward. On sale, claimed depreciation is recaptured at up to 25%, and gains may owe capital-gains tax (a 1031 exchange can defer both). Figures are a year-1 estimate at your 24.0% rate — not tax advice; consult a CPA.
Schools (NCES district)
- District
- Morgan County
- NCES district ID
- 0102480
- Math proficiency
- 19% ▼ -28.00%
- Reading proficiency
- 43% ▼ -3.00%
- Median HH income
- $47,362
- Composite
- 26.68/100
- National rank
- #7157
- State rank
- #61 of 129 in AL
Livability — Decatur
- Score
- 72/100
- State rank
- #28
- US rank
- #5989
Category grades
Schools grade is shown separately in the Schools card above.
Census & demographics
- County
- Morgan County · 67,628 people
- City population
- 67,628
- Metro
- Decatur, AL
- Population (ZIP)
- 32,179
- Household income
- $81,490
- Rent vs Own
- Severe rent burden
- 467.0
Population outlook (Morgan County) Hauer SSP2
- Today (2025)
- 118,775 people
- By 2030
- 116,979 · -1.5%
- By 2040
- 111,800 · -5.9%
- By 2050
- 105,181 · -11.4%
- By 2075
- 87,736 · -26.1%
- By 2100
- 67,624 · -43.1%
Race, ethnicity, and origin ACS 2023
- Neighborhood character
- Predominantly White (74%)
- Race & ethnicity
- White 74% Black 15% Hispanic / Latino 6% Two or more races 5%
- Hispanic origin (detail)
- Mexican 3%
- Common ancestry
- Italian 2% Slovak 2% Serbian 1%
- Foreign-born
- 5% · Canada, Vietnam
- Languages at home
- 92% English-only · Spanish 5% Arabic 2%
Political lean MEDSL · Morgan
- 2024 margin
- Solid R (+52.6) · D 23.2% · R 75.8%
- 2008→2024 swing
- -8.8pp toward R · 2008: -43.8pp · 2024: -52.6pp
- All cycles
- 2024: R+52.6 2020: R+49.2 2016: R+52.4 2012: R+44.5 2008: R+43.8
Not yet ingested
- Civics
- —
Market trends
- HPI YoY
- ▼ -141.07%
- Current HPI
- 243.157
- Rent YoY
- —
- Metro
- Decatur, AL
- State GDP YoY
- ▲ 2.94%
- F500 in state
- 4
Industry mix (Fortune 500 HQ in AL)
| Industry | F500 HQs | Revenue |
|---|---|---|
| Financial Services | 1 | $8B |
|
||
| Healthcare | 1 | $5B |
|
||
Price history
+595.6% since first listed2 events — show timeline
- 2026-05-18 Listed $159,999 VMLS
- 2002-01-28 Sold (Public Records) $23,000 Public Records
Property tax history
+1.3%/yrLatest (2025): $110 · +70.5% YoY. Source: county tax records.
Cash-flow waterfall
monthlySold comps — $/sqft
last 12 mo · ≤1 miLoading sold comps…