 Duplex
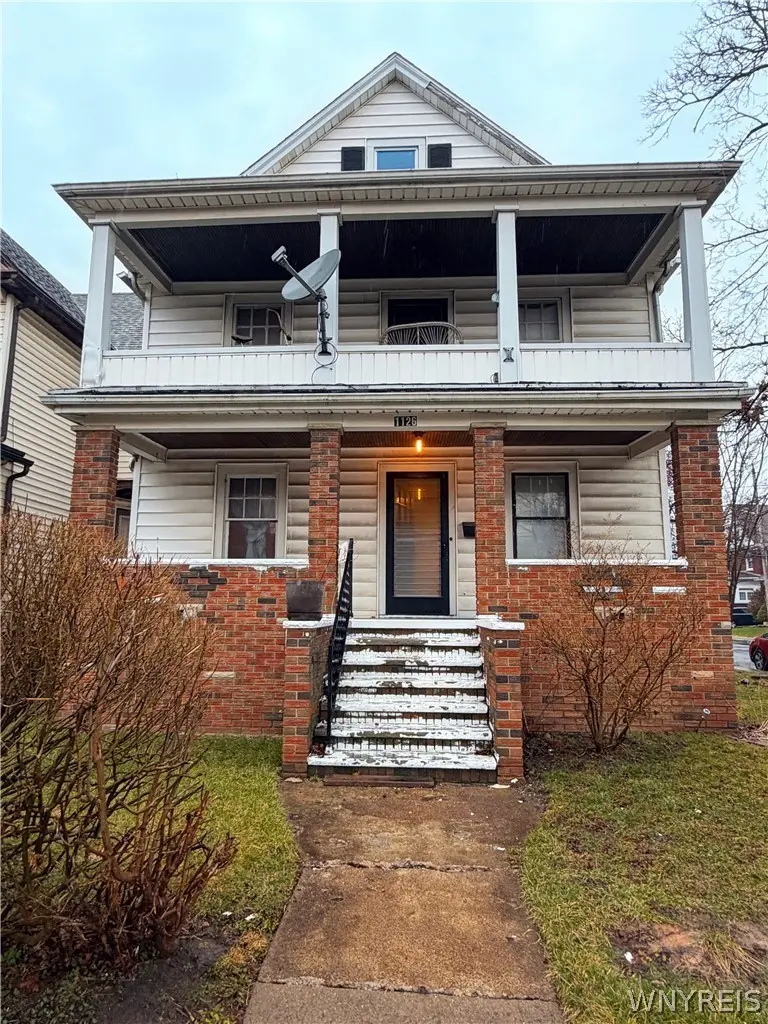
1126 Ferry Ave · Niagara Falls, NY
Flood risk 1/10 · Minimal
- FEMA flood zone
- X (unshaded)
- Chance of flooding over 30 yrs
- 0.0%
- Est. flood insurance / yr
- $473 – $860
Fire risk 1/10 · Minimal
- Est. fire insurance / yr
- $691 – $1,283
Heat risk 2/10 · Minimal
- Hot days now (above 94°F)
- 7 days/yr
- Hot days in 30 yrs
- 15 days/yr
Wind risk 1/10 · Minimal
- Chance of severe wind over 30 yrs
- —
Air-quality risk 3/10 · Minor
- Unhealthy air days now
- 2 days/yr
- Unhealthy air days in 30 yrs
- 3 days/yr
Risk factors via First Street. Map © Google.
Why this score? — see what drove the B+ grade
The composite is a weighted blend of 9 inputs, each scored 0–100. Each bar is that input's sub-score; the figure is the points it added to the 100-point composite (weight × sub-score).
- Cash flow +30.0/30.0
- 1% rule +10.0/10.0
- DSCR +10.0/10.0
- Appreciation +10.0/10.0
- ARV discount +4.7/15.0
- Rent growth +4.7/5.0
- Livability +3.0/5.0
- Schools +2.5/10.0
- Condition / age +2.5/5.0
$124,900
🖨 Deal sheet (PDF) 📄 Offer letter ✓ Due diligence
Multi-family units
County records classify this as Multi-Family (2-4 Unit). Listing-text estimate: 2 units. confirmed
Listing remarks
EXCELLENT INVESTMENT or HOUSE HACK OPPORTUNITY in this Niagara Falls approved SHORT-TERM rental district. SOLID 2-family home that was owner-occupied & very well maintained. 3 BR/1 Bath lower and 2 BR/1 Bath Upper. Spacious units with gleaming hardwood floors and natural woodwork. New roof & gutters (2025), Lower furnace 2018 & newer HWT. Appliances included. Spacious basement with 2 sets of laundry hook-ups & glass block windows. Walk-up attic provides additional storage. Lower unit, basement & attic are easy to show. Upper is tenant occupied & requires 48 hour notice or can be seen on 2nd showing. Property is an estate and is sold AS IS. Executor is not
Key facts
- Natural woodwork
- Walk up attic
- Newer hwt
Tags
Neighborhood map
What this means for you Summary
Snapshot
- This is a 2 × 3.0-bed/1.0-bath units multifamily listed at $125k.
Deal economics
- At list price, monthly cash flow is $1k ($14k/yr) — positive. Per door: $602/mo.
- The deal already cash-flows at list — no discount required.
- Meets the 1% rule at list price ($3k rent vs $125k).
- Cap rate 17.9% vs local median 7.5% in Niagara Falls — top-decile yield for the area; either an underpriced asset or a hidden risk that comps aren't pricing in. Stress-test before assuming the spread holds.
Location & tenants
- Location reads 60/100 on livability (#956 in NY) — a middle-class / working-renter tenant base. Strengths: cost of living A+, housing A+; Watch: crime F, amenities F, commute F.
- Niagara Falls City School District (urban): math 26% / reading 34% proficiency, ranked #578 of 590 in NY (top 98%) — families likely to look elsewhere, expect single-tenant / working-renter base with shorter leases; 66% free/reduced lunch — lower-income household profile, screen leases tightly.
- Zoned schools: Harry F Abate Elementary School (math 16% / reading 32%, grade F, #1,909 of 2,108 statewide, top 91%, 695 students, 82% FRL); Gaskill Preparatory School (math 10% / reading 22%, grade F, #702 of 729 statewide, top 96%, 500 students, 78% FRL); Niagara Falls High School (math 75% / reading 92%, grade A, #409 of 1,100 statewide, top 39%, 2,139 students, 71% FRL).
- Market conditions: Rents rising fast (+8.8%/yr); 164 active listings in the ZIP; 1 comparable units currently listed for rent nearby; lower-income renter base — watch delinquency; 167 units permitted in Niagara County in 2024 (0 in 5+ unit buildings).
- At $2,535/mo this rent would consume 88% of the median local household income ($35k/yr) (locally 954% of renters already pay >50% of income on rent) — very limited rent-growth headroom before tenants either downsize or default.
Forward outlook
- In year one you build about $13k of equity ($864 loan paydown + $12k appreciation (10.0% local appreciation)).
- Niagara County population projected at -19% by 2050 — secular population decline; favor cash flow + early exit over multi-decade hold.
- At projected returns (10.0% appreciation + 8.0% rent growth), your $35k cash investment doubles in ~2 years — after that, you're playing with house money.
- By year 3, paydown + projected appreciation supports a ~$34k cash-out refi (75% LTV) — recoverable capital for the next deal without selling this one.
Negotiation context
- Only 11 days on market — expect competitive offers; lowballing is unlikely to land.
- 2 sale attempts since 17y ago with the ask held roughly flat each time — persistent listings suggest the price (not the market) is what's stuck; bring a comps-based counter.
- Current owner paid $38k; list at $125k implies a 229% gain — meaningful room to come down on a strong offer.
Risks & watch-outs
- Watch-outs: built in 1920 — expect roof / HVAC / electrical / plumbing capex.
Questions for the listing agent
- Can we see the unit-by-unit rent roll, current vacancy, and any below-market leases? What's the average tenancy length?
- What capital expenditures (roof, boiler, parking lot, exteriors) have been made in the last 5 years, and what's planned in the next 2?
- Built in 1920 — when were the roof, HVAC, electrical panel, plumbing, and water heater last replaced?
- Is there a deadline driving the sale (1031 exchange, divorce, estate, relocation)? That informs how much negotiation room exists.
- Schools are F-rated, which usually means shorter tenancies and higher turnover. Who's the typical renter profile here, and what's been the actual vacancy rate?
- Crime grade is F in this area — have there been break-ins, vandalism, or insurance claims at this property in the last 3 years? What carrier currently insures it and at what premium?
- What's the average days-on-market for RENTAL listings here right now (not sales)? A rising rental-DOM trend means longer vacancies and softer asking-rent achievability than the comps imply.
- What's the recent tenant-quality profile in this submarket — average credit score on applications, eviction rate, late-payment / NSF rate, and stable-employment percentage? A property-management company in the area should have these aggregated.
- How much new apartment / multifamily construction is in the pipeline within 1–3 miles? Heavy new supply (>2% of stock underway) typically softens rents 12–24 months out; light construction supports rent growth.
Investment metrics
- 1% rule
- 2.03% ✓
- Cap rate
- 17.86%
- Cash-on-cash
- 41.30%
- DSCR
- 2.84
- GRM
- 4.1
CMA / ARV
- ARV (on-the-fly)
- $117,624
- Comps found
- 12
Show comp detail 12 sales within ~0.75 mi
| Address | Dist | Beds/Ba | Sqft | Sold | Price | $/sf | Match |
|---|---|---|---|---|---|---|---|
| 519 Tronolone Pl | 0.15mi | 4/3.0 (-1) | 2,000 (-1%) | 11mo | $142,500 | $71 | 73 |
| 541 20th St | 0.54mi | 5/2.0 | 1,917 (-6%) | 1mo | $112,000 | $58 | 65 |
| 417 18th St | 0.44mi | 6/2.0 (+1) | 2,080 (+3%) | 10mo | $166,000 | $80 | 62 |
| 1166 Haeberle Ave | 0.32mi | 4/2.0 (-1) | 1,932 (-5%) | 13mo | $110,000 | $57 | 61 |
| 2219 Walnut Ave | 0.66mi | 6/3.0 (+1) | 2,023 (-0%) | 4mo | $62,500 | $31 | 56 |
| 412 19th St | 0.46mi | 5/2.0 | 2,208 (+9%) | 12mo | $80,000 | $36 | 54 |
| 609 Elmwood Ave | 0.64mi | 4/2.0 (-1) | 2,221 (+10%) | 0mo | $190,800 | $86 | 49 |
| 123 6th St | 0.66mi | 5/2.0 | 2,198 (+8%) | 8mo | $230,000 | $105 | 48 |
| 423 Elmwood Ave | 0.70mi | 4/2.0 (-1) | 2,232 (+10%) | 3mo | $117,000 | $52 | 43 |
| 1023 15th St | 0.57mi | 5/4.0 | 2,304 (+14%) | 5mo | $190,000 | $82 | 39 |
| 1968 Cudaback Ave | 0.69mi | 4/3.0 (-1) | 1,848 (-9%) | 8mo | $20,000 | $11 | 37 |
| 445 Elmwood Ave | 0.67mi | 6/2.0 (+1) | 2,314 (+14%) | 9mo | $80,000 | $35 | 32 |
Match score weights: distance 35% · size 25% · config 20% · recency 20%. Top-matched comps best support the ARV.
Projected returns pro-forma
10.0% appreciation · 8.0% rent growth · sell at horizon
- IRR
- 59.7%
- Equity multiple
- 5.52×
- Total profit
- $158,080
- Equity at exit
- $112,520
- IRR
- 55.3%
- Equity multiple
- 13.54×
- Total profit
- $438,420
- Equity at exit
- $242,653
Cash invested: $34,972 (down + closing). Projections, not guarantees.
Landlord ↔ Tenant lean methodology
- Overall (STATE)
- 15 Strongly Tenant-Friendly
- State New York
- 15 Strongly Tenant-Friendly · D+10
- County
- — inherits STATE
- City
- — inherits STATE
ZIP-level market 14301
- Home prices YoY
- 6.2%
- Rents YoY
- 8.8%
- Active inventory
- 164
- Price-to-rent
- 8.2×
Monthly cashflow live
- Estimated rent
- $2,535 high interval (Pro) →
- Mortgage (P&I)
- −$655
- Tax from tax record
- −$92 /mo · $1,104/yr
- Insurance
- −$52
- HOA
- −$0
- Vacancy / Maint / Mgmt
- −$532
- Net cashflow
- $1,204
Break-even live
Sensitivity live
| Price | -10% $1,274 | -5% $1,239 | +0% $1,204 | +5% $1,168 | +10% $1,133 |
|---|---|---|---|---|---|
| Rent | -10% $1,003 | -5% $1,103 | +0% $1,204 | +5% $1,304 | +10% $1,404 |
| Rate | -1.0pp $1,267 | -0.5pp $1,235 | base $1,204 | +0.5pp $1,171 | +1.0pp $1,138 |
2-unit breakdown (identical units grouped — click to expand)
| Units | Beds | Baths | Est. rent |
|---|---|---|---|
| 2× units | 3.0 | 1 | $2,536 |
| #1 | 3.0 | 1 | $1,268 |
| #2 | 3.0 | 1 | $1,268 |
| Total (2 units) | $2,535 | ||
UW: 25.0% down · 7.5% · 30yr · 1.5% tax · 5.0% vac · 8.0% maint · 8.0% mgmt
Financing live
Cash to close
- Down payment
- $31,225
- Closing costs
- $3,747
- Reserves months
- —
- Total cash needed
- —
Loan-product check · same deal, 3 products live
Conventional
25% down · 7.5% · 30yr
- Down + closing
- —
- Monthly P&I
- —
- Monthly cashflow
- —
- DSCR
- —
- Eligible?
- —
Personal DTI + credit; lowest rate.
DSCR
20% down · 8.5% · 30yr
- Down + closing
- —
- Monthly P&I
- —
- Monthly cashflow
- —
- DSCR
- —
- Eligible?
- —
No personal income docs; deal must DSCR.
Hard money
10% down · 12.0% · 12mo
- Down + closing
- —
- Monthly P&I
- —
- Monthly cashflow
- —
- DSCR
- —
- Eligible?
- —
Short-term bridge; refi at stabilization.
Rent comps 1 comps
| Address | Beds | Baths | Sqft | Rent | $/sqft | DOM | Units | Dist |
|---|---|---|---|---|---|---|---|---|
| 2020 Forest Ave Niagara Falls, NY | 4.0 | 2.0 | 1600 | $1,500 | $0.94 | 19d | 1 | 0.75mi |
Listing history 5 events
-
2026-04-23status Pending
-
2026-04-12$124,900 Active
-
2009-10-02soldstatus $38,000
-
2009-09-28soldstatus $38,000
-
2009-06-08$39,900
ⓘ Source: listings_history table (triggers on properties + properties_extension) + one-shot
backfill from property_details.listing_events for pre-trigger history.
Tax reassessment forecast NY · Partial reset (capped growth)
- Current annual tax
- $1,104 · $92/mo
- Projected year-2 tax
- $1,607 · $134/mo
- Expected delta
- +$503/yr (+$42/mo · 45.6%)
ⓘ Screening estimate from a state-policy table — verify with the county assessor before closing.
Climate risk First Street
- Flood 1/10 Low FEMA zone X (unshaded) · 0% chance over 30 yrs
- Wildfire 1/10 Low
- Heat 2/10 Low 7 d/yr ≥94°F today · 15 d/yr by 30 yrs out
- Wind 1/10 Low
- Air quality 3/10 Moderate 2 unhealthy d/yr today · 3 by 30 yrs out
Nearby sold comps map
Loading sold comps map…
Walkable amenities ~0.75 mi
Loading nearby amenities…
Taxation est. · year 1
- Rental income
- $30,420
- − Mortgage interest
- −$6,996
- − Property taxes
- −$1,104
- − Insurance
- −$624
- − Repairs & maintenance
- −$2,434
- − Management
- −$2,434
- − Depreciation
- −$3,633
- Taxable income
- $13,195
- Est. tax owed @ 24.0%
- −$3,167
- After-tax cash flow
- $11,277/yr
For passive investors: Depreciation is non-cash, so a rental often shows a tax loss while cash-flowing — sheltering income. Rental losses are passive: they offset passive income freely, and up to $25,000/yr can offset ordinary (W-2) income if you actively participate and your MAGI is under $100k (phasing out to $0 by $150k); unused losses carry forward. On sale, claimed depreciation is recaptured at up to 25%, and gains may owe capital-gains tax (a 1031 exchange can defer both). Figures are a year-1 estimate at your 24.0% rate — not tax advice; consult a CPA.
Schools (NCES district)
- District
- Niagara Falls City School District
- NCES district ID
- 3620820
- Math proficiency
- 26% ▼ -10.00%
- Reading proficiency
- 34% ▲ 3.00%
- Median HH income
- $32,488
- Composite
- 24.5/100
- National rank
- #7655
- State rank
- #578 of 590 in NY
Livability — Niagara Falls
- Score
- 60/100
- State rank
- #956
- US rank
- #18749
Category grades
Schools grade is shown separately in the Schools card above.
Census & demographics
- Census place
- Niagara Falls, NY
- County
- Niagara County · 157,377 people
- City population
- 62,983
- Metro
- Buffalo-Cheektowaga, NY
- Population (ZIP)
- 10,923
- Household income
- $34,549
- Rent vs Own
- Severe rent burden
- 954.0
Population outlook (Niagara County) Hauer SSP2
- Today (2025)
- 204,149 people
- By 2030
- 197,900 · -3.1%
- By 2040
- 182,239 · -10.7%
- By 2050
- 165,198 · -19.1%
- By 2075
- 129,416 · -36.6%
- By 2100
- 96,222 · -52.9%
Race, ethnicity, and origin ACS 2023
- Neighborhood character
- Diverse neighborhood (Simpson 0.58)
- Race & ethnicity
- White 59% Black 25% Two or more races 8% Hispanic / Latino 8% Asian 2%
- Hispanic origin (detail)
- Puerto Rican 3% Cuban 2%
- Common ancestry
- Romanian 6% Slovak 2% Lithuanian 1%
- Foreign-born
- 5% · Canada, China, Dominican Republic
- Languages at home
- 90% English-only · Spanish 6% Other Indo-European 3% Chinese 1%
Political lean MEDSL · Niagara
- 2024 margin
- R (+14.9) · D 42.5% · R 57.5%
- 2008→2024 swing
- -15.9pp toward R · 2008: 1.0pp · 2024: -14.9pp
- All cycles
- 2024: R+14.9 2020: R+9.7 2016: R+19.0 2012: D+0.6 2008: D+1.0
Not yet ingested
- Civics
- —
Market trends
- HPI YoY
- ▲ 15.41%
- Current HPI
- 266.1457
- Rent YoY
- ▲ 8.79%
- Metro
- Buffalo-Cheektowaga, NY
- State GDP YoY
- ▲ 2.60%
- F500 in state
- 92
Industry mix (Fortune 500 HQ in NY)
| Industry | F500 HQs | Revenue |
|---|---|---|
| Financial Services | 10 | $950B |
|
||
| Consumer Goods | 9 | $162B |
|
||
| Insurance | 4 | $225B |
|
||
| Telecommunications | 2 | $144B |
|
||
| Pharmaceuticals | 2 | $112B |
|
||
| Media / Entertainment | 2 | $69B |
|
||
Price history
+213.0% since first listed5 events — show timeline
- 2026-04-23 Pending — WNYREIS
- 2026-04-12 Listed $124,900 WNYREIS
- 2009-10-02 Sold (Public Records) $38,000 Public Records
- 2009-09-28 Sold (MLS) $38,000 WNYREIS
- 2009-06-08 Listed $39,900 WNYREIS
Property tax history
+6.7%/yrLatest (2025): $1,104 · +40.4% YoY. Source: county tax records.
Cash-flow waterfall
monthlySold comps — $/sqft
last 12 mo · ≤1 miLoading sold comps…