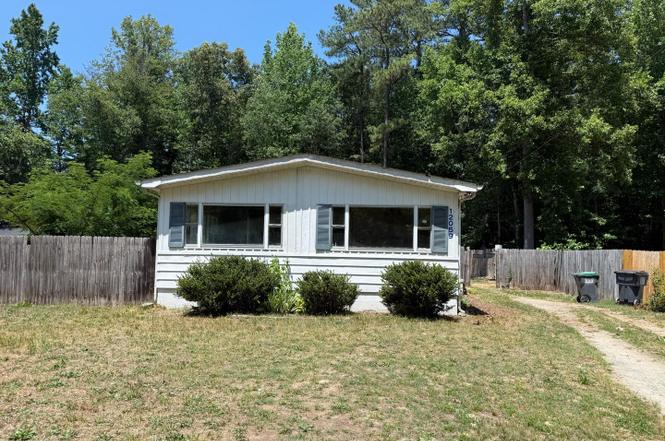
12059 Red Pine Rd · Ashland, VA
Flood risk 1/10 · Minimal
- FEMA flood zone
- X (unshaded)
- Chance of flooding over 30 yrs
- 0.0%
- Est. flood insurance / yr
- $473 – $860
Fire risk 4/10 · Minor
- Est. fire insurance / yr
- $666 – $1,236
Heat risk 8/10 · Major
- Hot days now (above 105°F)
- 7 days/yr
- Hot days in 30 yrs
- 17 days/yr
Wind risk 5/10 · Moderate
- Chance of severe wind over 30 yrs
- 23.0%
Air-quality risk 1/10 · Minimal
- Unhealthy air days now
- 0 days/yr
- Unhealthy air days in 30 yrs
- 0 days/yr
Risk factors via First Street. Map © Google.
Why this score? — see what drove the B grade
The composite is a weighted blend of 9 inputs, each scored 0–100. Each bar is that input's sub-score; the figure is the points it added to the 100-point composite (weight × sub-score).
- Cash flow +30.0/30.0
- 1% rule +10.0/10.0
- DSCR +10.0/10.0
- ARV discount +7.5/15.0
- Schools +4.4/10.0
- Livability +4.0/5.0
- Rent growth +2.5/5.0
- Condition / age +2.5/5.0
- Appreciation +0.0/10.0
$150,000
🖨 Deal sheet 📄 Offer letter ✓ Due diligence
Listing remarks MLS
Best Deal in the County, Great Deal, Ready 4 New Owner. 3 bedroom-2 full baths, nice flat yard. Some TLC is needed to make this home shine. Contact me to view and more info.
Key facts
- Built 1971
- Listed 4 days
Property features AI
Finance
- Other: Ownership is fee simple; Year built reported as estimated
- HOA & community: HOA fee $100 monthly
Exterior
- Parking: Driveway parking
- Utilities: Public water; On-site septic system; Electric power and heating fuel
- Home design: Manufactured home; Above-grade living space reported as 1,344 finished square feet (assessor)
- Construction: Concrete and modular/manufactured construction; Crawl space foundation; Architectural shingle roof; Other structures both above grade and below grade
- Exterior features: Driveway; Tidal water not present; Ground rent paid annually
Interior
- Bedrooms: Three bedrooms on the main level
- Bathrooms: Two full bathrooms (both on the main level)
- Heating & cooling: Heat pump with electric backup; Central air conditioning; Electric hot water
- Interior features: No basement; Finished living area reported by assessor
Neighborhood map
What this means for you Summary
Snapshot
- This is a 3-bed/2.5-bath single-family listed at $150k.
Deal economics
- At list price, monthly cash flow is $836 ($10k/yr) — positive.
- The deal already cash-flows at list — no discount required.
- Meets the 1% rule at list price ($2k rent vs $150k).
- Cap rate 13.0% vs local median 1.5% in Ashland — top-decile yield for the area; either an underpriced asset or a hidden risk that comps aren't pricing in. Stress-test before assuming the spread holds.
Location & tenants
- Location reads 79/100 on livability (#67 in VA, #2,152 nationally) — a middle-class / working-renter tenant base. Strengths: amenities A+, cost of living A+, housing A+; Watch: crime F, commute F.
- Caroline County Public School District (rural): math 39% / reading 62% proficiency, ranked #95 of 131 in VA (top 72%) — acceptable for families but not a draw, mixed tenant base, ~2y average lease.
- Market conditions: 273 active listings in the ZIP; solid renter incomes; 318 units permitted in Caroline County in 2024 (0 in 5+ unit buildings).
- This rent runs 32% of the median local income ($89k/yr) — at the standard rent-burdened threshold; future hikes will face affordability resistance.
Forward outlook
- Local home prices are declining (-3.0%/yr); year-one equity from $1k of loan paydown is wiped out by about $4k of value loss. Plan a longer hold.
- Caroline County population projected at +8% by 2050 — modest demand growth; plan on rents tracking national, not racing it.
- At projected returns (-3.0% appreciation + 3.0% rent growth), your $42k cash investment doubles in ~6 years — after that, you're playing with house money.
Negotiation context
- Only 4 days on market — expect competitive offers; lowballing is unlikely to land.
- 15 sale attempts since 26y ago with the ask held roughly flat each time — persistent listings suggest the price (not the market) is what's stuck; bring a comps-based counter.
- Current owner paid $55k; list at $150k implies a 173% gain — meaningful room to come down on a strong offer.
Risks & watch-outs
- Climate carrying-cost: moderate wind risk, 23% chance of damaging wind over 30y; extreme-heat days projected 7→17/yr by 2055 (HVAC capex compounding) — expect insurance premiums to compound above CPI over the hold.
Questions for the listing agent
- Built in 1971 — when were the roof, HVAC, electrical panel, plumbing, and water heater last replaced?
- What does the HOA fee cover, when was the last increase, and are there any pending special assessments or reserve-fund shortfalls?
- Is there a deadline driving the sale (1031 exchange, divorce, estate, relocation)? That informs how much negotiation room exists.
- Schools are B-rated — typically a magnet for longer-tenancy family renters. What's the average tenant stay here, and is there a school-zone premium baked into asking?
- Crime grade is F in this area — have there been break-ins, vandalism, or insurance claims at this property in the last 3 years? What carrier currently insures it and at what premium?
- What's the average days-on-market for RENTAL listings here right now (not sales)? A rising rental-DOM trend means longer vacancies and softer asking-rent achievability than the comps imply.
- What's the recent tenant-quality profile in this submarket — average credit score on applications, eviction rate, late-payment / NSF rate, and stable-employment percentage? A property-management company in the area should have these aggregated.
- How much new for-sale + rental construction is in the pipeline within 1–3 miles? Heavy new supply typically softens prices + rents 12–24 months out; constrained supply supports both.
Investment metrics
- 1% rule
- 1.57% ✓
- Cap rate
- 12.98%
- Cash-on-cash
- 23.89%
- DSCR
- 2.06
- GRM
- 5.3
CMA / ARV
- ARV (on-the-fly)
- $330,624
- Comps found
- 11
Show comp detail 11 sales within ~0.75 mi
| Address | Dist | Beds/Ba | Sqft | Sold | Price | $/sf | Match |
|---|---|---|---|---|---|---|---|
| 12078 Red Pine Rd | 0.07mi | 3/2.0 | 1,354 (+1%) | 22mo | $320,000 | $236 | 75 |
| 12136 Monterey Rd | 0.17mi | 3/2.0 | 1,320 (-2%) | 18mo | $325,000 | $246 | 72 |
| 26400 Dejarnette Ln | 0.32mi | 3/2.0 | 1,326 (-1%) | 16mo | $350,000 | $264 | 68 |
| 11441 Ponderosa Ln | 0.57mi | 3/2.0 | 1,360 (+1%) | 4mo | $355,000 | $261 | 66 |
| 12126 Longleaf Rd | 0.18mi | 3/2.0 | 1,472 (+10%) | 12mo | $405,000 | $275 | 64 |
| 26236 Shannon Mill Dr | 0.64mi | 3/2.0 | 1,296 (-4%) | 2mo | $310,000 | $239 | 60 |
| 27314 Summer Dr | 0.48mi | 3/2.0 | 1,472 (+10%) | 3mo | $365,000 | $248 | 57 |
| 26855 Slash Pine Cir | 0.34mi | 3/2.0 | 1,496 (+11%) | 9mo | $340,000 | $227 | 56 |
| 12120 Loblolly Rd | 0.10mi | 3/2.0 | 1,176 (-12%) | 21mo | $289,900 | $247 | 55 |
| 12213 Tennis Ln | 0.57mi | 3/2.0 | 1,472 (+10%) | 21mo | $340,000 | $231 | 38 |
| 26257 Austrian Dr | 0.65mi | 3/2.5 | 1,500 (+12%) | 21mo | $290,000 | $193 | 32 |
Match score weights: distance 35% · size 25% · config 20% · recency 20%. Top-matched comps best support the ARV.
Projected returns pro-forma
-3.0% appreciation · 3.0% rent growth · sell at horizon
- IRR
- 17.1%
- Equity multiple
- 1.69×
- Total profit
- $28,979
- Equity at exit
- $22,365
- IRR
- 25.6%
- Equity multiple
- 3.24×
- Total profit
- $93,926
- Equity at exit
- $12,969
Cash invested: $42,000 (down + closing). Projections, not guarantees.
Landlord ↔ Tenant lean methodology
- Overall (STATE)
- 55 Moderately Landlord-Leaning
- State Virginia
- 55 Moderately Landlord-Leaning · D+2
- County
- — inherits STATE
- City
- — inherits STATE
ZIP-level market 22546
- Home prices YoY
- -2.9%
- Active inventory
- 273
- Price-to-rent
- 5.3×
Monthly cashflow live
- Estimated rent
- $2,355 medium interval (Pro) →
- Mortgage (P&I)
- −$787
- Tax from tax record
- −$75 /mo · $901/yr
- Insurance
- −$62
- HOA
- −$100
- Vacancy / Maint / Mgmt
- −$495
- Net cashflow
- $836
Break-even live
UW: 25.0% down · 7.5% · 30yr · 1.5% tax · 5.0% vac · 8.0% maint · 8.0% mgmt
Financing live
Cash to close
- Down payment
- $37,500
- Closing costs
- $4,500
- Reserves months
- —
- Total cash needed
- —
Loan-product check · same deal, 3 products live
Conventional
25% down · 7.5% · 30yr
- Down + closing
- —
- Monthly P&I
- —
- Monthly cashflow
- —
- DSCR
- —
- Eligible?
- —
Personal DTI + credit; lowest rate.
DSCR
20% down · 8.5% · 30yr
- Down + closing
- —
- Monthly P&I
- —
- Monthly cashflow
- —
- DSCR
- —
- Eligible?
- —
No personal income docs; deal must DSCR.
Hard money
10% down · 12.0% · 12mo
- Down + closing
- —
- Monthly P&I
- —
- Monthly cashflow
- —
- DSCR
- —
- Eligible?
- —
Short-term bridge; refi at stabilization.
HOA detail
- Monthly dues
- $100 · $1,200/yr
Listing history 5 events
-
2026-06-18days on market $150,000 Active 4 DOM
-
2026-06-17days on market $150,000 Active 3 DOM
-
2026-06-16days on market $150,000 Active 2 DOM
-
2026-06-15remarks 648-char remark
-
2026-06-15$150,000 Active 1 DOM
ⓘ Source: listings_history table (triggers on properties + properties_extension) + one-shot
backfill from property_details.listing_events for pre-trigger history.
Tax reassessment forecast VA · Resets to sale price
- Current annual tax
- $901 · $75/mo
- Projected year-2 tax
- $1,230 · $102/mo
- Expected delta
- +$329/yr (+$27/mo · 36.5%)
ⓘ Screening estimate from a state-policy table — verify with the county assessor before closing.
Climate risk First Street
- Flood 1/10 Low FEMA zone X (unshaded) · 0% chance over 30 yrs
- Wildfire 4/10 Moderate
- Heat 8/10 Severe 7 d/yr ≥105°F today · 17 d/yr by 30 yrs out
- Wind 5/10 Major 23% chance of damaging wind over 30 yrs
- Air quality 1/10 Low 0 unhealthy d/yr today · 0 by 30 yrs out
Nearby sold comps map
Loading sold comps map…
Walkable amenities ~0.75 mi
Loading nearby amenities…
Taxation est. · year 1
- Rental income
- $28,259
- − Mortgage interest
- −$8,402
- − Property taxes
- −$901
- − Insurance
- −$750
- − Repairs & maintenance
- −$2,261
- − Management
- −$2,261
- − HOA
- −$1,200
- − Depreciation
- −$4,364
- Taxable income
- $8,121
- Est. tax owed @ 24.0%
- −$1,949
- After-tax cash flow
- $8,085/yr
For passive investors: Depreciation is non-cash, so a rental often shows a tax loss while cash-flowing — sheltering income. Rental losses are passive: they offset passive income freely, and up to $25,000/yr can offset ordinary (W-2) income if you actively participate and your MAGI is under $100k (phasing out to $0 by $150k); unused losses carry forward. On sale, claimed depreciation is recaptured at up to 25%, and gains may owe capital-gains tax (a 1031 exchange can defer both). Figures are a year-1 estimate at your 24.0% rate — not tax advice; consult a CPA.
Schools (NCES district)
- District
- Caroline County Public School District
- NCES district ID
- 5100660
- Math proficiency
- 39% ▼ -36.00%
- Reading proficiency
- 62% ▼ -10.00%
- Median HH income
- $58,075
- Composite
- 43.88/100
- National rank
- #2920
- State rank
- #95 of 131 in VA
Livability — Ashland
- Score
- 79/100
- State rank
- #67
- US rank
- #2152
Category grades
Schools grade is shown separately in the Schools card above.
Census & demographics
- County
- Caroline County · 18,392 people
- City population
- 19,987
- Metro
- nan
- Population (ZIP)
- 18,392
- Household income
- $89,247
- Rent vs Own
- Severe rent burden
- 192.0
Population outlook (Caroline County) Hauer SSP2
- Today (2025)
- 32,136 people
- By 2030
- 32,973 · +2.6%
- By 2040
- 34,255 · +6.6%
- By 2050
- 34,843 · +8.4%
- By 2075
- 35,134 · +9.3%
- By 2100
- 32,184 · +0.1%
Race, ethnicity, and origin ACS 2023
- Neighborhood character
- Diverse neighborhood (Simpson 0.58)
- Race & ethnicity
- White 58% Black 27% Hispanic / Latino 8% Two or more races 6% Asian 1%
- Hispanic origin (detail)
- Mexican 2%
- Common ancestry
- Lithuanian 4% Italian 2% Romanian 1%
- Foreign-born
- 5% · Canada, South Korea
- Languages at home
- 91% English-only · Spanish 7% Other Indo-European 1%
Political lean MEDSL · Caroline
- 2024 margin
- Lean R (+8.8) · D 45.1% · R 53.9% · Other 1.1%
- 2008→2024 swing
- -20.8pp toward R · 2008: 12.0pp · 2024: -8.8pp
- All cycles
- 2024: R+8.8 2020: R+4.2 2016: R+5.1 2012: D+8.2 2008: D+12.0
Not yet ingested
- Civics
- —
Market trends
- HPI YoY
- ▼ -10.95%
- Current HPI
- 362.5582
- Rent YoY
- —
- Metro
- nan
- State GDP YoY
- ▲ 2.40%
- F500 in state
- 50
Industry mix (Fortune 500 HQ in VA)
| Industry | F500 HQs | Revenue |
|---|---|---|
| Aerospace / Defense | 4 | $236B |
|
||
| Technology / Defense | 3 | $32B |
|
||
| Financial Services | 2 | $176B |
|
||
| Utilities | 2 | $27B |
|
||
| Insurance | 2 | $25B |
|
||
| Technology | 2 | $15B |
|
||
Price history
+200.0% since first listed50 events — show timeline
- 2026-06-14 Listed $150,000 BRIGHT MLS
- 2018-03-26 Sold (Public Records) $55,000 Public Records
- 2018-03-22 Sold (MLS) $55,000 MRIS
- 2018-03-22 Sold (MLS) $55,000 BRIGHT MLS
- 2018-03-11 Pending — BRIGHT MLS
- 2018-03-11 Pending — MRIS
- 2018-02-20 Price Changed $60,000 BRIGHT MLS
- 2018-02-20 Price Changed $60,000 MRIS
- 2018-02-15 Price Changed $77,000 MRIS
- 2018-02-03 Price Changed $78,000 MRIS
- 2018-01-13 Price Changed $79,500 MRIS
- 2018-01-12 Price Changed $80,000 MRIS
- 2017-10-27 Price Changed $74,900 MRIS
- 2017-08-21 Listed $80,000 MRIS
- 2017-08-21 Listed $80,000 BRIGHT MLS
- 2016-11-18 Listing Removed — BRIGHT MLS
- 2016-11-16 Sold (MLS) $27,000 MRIS
- 2016-11-16 Sold (MLS) $27,000 BRIGHT MLS
- 2016-10-31 Pending — MRIS
- 2016-09-29 Price Changed $39,900 MRIS
- 2016-09-28 Price Changed $44,900 MRIS
- 2016-08-16 Price Changed $49,900 MRIS
- 2016-07-12 Listed $59,900 MRIS
- 2016-07-12 Listed $39,900 BRIGHT MLS
- 2006-06-15 Delisted — MRIS
- 2006-03-07 Listed — MRIS
- 2005-11-25 Delisted — MRIS
- 2005-10-24 Listed — MRIS
- 2005-07-30 Delisted — MRIS
- 2005-07-13 Listed — MRIS
- 2004-03-29 Sold (MLS) $80,000 MRIS
- 2004-03-25 Sold (Public Records) $80,000 Public Records
- 2004-01-10 Delisted — MRIS
- 2003-11-17 Listed $89,950 MRIS
- 2003-10-30 Delisted — MRIS
- 2003-06-30 Listing Removed — CVRMLS
- 2003-03-11 Listing Removed — CVRMLS
- 2003-03-08 Listed — MRIS
- 2003-03-03 Listed $95,000 CVRMLS
- 2003-03-03 Listed $95,000 CVRMLS
- 2002-03-26 Sold (Public Records) $75,000 Public Records
- 2002-03-26 Sold (MLS) $75,000 MRIS
- 2002-03-26 Sold (MLS) $75,000 CVRMLS
- 2002-02-28 Delisted — MRIS
- 2001-11-13 Listed $79,950 MRIS
- 2001-11-13 Listed $85,000 CVRMLS
- 2001-06-27 Sold (MLS) $39,000 MRIS
- 2001-05-23 Delisted — MRIS
- 2000-05-11 Listed $38,400 MRIS
- 1993-06-01 Sold (Public Records) $50,000 Public Records
Property tax history
+3.6%/yrLatest (2025): $901 · +19.1% YoY. Source: county tax records.
Cash-flow waterfall
monthlySold comps — $/sqft
last 12 mo · ≤1 miLoading sold comps…