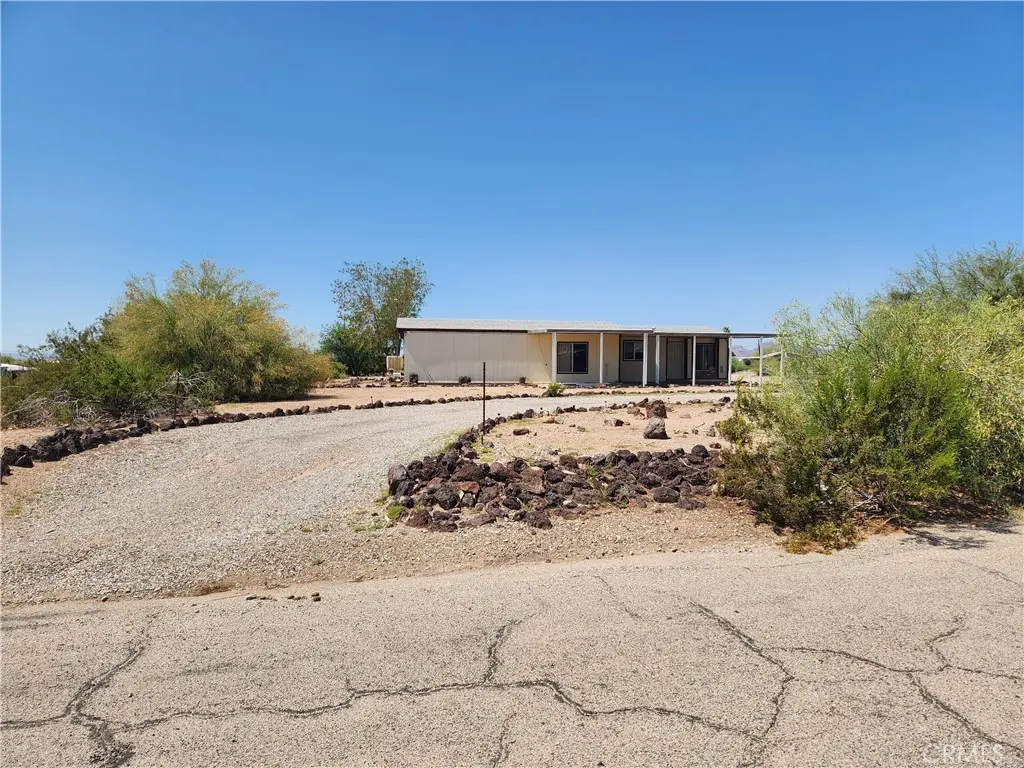
149825 Pahaska Ct · Big River, CA
Flood risk 1/10 · Minimal
- FEMA flood zone
- D
- Chance of flooding over 30 yrs
- 0.0%
- Est. flood insurance / yr
- $544 – $1,084
Fire risk 4/10 · Minor
- Est. fire insurance / yr
- $659 – $1,223
Heat risk 10/10 · Severe
- Hot days now (above 117°F)
- 7 days/yr
- Hot days in 30 yrs
- 18 days/yr
Wind risk 1/10 · Minimal
- Chance of severe wind over 30 yrs
- —
Air-quality risk 1/10 · Minimal
- Unhealthy air days now
- 0 days/yr
- Unhealthy air days in 30 yrs
- 0 days/yr
Risk factors via First Street. Map © Google.
Why this score? — see what drove the B+ grade
The composite is a weighted blend of 9 inputs, each scored 0–100. Each bar is that input's sub-score; the figure is the points it added to the 100-point composite (weight × sub-score).
- Cash flow +30.0/30.0
- 1% rule +10.0/10.0
- DSCR +10.0/10.0
- Appreciation +8.6/10.0
- ARV discount +7.5/15.0
- Livability +3.4/5.0
- Rent growth +2.5/5.0
- Schools +2.3/10.0
- Condition / age +2.2/5.0
$65,000
🖨 Deal sheet 📄 Offer letter ✓ Due diligence
Listing remarks MLS
Good Bones but needs some TLC such as flooring, painting, etc. Brand new water pump system, new a/c unit. An In Ground Spa on covered patio. It has a 3 car garage for all your toys. Lots of parking. Nice circular driveway. It is on a cul-de-sac for more privacy.
Key facts
- 0.5 acre lot
- 3 garage spots
- Built 1979
Neighborhood map
What this means for you Summary
Snapshot
- This is a 2-bed/2.0-bath manufactured listed at $65k. Condition is rated fair.
Deal economics
- At list price, monthly cash flow is $768 ($9k/yr) — positive.
- The deal already cash-flows at list — no discount required.
- Meets the 1% rule at list price ($1k rent vs $65k).
- Recommended offer: $57k (12.0% below list) — sets the bar for market timing.
Location & tenants
- Location reads 67/100 on livability (#327 in CA) — a middle-class / working-renter tenant base. Strengths: cost of living A+, housing A+, crime B; Watch: health & safety C-, employment D, schools F.
- Needles Unified (town): math 22% / reading 28% proficiency, ranked #1,194 of 1,400 in CA (top 85%) — low school quality limits family demand, transient renter base, plan for 1-2y turnover; 68% free/reduced lunch — lower-income household profile, screen leases tightly.
- Market conditions: 33 active listings in the ZIP; 5,458 units permitted in San Bernardino County in 2024 (1,500 in 5+ unit buildings).
Forward outlook
- In year one you build about $5k of equity ($449 loan paydown + $5k appreciation (7.3% local appreciation)).
- San Bernardino County population projected at +15% by 2050 — modest demand growth; plan on rents tracking national, not racing it.
- At projected returns (7.3% appreciation + 3.0% rent growth), your $18k cash investment doubles in ~2 years — after that, you're playing with house money.
- By year 7, paydown + projected appreciation supports a ~$35k cash-out refi (75% LTV) — recoverable capital for the next deal without selling this one.
Negotiation context
- It's been on market 367 days — a 12% lower offer ($57k) is reasonable based on typical stale-listing flexibility.
Risks & watch-outs
- Climate carrying-cost: extreme-heat days projected 7→18/yr by 2055 (HVAC capex compounding) — expect insurance premiums to compound above CPI over the hold.
Questions for the listing agent
- It's been on market 367 days. Have you received any prior offers? Is the seller open to a 12% concession, seller financing, or rate buy-down credit?
- Have any recent inspections been done? Can we get a copy of the seller's disclosures and any deferred-maintenance estimates?
- Built in 1979 — when were the roof, HVAC, electrical panel, plumbing, and water heater last replaced?
- Why hasn't it sold? Are there any deal-killer items the seller is aware of (foundation, flood, title, zoning, code violations)?
- Is there a deadline driving the sale (1031 exchange, divorce, estate, relocation)? That informs how much negotiation room exists.
- Schools are F-rated, which usually means shorter tenancies and higher turnover. Who's the typical renter profile here, and what's been the actual vacancy rate?
- What's the average days-on-market for RENTAL listings here right now (not sales)? A rising rental-DOM trend means longer vacancies and softer asking-rent achievability than the comps imply.
- What's the recent tenant-quality profile in this submarket — average credit score on applications, eviction rate, late-payment / NSF rate, and stable-employment percentage? A property-management company in the area should have these aggregated.
- How much new for-sale + rental construction is in the pipeline within 1–3 miles? Heavy new supply typically softens prices + rents 12–24 months out; constrained supply supports both.
Investment metrics
- 1% rule
- 2.24% ✓
- Cap rate
- 20.47%
- Cash-on-cash
- 50.63%
- DSCR
- 3.25
- GRM
- 3.7
CMA / ARV
- ARV (median comp)
- $220,000
- List price
- $65,000
- Delta
- -70.45%
- Verdict
- UNDERPRICED
- Comps
- 2 within 1.0 mi
Show comp detail 1 sale within ~0.75 mi
| Address | Dist | Beds/Ba | Sqft | Sold | Price | $/sf | Match |
|---|---|---|---|---|---|---|---|
| 150217 Bluewater | 0.57mi | 3/2.0 (+1) | 1,716 (-5%) | 4mo | $280,000 | $163 | 57 |
Match score weights: distance 35% · size 25% · config 20% · recency 20%. Top-matched comps best support the ARV.
Projected returns pro-forma
7.26% appreciation · 3.0% rent growth · sell at horizon
- IRR
- 60.9%
- Equity multiple
- 4.99×
- Total profit
- $72,623
- Equity at exit
- $46,143
- IRR
- 56.7%
- Equity multiple
- 10.58×
- Total profit
- $174,367
- Equity at exit
- $88,667
Cash invested: $18,200 (down + closing). Projections, not guarantees.
Landlord ↔ Tenant lean methodology
- Overall (STATE)
- 18 Strongly Tenant-Friendly
- State California
- 18 Strongly Tenant-Friendly · D+13
- County
- — inherits STATE
- City
- — inherits STATE
ZIP-level market 92242
- Home prices YoY
- 4.1%
- Active inventory
- 33
- Price-to-rent
- 3.7×
Monthly cashflow live
- Estimated rent
- $1,455 medium interval (Pro) →
- Mortgage (P&I)
- −$341
- Tax from tax record
- −$14 /mo · $163/yr
- Insurance
- −$27
- HOA
- −$0
- Vacancy / Maint / Mgmt
- −$306
- Net cashflow
- $768
Break-even live
UW: 25.0% down · 7.5% · 30yr · 1.5% tax · 5.0% vac · 8.0% maint · 8.0% mgmt
Financing live
Cash to close
- Down payment
- $16,250
- Closing costs
- $1,950
- Reserves months
- —
- Total cash needed
- —
Loan-product check · same deal, 3 products live
Conventional
25% down · 7.5% · 30yr
- Down + closing
- —
- Monthly P&I
- —
- Monthly cashflow
- —
- DSCR
- —
- Eligible?
- —
Personal DTI + credit; lowest rate.
DSCR
20% down · 8.5% · 30yr
- Down + closing
- —
- Monthly P&I
- —
- Monthly cashflow
- —
- DSCR
- —
- Eligible?
- —
No personal income docs; deal must DSCR.
Hard money
10% down · 12.0% · 12mo
- Down + closing
- —
- Monthly P&I
- —
- Monthly cashflow
- —
- DSCR
- —
- Eligible?
- —
Short-term bridge; refi at stabilization.
Listing history 9 events
-
2026-06-08days on market $65,000 Active 367 DOM
-
2026-06-07days on market $65,000 Active 366 DOM
-
2026-06-05days on market $65,000 Active 363 DOM
-
2026-06-02days on market $65,000 Active 361 DOM
-
2026-06-01days on market $65,000 Active 360 DOM
-
2026-05-31days on market $65,000 Active 359 DOM
-
2026-05-30days on market $65,000 Active 358 DOM
-
2026-01-13price $65,000 262-char remark
Show marketing remark (262 chars)
Good Bones but needs some TLC such as flooring, painting, etc. Brand new water pump system, new a/c unit. An In Ground Spa on covered patio. It has a 3 car garage for all your toys. Lots of parking. Nice circular driveway. It is on a cul-de-sac for more privacy.
-
2025-06-06$75,000 Active 262-char remark
Show marketing remark (262 chars)
Good Bones but needs some TLC such as flooring, painting, etc. Brand new water pump system, new a/c unit. An In Ground Spa on covered patio. It has a 3 car garage for all your toys. Lots of parking. Nice circular driveway. It is on a cul-de-sac for more privacy.
ⓘ Source: listings_history table (triggers on properties + properties_extension) + one-shot
backfill from property_details.listing_events for pre-trigger history.
Tax reassessment forecast CA · Resets to sale price
- Current annual tax
- $163 · $14/mo
- Projected year-2 tax
- $494 · $41/mo
- Expected delta
- +$331/yr (+$28/mo · 202.5%)
ⓘ Screening estimate from a state-policy table — verify with the county assessor before closing.
Climate risk First Street
- Flood 1/10 Low FEMA zone D · 0% chance over 30 yrs
- Wildfire 4/10 Moderate
- Heat 10/10 Extreme 7 d/yr ≥117°F today · 18 d/yr by 30 yrs out
- Wind 1/10 Low
- Air quality 1/10 Low 0 unhealthy d/yr today · 0 by 30 yrs out
Nearby sold comps map
Loading sold comps map…
Walkable amenities ~0.75 mi
Loading nearby amenities…
Taxation est. · year 1
- Rental income
- $17,461
- − Mortgage interest
- −$3,641
- − Property taxes
- −$163
- − Insurance
- −$325
- − Repairs & maintenance
- −$1,397
- − Management
- −$1,397
- − Depreciation
- −$1,891
- Taxable income
- $8,647
- Est. tax owed @ 24.0%
- −$2,075
- After-tax cash flow
- $7,140/yr
For passive investors: Depreciation is non-cash, so a rental often shows a tax loss while cash-flowing — sheltering income. Rental losses are passive: they offset passive income freely, and up to $25,000/yr can offset ordinary (W-2) income if you actively participate and your MAGI is under $100k (phasing out to $0 by $150k); unused losses carry forward. On sale, claimed depreciation is recaptured at up to 25%, and gains may owe capital-gains tax (a 1031 exchange can defer both). Figures are a year-1 estimate at your 24.0% rate — not tax advice; consult a CPA.
Condition & rehab AI · 12 photos
This manufactured home requires moderate repairs and maintenance to improve its condition and value. Key areas for improvement include the kitchen and bath, exterior siding, and landscaping. Painting and replacing cabinets would significantly enhance its resale and rental value.
Repairs flagged
- Major Exposed subfloor in kitchen and bath — Structural damage
- Major Missing cabinets in kitchen and bath — Aesthetic and functional issues
- Major Exposed plumbing in kitchen and bath — Safety hazard
- Moderate Weathered siding — Reduces curb appeal
- Major Exposed subfloor in exterior — Structural damage
- Major Exposed subfloor in interior walls — Structural damage
- Minor Overgrown vegetation — Reduces curb appeal
Value-add opportunities
- Resale Paint interior walls — Enhances curb appeal and interior aesthetics
- Resale Replace missing cabinets — Improves functionality and aesthetics
- Resale Fix exposed plumbing — Ensures safety and functionality
- Both Landscaping and curb appeal — Enhances curb appeal and property value
Renovation cost estimate screening
| Repair item | Severity | Est. cost |
|---|---|---|
| Exposed subfloor in kitchen and bath · Structural damage | Major | $15,000–50,000 |
| Missing cabinets in kitchen and bath · Aesthetic and functional issues | Major | $15,000–50,000 |
| Exposed plumbing in kitchen and bath · Safety hazard | Major | $15,000–50,000 |
| Weathered siding · Reduces curb appeal | Moderate | $3,000–15,000 |
| Exposed subfloor in exterior · Structural damage | Major | $15,000–50,000 |
| Exposed subfloor in interior walls · Structural damage | Major | $15,000–50,000 |
| Overgrown vegetation · Reduces curb appeal | Minor | $500–3,000 |
| Total estimated repair cost · 7 items | $78,500–268,000 |
Value-add ROI direction
- Resale Paint interior walls — Enhances curb appeal and interior aesthetics ↑
- Resale Replace missing cabinets — Improves functionality and aesthetics ↑
- Resale Fix exposed plumbing — Ensures safety and functionality ↑
- Both Landscaping and curb appeal — Enhances curb appeal and property value ↑
ⓘ Cost ranges are severity-bucket heuristics (US national rule-of-thumb). Get contractor quotes + a written scope before underwriting a rehab budget.
Schools (NCES district)
- District
- Needles Unified
- NCES district ID
- 0626760
- Math proficiency
- 22% ▼ -2.00%
- Reading proficiency
- 28% ▼ -1.00%
- Median HH income
- $31,795
- Composite
- 23.35/100
- National rank
- #13305
- State rank
- #1194 of 1400 in CA
Livability — Big River
- Score
- 67/100
- State rank
- #327
- US rank
- #11065
Category grades
Schools grade is shown separately in the Schools card above.
Census & demographics
- Census place
- Big River, CA
- Population (ZIP)
- 1,203
Population outlook (San Bernardino County) Hauer SSP2
- Today (2025)
- 2,300,329 people
- By 2030
- 2,378,907 · +3.4%
- By 2040
- 2,523,137 · +9.7%
- By 2050
- 2,642,388 · +14.9%
- By 2075
- 2,880,769 · +25.2%
- By 2100
- 2,909,436 · +26.5%
Race, ethnicity, and origin ACS 2023
- Neighborhood character
- Predominantly White (84%)
- Race & ethnicity
- White 84% Hispanic / Latino 12% Two or more races 9% Native American 2%
- Hispanic origin (detail)
- Mexican 10% Salvadoran 1%
- Common ancestry
- Romanian 5% Serbian 3% Lithuanian 3%
- Foreign-born
- 3% · Canada, Dominican Republic
- Languages at home
- 93% English-only · Spanish 6% German/W. Germanic 1%
Political lean MEDSL · San Bernardino
- 2024 margin
- Toss-up / Even · D 47.5% · R 49.7% · Other 2.8%
- 2008→2024 swing
- -8.5pp toward R · 2008: 6.3pp · 2024: -2.1pp
- All cycles
- 2024: R+2.1 2020: D+10.7 2016: D+9.8 2012: D+5.4 2008: D+6.3
Not yet ingested
- Civics
- —
Market trends
- HPI YoY
- ▲ 7.26%
- Current HPI
- 183.526
- Rent YoY
- —
- Metro
- —
- State GDP YoY
- ▲ 3.21%
- F500 in state
- 116
Industry mix (Fortune 500 HQ in CA)
| Industry | F500 HQs | Revenue |
|---|---|---|
| Technology | 27 | $1,492B |
|
||
| Financial Services | 3 | $174B |
|
||
| Retail | 3 | $44B |
|
||
| Insurance | 3 | $26B |
|
||
| Media / Entertainment | 2 | $115B |
|
||
| Pharmaceuticals / Biotech | 2 | $62B |
|
||
Price history
-13.3% since first listed2 events — show timeline
- 2026-01-13 Price Changed $65,000 CRMLS
- 2025-06-06 Listed $75,000 CRMLS
Property tax history
+5.8%/yrLatest (2025): $163 · -0.5% YoY. Source: county tax records.
Cash-flow waterfall
monthlySold comps — $/sqft
last 12 mo · ≤1 miLoading sold comps…