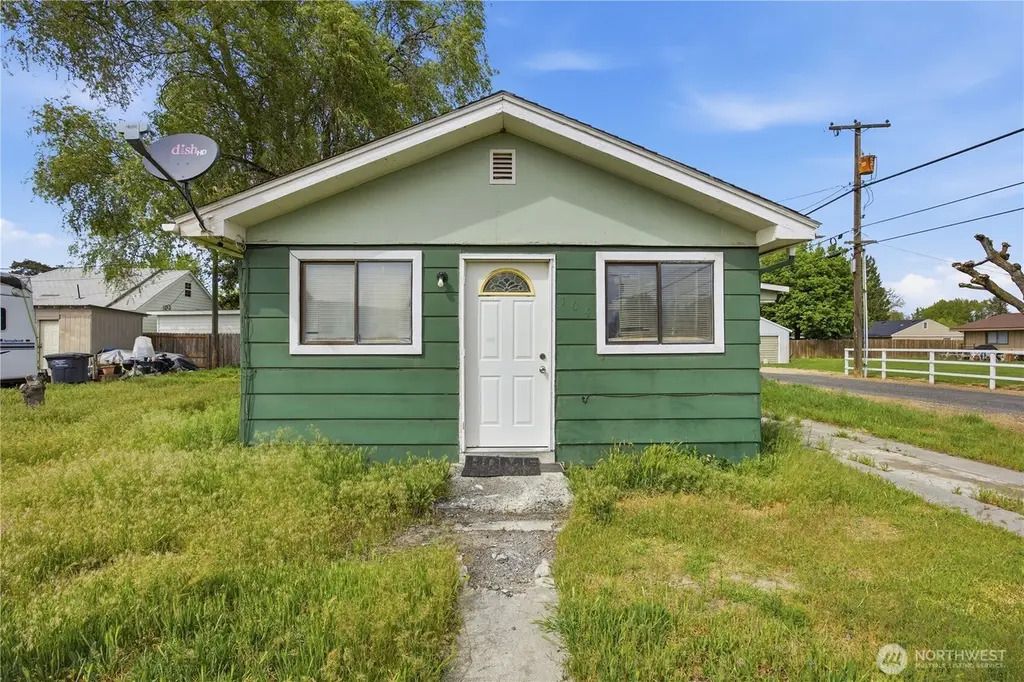
104 E 5th Ave · Warden, WA
Flood risk 1/10 · Minimal
- FEMA flood zone
- X (unshaded)
- Chance of flooding over 30 yrs
- 0.0%
- Est. flood insurance / yr
- $507 – $1,088
Fire risk 4/10 · Minor
- Est. fire insurance / yr
- $604 – $1,122
Heat risk 4/10 · Minor
- Hot days now (above 96°F)
- 7 days/yr
- Hot days in 30 yrs
- 15 days/yr
Wind risk 1/10 · Minimal
- Chance of severe wind over 30 yrs
- —
Air-quality risk 9/10 · Severe
- Unhealthy air days now
- 18 days/yr
- Unhealthy air days in 30 yrs
- 19 days/yr
Risk factors via First Street. Map © Google.
Why this score? — see what drove the A- grade
The composite is a weighted blend of 9 inputs, each scored 0–100. Each bar is that input's sub-score; the figure is the points it added to the 100-point composite (weight × sub-score).
- Cash flow +29.8/30.0
- ARV discount +15.0/15.0
- DSCR +10.0/10.0
- 1% rule +8.4/10.0
- Appreciation +5.5/10.0
- Schools +3.4/10.0
- Livability +3.2/5.0
- Rent growth +2.5/5.0
- Condition / age +2.5/5.0
$140,000
🖨 Deal sheet 📄 Offer letter ✓ Due diligence
Listing remarks
3 bedroom, 1 bath home in Warden downtown near schools, and shopping locations. Great investment opportunity or starter home, schedule a showing today!
Key facts
- 4,548 sq ft lot
- Built 1959
- Listed 8 days
Property features AI
Finance
- Other: Lot size approximately 0.1044 acres (per county records); Living area reported as 900 square feet (per county records)
- Financial info: Listing terms: Cash, Conventional, Rehab Loan
Exterior
- Parking: Driveway; Off-street parking
- Utilities: Public water (City of Warden); Sewer connected; Electric service (Grant County PUD)
- Home design: Single-family residence, one story; Built on lot; House structure
- Construction: Wood construction; Composition roof; Poured concrete foundation; Effective year built 1959
- Exterior features: Wood exterior; Wood products
Interior
- Kitchen: Stove/Range included
- Bedrooms: 3 bedrooms (all on the main level)
- Flooring: Concrete; Laminate; Vinyl
- Bathrooms: 1 full bathroom (on the main level)
- Heating & cooling: Wall furnace heating; Window air conditioning unit(s)
- Interior features: Water heater (electric, located in crawl space)
- Laundry & utility: Water heater in crawl space
Neighborhood map
What this means for you Summary
Snapshot
- This is a 4-bed/4.0-bath single-family listed at $140k.
Deal economics
- At list price, monthly cash flow is $516 ($6k/yr) — positive.
- The deal already cash-flows at list — no discount required.
- Meets the 1% rule at list price ($2k rent vs $140k).
Location & tenants
- Location reads 63/100 on livability (#382 in WA) — a middle-class / working-renter tenant base. Strengths: cost of living A+, housing A+, crime A-; Watch: health & safety C-, schools F, amenities F.
- Warden School District (town): math 30% / reading 44% proficiency, ranked #240 of 291 in WA (top 82%) — families likely to look elsewhere, expect single-tenant / working-renter base with shorter leases; 70% free/reduced lunch — lower-income household profile, screen leases tightly.
- Market conditions: 40 active listings in the ZIP; 559 units permitted in Grant County in 2024 (35 in 5+ unit buildings).
Forward outlook
- In year one you build about $2k of equity ($968 loan paydown + $1k appreciation (1.0% local appreciation)).
- Grant County population projected at +16% by 2050 — long-run rental-demand tailwind backs the buy-and-hold thesis.
- At projected returns (1.0% appreciation + 3.0% rent growth), your $39k cash investment doubles in ~5 years — after that, you're playing with house money.
Negotiation context
- Only 8 days on market — expect competitive offers; lowballing is unlikely to land.
- 3 sale attempts since 21y ago with the ask held roughly flat each time — persistent listings suggest the price (not the market) is what's stuck; bring a comps-based counter.
Risks & watch-outs
- Watch-outs: built in 1959 — expect roof / HVAC / electrical / plumbing capex.
Questions for the listing agent
- Built in 1959 — when were the roof, HVAC, electrical panel, plumbing, and water heater last replaced?
- Is there a deadline driving the sale (1031 exchange, divorce, estate, relocation)? That informs how much negotiation room exists.
- Schools are F-rated, which usually means shorter tenancies and higher turnover. Who's the typical renter profile here, and what's been the actual vacancy rate?
- What's the average days-on-market for RENTAL listings here right now (not sales)? A rising rental-DOM trend means longer vacancies and softer asking-rent achievability than the comps imply.
- What's the recent tenant-quality profile in this submarket — average credit score on applications, eviction rate, late-payment / NSF rate, and stable-employment percentage? A property-management company in the area should have these aggregated.
- How much new for-sale + rental construction is in the pipeline within 1–3 miles? Heavy new supply typically softens prices + rents 12–24 months out; constrained supply supports both.
Investment metrics
- 1% rule
- 1.34% ✓
- Cap rate
- 10.71%
- Cash-on-cash
- 15.79%
- DSCR
- 1.70
- GRM
- 6.2
CMA / ARV
- ARV (median comp)
- $252,991
- List price
- $140,000
- Delta
- -44.66%
- Verdict
- UNDERPRICED
- Comps
- 19 within 1.0 mi
Show comp detail 1 sale within ~0.75 mi
| Address | Dist | Beds/Ba | Sqft | Sold | Price | $/sf | Match |
|---|---|---|---|---|---|---|---|
| 113 E 6th St | 0.09mi | 5/2.0 (+1) | 3,440 (-6%) | 2mo | $290,000 | $84 | 72 |
Match score weights: distance 35% · size 25% · config 20% · recency 20%. Top-matched comps best support the ARV.
Projected returns pro-forma
1.01% appreciation · 3.0% rent growth · sell at horizon
- IRR
- 17.8%
- Equity multiple
- 1.91×
- Total profit
- $35,598
- Equity at exit
- $47,897
- IRR
- 21.0%
- Equity multiple
- 3.55×
- Total profit
- $99,828
- Equity at exit
- $63,730
Cash invested: $39,200 (down + closing). Projections, not guarantees.
Landlord ↔ Tenant lean methodology
- Overall (STATE)
- 28 Tenant-Leaning
- State Washington
- 28 Tenant-Leaning · D+8
- County
- — inherits STATE
- City
- — inherits STATE
ZIP-level market 98857
- Home prices YoY
- 0.5%
- Active inventory
- 40
- Price-to-rent
- 6.2×
Monthly cashflow live
- Estimated rent
- $1,877 medium interval (Pro) →
- Mortgage (P&I)
- −$734
- Tax from tax record
- −$175 /mo · $2,094/yr
- Insurance
- −$58
- HOA
- −$0
- Vacancy / Maint / Mgmt
- −$394
- Net cashflow
- $516
Break-even live
UW: 25.0% down · 7.5% · 30yr · 1.5% tax · 5.0% vac · 8.0% maint · 8.0% mgmt
Financing live
Cash to close
- Down payment
- $35,000
- Closing costs
- $4,200
- Reserves months
- —
- Total cash needed
- —
Loan-product check · same deal, 3 products live
Conventional
25% down · 7.5% · 30yr
- Down + closing
- —
- Monthly P&I
- —
- Monthly cashflow
- —
- DSCR
- —
- Eligible?
- —
Personal DTI + credit; lowest rate.
DSCR
20% down · 8.5% · 30yr
- Down + closing
- —
- Monthly P&I
- —
- Monthly cashflow
- —
- DSCR
- —
- Eligible?
- —
No personal income docs; deal must DSCR.
Hard money
10% down · 12.0% · 12mo
- Down + closing
- —
- Monthly P&I
- —
- Monthly cashflow
- —
- DSCR
- —
- Eligible?
- —
Short-term bridge; refi at stabilization.
Listing history 7 events
-
2026-05-08status Pending
-
2026-04-30$140,000 Active
-
2011-10-31soldstatus $125,000
-
2011-10-28soldstatus $125,000
-
2011-08-15$159,000
-
2005-12-26soldstatus $26,000
-
2005-08-23$29,950
ⓘ Source: listings_history table (triggers on properties + properties_extension) + one-shot
backfill from property_details.listing_events for pre-trigger history.
Tax reassessment forecast WA · Resets to sale price
- Current annual tax
- $2,094 · $175/mo
- Projected year-2 tax
- $2,094 · $175/mo
- Expected delta
- $0/yr ($0/mo · 0.0%)
ⓘ Screening estimate from a state-policy table — verify with the county assessor before closing.
Climate risk First Street
- Flood 1/10 Low FEMA zone X (unshaded) · 0% chance over 30 yrs
- Wildfire 4/10 Moderate
- Heat 4/10 Moderate 7 d/yr ≥96°F today · 15 d/yr by 30 yrs out
- Wind 1/10 Low
- Air quality 9/10 Extreme 18 unhealthy d/yr today · 19 by 30 yrs out
Nearby sold comps map
Loading sold comps map…
Walkable amenities ~0.75 mi
Loading nearby amenities…
Taxation est. · year 1
- Rental income
- $22,525
- − Mortgage interest
- −$7,842
- − Property taxes
- −$2,094
- − Insurance
- −$700
- − Repairs & maintenance
- −$1,802
- − Management
- −$1,802
- − Depreciation
- −$4,073
- Taxable income
- $4,212
- Est. tax owed @ 24.0%
- −$1,011
- After-tax cash flow
- $5,180/yr
For passive investors: Depreciation is non-cash, so a rental often shows a tax loss while cash-flowing — sheltering income. Rental losses are passive: they offset passive income freely, and up to $25,000/yr can offset ordinary (W-2) income if you actively participate and your MAGI is under $100k (phasing out to $0 by $150k); unused losses carry forward. On sale, claimed depreciation is recaptured at up to 25%, and gains may owe capital-gains tax (a 1031 exchange can defer both). Figures are a year-1 estimate at your 24.0% rate — not tax advice; consult a CPA.
Schools (NCES district)
- District
- Warden School District
- NCES district ID
- 5309510
- Math proficiency
- 30% ▼ -2.00%
- Reading proficiency
- 44% ▲ 5.00%
- Median HH income
- $43,852
- Composite
- 33.94/100
- National rank
- #10336
- State rank
- #240 of 291 in WA
Livability — Warden
- Score
- 63/100
- State rank
- #382
- US rank
- #15073
Category grades
Schools grade is shown separately in the Schools card above.
Census & demographics
- Census place
- Warden, WA
- Population (ZIP)
- 3,935
Population outlook (Grant County) Hauer SSP2
- Today (2025)
- 99,356 people
- By 2030
- 102,107 · +2.8%
- By 2040
- 108,318 · +9.0%
- By 2050
- 114,712 · +15.5%
- By 2075
- 131,376 · +32.2%
- By 2100
- 146,163 · +47.1%
Race, ethnicity, and origin ACS 2023
- Neighborhood character
- Majority Hispanic (54%)
- Race & ethnicity
- Hispanic / Latino 54% White 43% Two or more races 14% Asian 1%
- Hispanic origin (detail)
- Mexican 46%
- Common ancestry
- Portuguese 2% Slovak 1% Italian 1%
- Foreign-born
- 18% · Canada, South Korea
- Languages at home
- 57% English-only · Spanish 41% German/W. Germanic 1%
Political lean MEDSL · Grant
- 2024 margin
- Solid R (+37.5) · D 30.0% · R 67.4% · Other 2.6%
- 2008→2024 swing
- -9.9pp toward R · 2008: -27.5pp · 2024: -37.5pp
- All cycles
- 2024: R+37.5 2020: R+34.4 2016: R+37.9 2012: R+32.6 2008: R+27.5
Not yet ingested
- Civics
- —
Market trends
- HPI YoY
- ▲ 1.01%
- Current HPI
- 216.4192
- Rent YoY
- —
- Metro
- —
- State GDP YoY
- ▲ 4.65%
- F500 in state
- 22
Industry mix (Fortune 500 HQ in WA)
| Industry | F500 HQs | Revenue |
|---|---|---|
| Retail | 2 | $269B |
|
||
| Technology / Retail | 1 | $638B |
|
||
| Technology | 1 | $245B |
|
||
| Telecommunications | 1 | $38B |
|
||
| Food / Beverage | 1 | $36B |
|
||
| Automotive / Trucks | 1 | $34B |
|
||
Price history
+367.4% since first listed7 events — show timeline
- 2026-05-08 Pending — NWMLS as Distributed by MLS Grid
- 2026-04-30 Listed $140,000 NWMLS as Distributed by MLS Grid
- 2011-10-31 Sold (MLS) $125,000 NWMLS as Distributed by MLS Grid
- 2011-10-28 Sold (Public Records) $125,000 Public Records
- 2011-08-15 Listed $159,000 NWMLS as Distributed by MLS Grid
- 2005-12-26 Sold (MLS) $26,000 NWMLS as Distributed by MLS Grid
- 2005-08-23 Listed $29,950 NWMLS as Distributed by MLS Grid
Property tax history
+3.4%/yrLatest (2026): $2,094 · -5.6% YoY. Source: county tax records.
Cash-flow waterfall
monthlySold comps — $/sqft
last 12 mo · ≤1 miLoading sold comps…