 Triplex
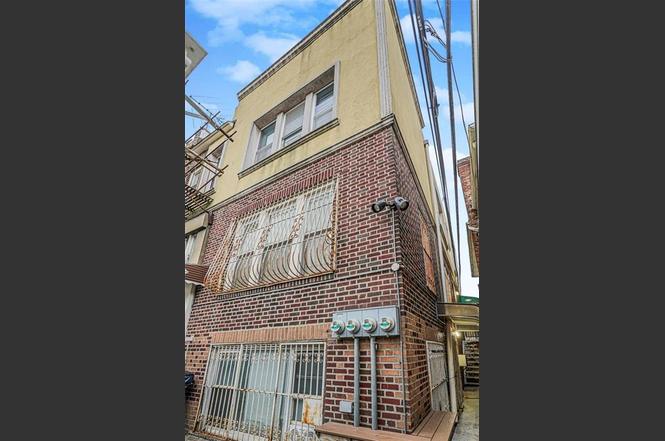
217 Brighton 1st Ln · New York, NY
Flood risk 6/10 · Moderate
- FEMA flood zone
- AE
- Chance of flooding over 30 yrs
- 0.57%
- Est. flood insurance / yr
- $1,737 – $8,500
Fire risk 1/10 · Minimal
- Est. fire insurance / yr
- $691 – $1,283
Heat risk 7/10 · Major
- Hot days now (above 97°F)
- 7 days/yr
- Hot days in 30 yrs
- 16 days/yr
Wind risk 6/10 · Moderate
- Chance of severe wind over 30 yrs
- 77.0%
Air-quality risk 4/10 · Minor
- Unhealthy air days now
- 5 days/yr
- Unhealthy air days in 30 yrs
- 7 days/yr
Risk factors via First Street. Map © Google.
Why this score? — see what drove the C+ grade
The composite is a weighted blend of 9 inputs, each scored 0–100. Each bar is that input's sub-score; the figure is the points it added to the 100-point composite (weight × sub-score).
- Cash flow +25.6/30.0
- DSCR +8.5/10.0
- ARV discount +7.8/15.0
- 1% rule +5.9/10.0
- Schools +5.0/10.0
- Rent growth +3.8/5.0
- Livability +3.8/5.0
- Condition / age +2.5/5.0
- Appreciation +0.0/10.0
$1,050,000
🖨 Deal sheet (PDF) 📄 Offer letter ✓ Due diligence
Multi-family units
County records classify this as Multi-Family (2-4 Unit). Listing-text estimate: 3 units. confirmed
Listing remarks MLS
BRIGHTON, NEAR OCEAN BEACH, SHOPPING & ALL TRANSPT, SEMI DET BRICK, 3 FAM HOUSE, 2 BDM OVER 2 BDM OVER 1 BDM, EXCELLENT CONDITION, TAKE ADVANTAGE OF THIS 3 FAM HOUSE, MOVE IN YOURSELF AND MAKE MONEY BY RENTING OUT
Key facts
- Properly maintained
- 3 family brick home
- Low property taxes
Tags
Property features AI
Finance
- Other: Lot number 78
- Financial info: Property configured as a 3-unit building; Unit 1 (level 1): 2-bedroom unit with 1 full bath, month-to-month status, projected rent $2,000; Unit 2 (level 2): 2-bedroom unit with 1 full bath, projected rent $2,500; Unit 3 (level 3): 3-bedroom unit with 1 full bath, month-to-month status, projected rent $2,700; Gross rent income noted (period 12): 7200; Financing options considered: exchange, bank mortgage, or cash
Exterior
- Parking: Street parking
- Utilities: Electric: circuit breakers; Hot water: gas; Heating fuel: gas
- Home design: Semi-detached building; Residential property
- Construction: Brick construction; Flat roof; Poured concrete foundation; Building footprint approximately 840 (dimensions 42.00 x 20.00)
- Exterior features: Partially fenced yard; Storage rooms in building
Interior
- Kitchen: Refrigerator; Stove
- Bedrooms: One bedroom on level 1; Two bedrooms on level 2; Three bedrooms on level 3
- Flooring: Ceramic floors; Hardwood floors
- Bathrooms: Three full bathrooms (one on each level)
- Heating & cooling: Gas hot water; Gas heating with steam/radiator delivery; Circuit breaker electric service
- Interior features: Refrigerator; Stove; Finished full basement; One air conditioning unit
- Laundry & utility: Utility expense listed (monthly)
Neighborhood map
What this means for you Summary
Snapshot
- This is a 3 × 2-bed/1.0-bath units multifamily listed at $1.05M.
Deal economics
- At list price, monthly cash flow is $2k ($25k/yr) — positive. Per door: $686/mo.
- The deal already cash-flows at list — no discount required.
- Meets the 1% rule at list price ($11k rent vs $1.05M).
- Recommended offer: $924k (12.0% below list) — sets the bar for market timing.
- Cap rate 9.1% vs local median 2.6% in New York — top-decile yield for the area; either an underpriced asset or a hidden risk that comps aren't pricing in. Stress-test before assuming the spread holds.
Location & tenants
- Location reads 75/100 on livability (#268 in NY, #4,188 nationally) — a middle-class / working-renter tenant base. Strengths: amenities A+, commute A+, health & safety A; Watch: crime F, cost of living F.
- Zoned schools: Ps 225 Eileen E Zaglin (The) (math 57% / reading 52%, grade C, #908 of 2,108 statewide, top 46%, 963 students, 84% FRL); Is 98 Bay Academy (math 96% / reading 96%, grade A+, #2 of 729 statewide, top 0%, 1,488 students, 63% FRL); Midwood High School (math 94% / reading 96%, grade A+, #83 of 1,100 statewide, top 8%, 4,062 students, 73% FRL).
- Market conditions: Rents rising fast (+5.0%/yr); 524 active listings in the ZIP; 10,063 units permitted in Kings County in 2024 (9,789 in 5+ unit buildings).
- At $11,468/mo this rent would consume 231% of the median local household income ($60k/yr) (locally 7823% of renters already pay >50% of income on rent) — very limited rent-growth headroom before tenants either downsize or default.
Forward outlook
- Local home prices are declining (-3.0%/yr); year-one equity from $7k of loan paydown is wiped out by about $32k of value loss. Plan a longer hold.
- Kings County population projected at +13% by 2050 — modest demand growth; plan on rents tracking national, not racing it.
- At projected returns (-3.0% appreciation + 5.0% rent growth), your $294k cash investment doubles in ~10 years — after that, you're playing with house money.
Negotiation context
- It's been on market 197 days — a 12% lower offer ($924k) is reasonable based on typical stale-listing flexibility.
- 2 sale attempts since 18y ago with the ask held roughly flat each time — persistent listings suggest the price (not the market) is what's stuck; bring a comps-based counter.
- Current owner paid $525k; list at $1.05M implies a 100% gain — meaningful room to come down on a strong offer.
Risks & watch-outs
- Watch-outs: flood insurance adds $427/mo; built in 1931 — expect roof / HVAC / electrical / plumbing capex.
- Climate carrying-cost: in FEMA flood zone AE (mandatory federal flood insurance); major wind risk, 77% chance of damaging wind over 30y; extreme-heat days projected 7→16/yr by 2055 (HVAC capex compounding) — expect insurance premiums to compound above CPI over the hold.
Questions for the listing agent
- It's been on market 197 days. Have you received any prior offers? Is the seller open to a 12% concession, seller financing, or rate buy-down credit?
- Can we see the unit-by-unit rent roll, current vacancy, and any below-market leases? What's the average tenancy length?
- What capital expenditures (roof, boiler, parking lot, exteriors) have been made in the last 5 years, and what's planned in the next 2?
- Built in 1931 — when were the roof, HVAC, electrical panel, plumbing, and water heater last replaced?
- What's the actual annual flood-insurance premium (NFIP or private), and is the property in a SFHA with mandatory coverage?
- Why hasn't it sold? Are there any deal-killer items the seller is aware of (foundation, flood, title, zoning, code violations)?
- Is there a deadline driving the sale (1031 exchange, divorce, estate, relocation)? That informs how much negotiation room exists.
- Schools are B-rated — typically a magnet for longer-tenancy family renters. What's the average tenant stay here, and is there a school-zone premium baked into asking?
- Crime grade is F in this area — have there been break-ins, vandalism, or insurance claims at this property in the last 3 years? What carrier currently insures it and at what premium?
- What's the average days-on-market for RENTAL listings here right now (not sales)? A rising rental-DOM trend means longer vacancies and softer asking-rent achievability than the comps imply.
- What's the recent tenant-quality profile in this submarket — average credit score on applications, eviction rate, late-payment / NSF rate, and stable-employment percentage? A property-management company in the area should have these aggregated.
- How much new apartment / multifamily construction is in the pipeline within 1–3 miles? Heavy new supply (>2% of stock underway) typically softens rents 12–24 months out; light construction supports rent growth.
Investment metrics
- 1% rule
- 1.09% ✓
- Cap rate
- 9.13%
- Cash-on-cash
- 10.14%
- DSCR
- 1.45
- GRM
- 7.6
CMA / ARV
- ARV (on-the-fly)
- $1,057,030
- Comps found
- 1
Show comp detail 1 sale within ~0.75 mi
| Address | Dist | Beds/Ba | Sqft | Sold | Price | $/sf | Match |
|---|---|---|---|---|---|---|---|
| 2939 Brighton 3rd St | 0.19mi | 7/3.0 (+1) | 1,914 (-15%) | 6mo | $900,000 | $470 | 56 |
Match score weights: distance 35% · size 25% · config 20% · recency 20%. Top-matched comps best support the ARV.
Projected returns pro-forma
-3.0% appreciation · 5.04% rent growth · sell at horizon
- IRR
- -1.3%
- Equity multiple
- 0.95×
- Total profit
- $-15,103
- Equity at exit
- $156,558
- IRR
- 10.4%
- Equity multiple
- 1.88×
- Total profit
- $258,366
- Equity at exit
- $90,785
Cash invested: $294,000 (down + closing). Projections, not guarantees.
Landlord ↔ Tenant lean methodology
- Overall (CITY)
- 0 Strongly Tenant-Friendly
- State New York
- 15 Strongly Tenant-Friendly · D+10
- County
- — inherits STATE
- City New York
- 0 Strongly Tenant-Friendly · D+34
ZIP-level market 11235
- Rents YoY
- 5.0%
- Active inventory
- 524
- Price-to-rent
- 22.9×
Monthly cashflow live
- Estimated rent
- $11,468 medium interval (Pro) →
- Mortgage (P&I)
- −$5,506
- Tax from tax record
- −$632 /mo · $7,589/yr
- Insurance
- −$438
- Flood insurance flood zone
- −$427 /mo · $5,118/yr
- HOA
- −$0
- Vacancy / Maint / Mgmt
- −$2,408
- Net cashflow
- $2,057
Break-even live
Sensitivity live
| Price | -10% $2,651 | -5% $2,354 | +0% $2,057 | +5% $1,760 | +10% $1,463 |
|---|---|---|---|---|---|
| Rent | -10% $1,151 | -5% $1,604 | +0% $2,057 | +5% $2,510 | +10% $2,963 |
| Rate | -1.0pp $2,586 | -0.5pp $2,324 | base $2,057 | +0.5pp $1,785 | +1.0pp $1,508 |
3-unit breakdown (identical units grouped — click to expand)
| Units | Beds | Baths | Est. rent |
|---|---|---|---|
| 3× units | 2 | 1 | $11,469 |
| #1 | 2 | 1 | $3,823 |
| #2 | 2 | 1 | $3,823 |
| #3 | 2 | 1 | $3,823 |
| Total (3 units) | $11,468 | ||
UW: 25.0% down · 7.5% · 30yr · 1.5% tax · 5.0% vac · 8.0% maint · 8.0% mgmt
Financing live
Cash to close
- Down payment
- $262,500
- Closing costs
- $31,500
- Reserves months
- —
- Total cash needed
- —
Loan-product check · same deal, 3 products live
Conventional
25% down · 7.5% · 30yr
- Down + closing
- —
- Monthly P&I
- —
- Monthly cashflow
- —
- DSCR
- —
- Eligible?
- —
Personal DTI + credit; lowest rate.
DSCR
20% down · 8.5% · 30yr
- Down + closing
- —
- Monthly P&I
- —
- Monthly cashflow
- —
- DSCR
- —
- Eligible?
- —
No personal income docs; deal must DSCR.
Hard money
10% down · 12.0% · 12mo
- Down + closing
- —
- Monthly P&I
- —
- Monthly cashflow
- —
- DSCR
- —
- Eligible?
- —
Short-term bridge; refi at stabilization.
Listing history 16 events
-
2026-06-21days on market $1,050,000 Active 197 DOM
-
2026-06-18days on market $1,050,000 Active 194 DOM
-
2026-06-17days on market $1,050,000 Active 193 DOM
-
2026-06-15days on market $1,050,000 Active 191 DOM
-
2026-06-13days on market $1,050,000 Active 189 DOM
-
2026-06-10days on market $1,050,000 Active 185 DOM
-
2026-06-08days on market $1,050,000 Active 184 DOM
-
2026-06-04days on market $1,050,000 Active 180 DOM
-
2026-06-03days on market $1,050,000 Active 179 DOM
-
2026-06-01days on market $1,050,000 Active 177 DOM
-
2026-05-31days on market $1,050,000 Active 176 DOM
-
2026-05-05price $1,050,000
-
2026-01-08price $1,030,000
-
2025-12-06$1,050,000 Active
-
2009-01-07soldstatus $525,000
-
2008-06-20$555,000 217-char remark
Show marketing remark (217 chars)
BRIGHTON, NEAR OCEAN BEACH, SHOPPING & ALL TRANSPT, SEMI DET BRICK, 3 FAM HOUSE, 2 BDM OVER 2 BDM OVER 1 BDM, EXCELLENT CONDITION, TAKE ADVANTAGE OF THIS 3 FAM HOUSE, MOVE IN YOURSELF AND MAKE MONEY BY RENTING OUT
ⓘ Source: listings_history table (triggers on properties + properties_extension) + one-shot
backfill from property_details.listing_events for pre-trigger history.
Tax reassessment forecast NY · Partial reset (capped growth)
- Current annual tax
- $7,589 · $632/mo
- Projected year-2 tax
- $12,667 · $1,056/mo
- Expected delta
- +$5,078/yr (+$423/mo · 66.9%)
ⓘ Screening estimate from a state-policy table — verify with the county assessor before closing.
Climate risk First Street
- Flood 6/10 Major FEMA zone AE · 57% chance over 30 yrs
- Wildfire 1/10 Low
- Heat 7/10 Severe 7 d/yr ≥97°F today · 16 d/yr by 30 yrs out
- Wind 6/10 Major 77% chance of damaging wind over 30 yrs
- Air quality 4/10 Moderate 5 unhealthy d/yr today · 7 by 30 yrs out
Nearby sold comps map
Loading sold comps map…
Walkable amenities ~0.75 mi
Loading nearby amenities…
Taxation est. · year 1
- Rental income
- $137,616
- − Mortgage interest
- −$58,816
- − Property taxes
- −$7,589
- − Insurance
- −$10,368
- − Repairs & maintenance
- −$11,009
- − Management
- −$11,009
- − Depreciation
- −$30,545
- Taxable income
- $8,278
- Est. tax owed @ 24.0%
- −$1,987
- After-tax cash flow
- $22,697/yr
For passive investors: Depreciation is non-cash, so a rental often shows a tax loss while cash-flowing — sheltering income. Rental losses are passive: they offset passive income freely, and up to $25,000/yr can offset ordinary (W-2) income if you actively participate and your MAGI is under $100k (phasing out to $0 by $150k); unused losses carry forward. On sale, claimed depreciation is recaptured at up to 25%, and gains may owe capital-gains tax (a 1031 exchange can defer both). Figures are a year-1 estimate at your 24.0% rate — not tax advice; consult a CPA.
Schools (NCES district)
No district data.
Livability — New York
- Score
- 75/100
- State rank
- #268
- US rank
- #4188
Category grades
Schools grade is shown separately in the Schools card above.
Census & demographics
- Census place
- New York, NY
- County
- Kings County · 2,614,986 people
- City population
- 7,731,280
- Metro
- New York-Newark-Jersey City, NY-NJ-PA
- Population (ZIP)
- 78,558
- Household income
- $59,661
- Rent vs Own
- Severe rent burden
- 7823.0
Population outlook (Kings County) Hauer SSP2
- Today (2025)
- 2,847,441 people
- By 2030
- 2,937,006 · +3.1%
- By 2040
- 3,095,491 · +8.7%
- By 2050
- 3,228,968 · +13.4%
- By 2075
- 3,321,723 · +16.7%
- By 2100
- 3,111,387 · +9.3%
Race, ethnicity, and origin ACS 2023
- Neighborhood character
- Predominantly White (67%)
- Race & ethnicity
- White 67% Asian 15% Two or more races 9% Hispanic / Latino 9% Black 3%
- Hispanic origin (detail)
- Mexican 3% Puerto Rican 3%
- Common ancestry
- Scotch-Irish 15% Subsaharan African 12% Romanian 2%
- Foreign-born
- 63% · China, Canada, Vietnam
- Languages at home
- 24% English-only · Russian/Polish/Slavic 48% Chinese 7% Spanish 7%
Political lean MEDSL · Kings
- 2024 margin
- Solid D (+44.0) · D 72.0% · R 28.0%
- 2008→2024 swing
- -15.5pp toward R · 2008: 59.4pp · 2024: 44.0pp
- All cycles
- 2024: D+44.0 2020: D+54.8 2016: D+61.8 2012: D+63.9 2008: D+59.4
Not yet ingested
- Civics
- —
Market trends
- HPI YoY
- ▼ -181.73%
- Current HPI
- 303.6714
- Rent YoY
- ▲ 5.04%
- Metro
- New York-Newark-Jersey City, NY-NJ-PA
- State GDP YoY
- ▲ 2.60%
- F500 in state
- 92
Industry mix (Fortune 500 HQ in NY)
| Industry | F500 HQs | Revenue |
|---|---|---|
| Financial Services | 10 | $950B |
|
||
| Consumer Goods | 9 | $162B |
|
||
| Insurance | 4 | $225B |
|
||
| Telecommunications | 2 | $144B |
|
||
| Pharmaceuticals | 2 | $112B |
|
||
| Media / Entertainment | 2 | $69B |
|
||
Price history
+89.2% since first listed5 events — show timeline
- 2026-05-05 Price Changed $1,050,000 BNYMLS
- 2026-01-08 Price Changed $1,030,000 BNYMLS
- 2025-12-06 Listed $1,050,000 BNYMLS
- 2009-01-07 Sold (Public Records) $525,000 Public Records
- 2008-06-20 Listed $555,000 BNYMLS
Property tax history
+3.5%/yrLatest (2025): $7,589 · -2.5% YoY. Source: county tax records.
Cash-flow waterfall
monthlySold comps — $/sqft
last 12 mo · ≤1 miLoading sold comps…