21217 Washington Ave #28 · Diamond Bar, CA
Flood risk 1/10 · Minimal
- FEMA flood zone
- X (unshaded)
- Chance of flooding over 30 yrs
- 0.0%
- Est. flood insurance / yr
- $507 – $1,088
Fire risk 1/10 · Minimal
- Est. fire insurance / yr
- $659 – $1,223
Heat risk 7/10 · Major
- Hot days now (above 98°F)
- 7 days/yr
- Hot days in 30 yrs
- 22 days/yr
Wind risk 1/10 · Minimal
- Chance of severe wind over 30 yrs
- —
Air-quality risk 6/10 · Moderate
- Unhealthy air days now
- 10 days/yr
- Unhealthy air days in 30 yrs
- 13 days/yr
Risk factors via First Street. Map © Google.
Why this score? — see what drove the C+ grade
The composite is a weighted blend of 9 inputs, each scored 0–100. Each bar is that input's sub-score; the figure is the points it added to the 100-point composite (weight × sub-score).
- Cash flow +28.5/30.0
- DSCR +10.0/10.0
- 1% rule +7.9/10.0
- Schools +6.9/10.0
- Livability +3.9/5.0
- Rent growth +2.6/5.0
- Condition / age +2.5/5.0
- ARV discount +0.0/15.0
- Appreciation +0.0/10.0
$308,000
🖨 Deal sheet 📄 Offer letter ✓ Due diligence
Listing remarks MLS
Accepting Back Up Offer ! Located in a quiet and secured gated mobile home community. Amenities includes club house, swimming pool, in-ground spa, basket ball court & play area. Excellent "Walnut Valley School District" * Convenient location with easy access to major Freeways 60 & 57, Metro-link & Nearby Shopping Area Spacious double wide manufactured home with open floor plan, living room with fireplace, Master Bedroom with walking closet. Covered porch & Beautiful landscaping.
Key facts
- Dual-pane windows
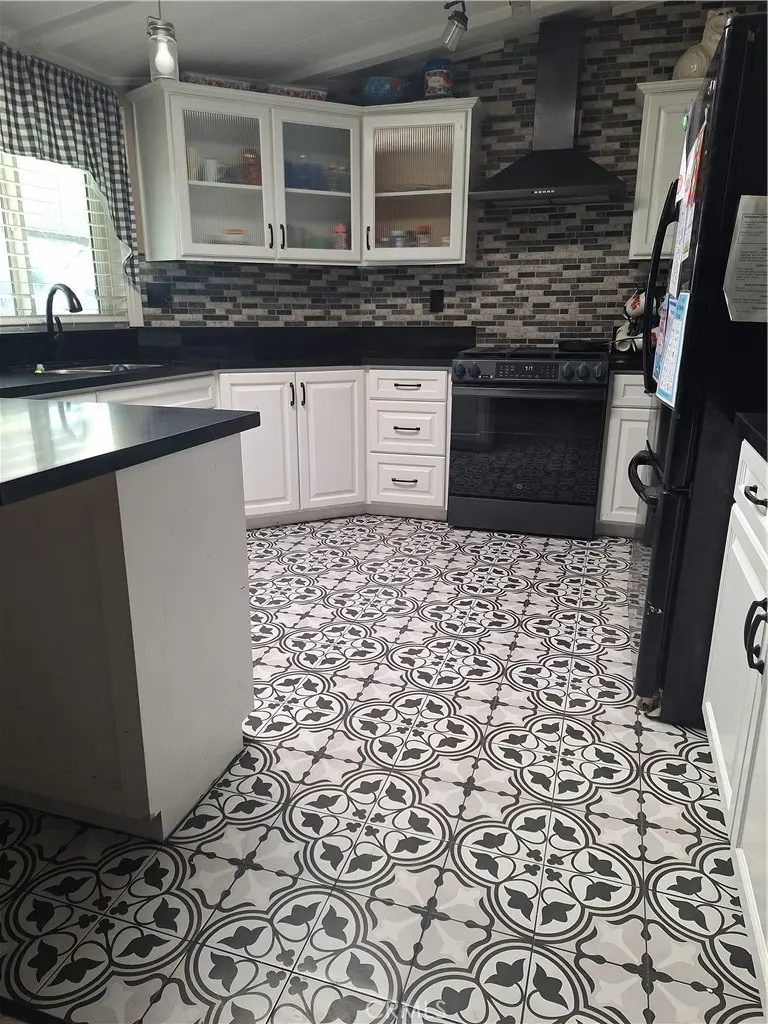
- Remodeled kitchen
- Upgraded gas stove
Tags
Property features AI
Finance
- Other: Park name: Diamond Bar; Manager approval required for residency; Pets: contact management
- HOA & community: Land lease community (land lease $1,395)
Exterior
- Parking: Covered parking; Gated parking area; 3 parking spaces (includes 3 carport spaces)
- Security: Gated community
- Utilities: 220V electrical throughout; Public/district water; Public sewer (sewer connected)
- Home design: Manufactured home (Madison model), double body; Single-story; Entry through gated community; Mobile home remains
- Construction: Wood construction with drywall walls; Concrete slab foundation; Built/updated and remodeled (year built from assessor)
- Exterior features: Shingle roof; Porch and deck with wood and brick elements; Patio; Storage building (1 shed); Community pool; Close to clubhouse; Street lighting in neighborhood
Interior
- Kitchen: Gas range; Water line to refrigerator; Pots & pan drawers; Gas water heater
- Flooring: Tile flooring; Vinyl flooring
- Bathrooms: 2 full bathrooms; Bathtub; Low-flow shower
- Heating & cooling: Central heating (central furnace); Central cooling
- Interior features: Quartz counters; Storage space; Double pane windows; Window screens; One-level entry (gate)
- Laundry & utility: Laundry room; Gas dryer hookup
Neighborhood map
What this means for you Summary
Snapshot
- This is a 3-bed/2.0-bath manufactured listed at $308k.
Deal economics
- At list price, monthly cash flow is $1k ($12k/yr) — positive.
- The deal already cash-flows at list — no discount required.
- Meets the 1% rule at list price ($4k rent vs $308k).
- Cap rate 10.2% vs local median 2.1% in Diamond Bar — top-decile yield for the area; either an underpriced asset or a hidden risk that comps aren't pricing in. Stress-test before assuming the spread holds.
Location & tenants
- Location reads 77/100 on livability (#86 in CA, #3,131 nationally) — a middle-class / working-renter tenant base. Strengths: amenities A+, employment A+, schools A-; Watch: health & safety D+, cost of living F.
- Walnut Valley Unified (suburban): math 74% / reading 79% proficiency, ranked #32 of 517 in CA (top 6%) — strong family-tenant draw, lease renewals of 3-5y typical; only 11% free/reduced lunch — higher-income household profile.
- Market conditions: Rents flat; 137 active listings in the ZIP; 9 comparable units currently listed for rent nearby; rentals leasing fast (median 11d on market — plan ~1-2 weeks tenant-placement turnaround); high-income renter base; 19,697 units permitted in Los Angeles County in 2024 (9,426 in 5+ unit buildings).
- This rent runs 38% of the median local income ($126k/yr) — at the standard rent-burdened threshold; future hikes will face affordability resistance.
Forward outlook
- Local home prices are declining (-3.0%/yr); year-one equity from $2k of loan paydown is wiped out by about $9k of value loss. Plan a longer hold.
- Los Angeles County population projected at +9% by 2050 — modest demand growth; plan on rents tracking national, not racing it.
Negotiation context
- Only 6 days on market — expect competitive offers; lowballing is unlikely to land.
- 3 sale attempts since 6y ago with the ask held roughly flat each time — persistent listings suggest the price (not the market) is what's stuck; bring a comps-based counter.
- Current owner paid $100k; list at $308k implies a 208% gain — meaningful room to come down on a strong offer.
Risks & watch-outs
- Climate carrying-cost: extreme-heat days projected 7→22/yr by 2055 (HVAC capex compounding) — expect insurance premiums to compound above CPI over the hold.
Questions for the listing agent
- Is there a deadline driving the sale (1031 exchange, divorce, estate, relocation)? That informs how much negotiation room exists.
- Schools are A-rated — typically a magnet for longer-tenancy family renters. What's the average tenant stay here, and is there a school-zone premium baked into asking?
- What's the average days-on-market for RENTAL listings here right now (not sales)? A rising rental-DOM trend means longer vacancies and softer asking-rent achievability than the comps imply.
- What's the recent tenant-quality profile in this submarket — average credit score on applications, eviction rate, late-payment / NSF rate, and stable-employment percentage? A property-management company in the area should have these aggregated.
- How much new for-sale + rental construction is in the pipeline within 1–3 miles? Heavy new supply typically softens prices + rents 12–24 months out; constrained supply supports both.
Investment metrics
- 1% rule
- 1.29% ✓
- Cap rate
- 10.19%
- Cash-on-cash
- 13.94%
- DSCR
- 1.62
- GRM
- 6.5
CMA / ARV
- ARV (on-the-fly)
- $230,400
- Comps found
- 3
Show comp detail 3 sales within ~0.75 mi
| Address | Dist | Beds/Ba | Sqft | Sold | Price | $/sf | Match |
|---|---|---|---|---|---|---|---|
| 21217 Washington Ave #112 | 0.00mi | 2/2.0 (-1) | 1,248 (-13%) | 19mo | $193,000 | $155 | 57 |
| 20739 Lycoming St #117 | 0.62mi | 2/2.0 (-1) | 1,446 (+0%) | 16mo | $261,000 | $180 | 52 |
| 20739 Lycoming #112 | 0.56mi | 2/2.0 (-1) | 1,248 (-13%) | 7mo | $200,000 | $160 | 41 |
Match score weights: distance 35% · size 25% · config 20% · recency 20%. Top-matched comps best support the ARV.
Projected returns pro-forma
-3.0% appreciation · 0.35% rent growth · sell at horizon
- IRR
- 1.1%
- Equity multiple
- 1.04×
- Total profit
- $3,644
- Equity at exit
- $45,924
- IRR
- 7.9%
- Equity multiple
- 1.53×
- Total profit
- $45,500
- Equity at exit
- $26,630
Cash invested: $86,240 (down + closing). Projections, not guarantees.
Landlord ↔ Tenant lean methodology
- Overall (STATE)
- 18 Strongly Tenant-Friendly
- State California
- 18 Strongly Tenant-Friendly · D+13
- County
- — inherits STATE
- City
- — inherits STATE
ZIP-level market 91789
- Rents YoY
- 0.3%
- Active inventory
- 137
- Price-to-rent
- 6.5×
Monthly cashflow live
- Estimated rent
- $3,962 high interval (Pro) →
- Mortgage (P&I)
- −$1,615
- Tax est. 1.5%
- −$385 /mo · $4,620/yr
- Insurance
- −$128
- HOA
- −$0
- Vacancy / Maint / Mgmt
- −$832
- Net cashflow
- $1,001
Break-even live
UW: 25.0% down · 7.5% · 30yr · 1.5% tax · 5.0% vac · 8.0% maint · 8.0% mgmt
Financing live
Cash to close
- Down payment
- $77,000
- Closing costs
- $9,240
- Reserves months
- —
- Total cash needed
- —
Loan-product check · same deal, 3 products live
Conventional
25% down · 7.5% · 30yr
- Down + closing
- —
- Monthly P&I
- —
- Monthly cashflow
- —
- DSCR
- —
- Eligible?
- —
Personal DTI + credit; lowest rate.
DSCR
20% down · 8.5% · 30yr
- Down + closing
- —
- Monthly P&I
- —
- Monthly cashflow
- —
- DSCR
- —
- Eligible?
- —
No personal income docs; deal must DSCR.
Hard money
10% down · 12.0% · 12mo
- Down + closing
- —
- Monthly P&I
- —
- Monthly cashflow
- —
- DSCR
- —
- Eligible?
- —
Short-term bridge; refi at stabilization.
Rent comps 9 comps
| Address | Beds | Baths | Sqft | Rent | $/sqft | DOM | Units | Dist |
|---|---|---|---|---|---|---|---|---|
| 831 Windwood Dr Walnut, CA | 3.0 | 1.5 | 1136 | $3,050 | $2.68 | 3d | 1 | 0.30mi |
| 20980 Cornerstone Dr Walnut, CA | 4.0 | 3.0 | 1760 | $3,975 | $2.26 | 1d | 1 | 0.70mi |
| 21000 Cornerstone Dr Walnut, CA | 4.0 | 3.5 | 1830 | $4,200 | $2.30 | 1d | 1 | 0.71mi |
| 21038 Cornerstone Dr Walnut, CA | 4.0 | 3.5 | 1830 | $3,975 | $2.17 | 10d | 1 | 0.71mi |
| 20537 Vejar Rd Walnut, CA | 3.0 | 2.0 | 1396 | $3,800 | $2.72 | 43d | 1 | 1.12mi |
| 248 Centinary Dr Walnut, CA | 3.0 | 2.0 | 1429 | $3,750 | $2.62 | 43d | 1 | 1.14mi |
| 268 Centinary Dr Walnut, CA | 3.0 | 2.0 | 1476 | $3,700 | $2.51 | 10d | 1 | 1.17mi |
| 268 Macalester Dr Walnut, CA | 2.0 | 2.0 | 1008 | $3,350 | $3.32 | 7d | 1 | 1.37mi |
| 22808 Hilton Head Dr #28 Diamond Bar, CA | 2.0 | 2.0 | 934 | $2,550 | $2.73 | 18d | 1 | 1.49mi |
Listing history 6 events
-
2026-06-18days on market $308,000 Active 6 DOM
-
2026-06-17days on market $308,000 Active 5 DOM
-
2026-06-16days on market $308,000 Active 4 DOM
-
2026-06-15days on market $308,000 Active 3 DOM
-
2026-06-13remarks 699-char remark
-
2026-06-13$308,000 Active 1 DOM
ⓘ Source: listings_history table (triggers on properties + properties_extension) + one-shot
backfill from property_details.listing_events for pre-trigger history.
Climate risk First Street
- Flood 1/10 Low FEMA zone X (unshaded) · 0% chance over 30 yrs
- Wildfire 1/10 Low
- Heat 7/10 Severe 7 d/yr ≥98°F today · 22 d/yr by 30 yrs out
- Wind 1/10 Low
- Air quality 6/10 Major 10 unhealthy d/yr today · 13 by 30 yrs out
Nearby sold comps map
Loading sold comps map…
Walkable amenities ~0.75 mi
Loading nearby amenities…
Taxation est. · year 1
- Rental income
- $47,544
- − Mortgage interest
- −$17,253
- − Property taxes
- −$4,620
- − Insurance
- −$1,540
- − Repairs & maintenance
- −$3,804
- − Management
- −$3,804
- − Depreciation
- −$8,960
- Taxable income
- $7,565
- Est. tax owed @ 24.0%
- −$1,815
- After-tax cash flow
- $10,202/yr
For passive investors: Depreciation is non-cash, so a rental often shows a tax loss while cash-flowing — sheltering income. Rental losses are passive: they offset passive income freely, and up to $25,000/yr can offset ordinary (W-2) income if you actively participate and your MAGI is under $100k (phasing out to $0 by $150k); unused losses carry forward. On sale, claimed depreciation is recaptured at up to 25%, and gains may owe capital-gains tax (a 1031 exchange can defer both). Figures are a year-1 estimate at your 24.0% rate — not tax advice; consult a CPA.
Schools (NCES district)
- District
- Walnut Valley Unified
- NCES district ID
- 0641280
- Math proficiency
- 74% ▼ -1.00%
- Reading proficiency
- 79% ▲ 2.00%
- Median HH income
- $93,189
- Composite
- 68.87/100
- National rank
- #328
- State rank
- #32 of 517 in CA
Livability — Diamond Bar
- Score
- 77/100
- State rank
- #86
- US rank
- #3131
Category grades
Schools grade is shown separately in the Schools card above.
Census & demographics
- Census place
- Diamond Bar, CA
- County
- Los Angeles County · 9,444,647 people
- City population
- 44,502
- Metro
- Los Angeles-Long Beach-Anaheim, CA
- Population (ZIP)
- 40,298
- Household income
- $125,720
- Rent vs Own
- Severe rent burden
- 603.0
Population outlook (Los Angeles County) Hauer SSP2
- Today (2025)
- 10,940,515 people
- By 2030
- 11,256,481 · +2.9%
- By 2040
- 11,729,929 · +7.2%
- By 2050
- 11,948,407 · +9.2%
- By 2075
- 11,818,114 · +8.0%
- By 2100
- 10,842,928 · -0.9%
Race, ethnicity, and origin ACS 2023
- Neighborhood character
- Predominantly Asian (67%)
- Race & ethnicity
- Asian 67% Hispanic / Latino 18% White 9% Two or more races 7% Black 2%
- Hispanic origin (detail)
- Mexican 15%
- Foreign-born
- 51% · China, South Korea, Canada
- Languages at home
- 33% English-only · Chinese 38% Spanish 9% Tagalog/Filipino 6%
Political lean MEDSL · Los Angeles
- 2024 margin
- Solid D (+32.9) · D 64.8% · R 31.9% · Other 3.3%
- 2008→2024 swing
- -7.4pp toward R · 2008: 40.4pp · 2024: 32.9pp
- All cycles
- 2024: D+32.9 2020: D+44.2 2016: D+48.0 2012: D+40.0 2008: D+40.4
Not yet ingested
- Civics
- —
Market trends
- HPI YoY
- ▼ -884.62%
- Current HPI
- 368.0775
- Rent YoY
- ▲ 0.35%
- Metro
- Los Angeles-Long Beach-Anaheim, CA
- State GDP YoY
- ▲ 3.21%
- F500 in state
- 116
Industry mix (Fortune 500 HQ in CA)
| Industry | F500 HQs | Revenue |
|---|---|---|
| Technology | 27 | $1,492B |
|
||
| Financial Services | 3 | $174B |
|
||
| Retail | 3 | $44B |
|
||
| Insurance | 3 | $26B |
|
||
| Media / Entertainment | 2 | $115B |
|
||
| Pharmaceuticals / Biotech | 2 | $62B |
|
||
Price history
+131.6% since first listed8 events — show timeline
- 2026-06-12 Listed $308,000 CRMLS
- 2020-09-29 Sold (MLS) $100,000 CRMLS
- 2020-09-09 Contingent — CRMLS
- 2020-08-27 Price Changed $110,000 CRMLS
- 2020-07-17 Price Changed $120,000 CRMLS
- 2020-06-22 Relisted — CRMLS
- 2020-06-10 Contingent — CRMLS
- 2020-05-21 Listed $133,000 CRMLS
Property tax history
+6.7%/yrLatest (2025): $520 · +6.7% YoY. Source: county tax records.
Cash-flow waterfall
monthlySold comps — $/sqft
last 12 mo · ≤1 miLoading sold comps…