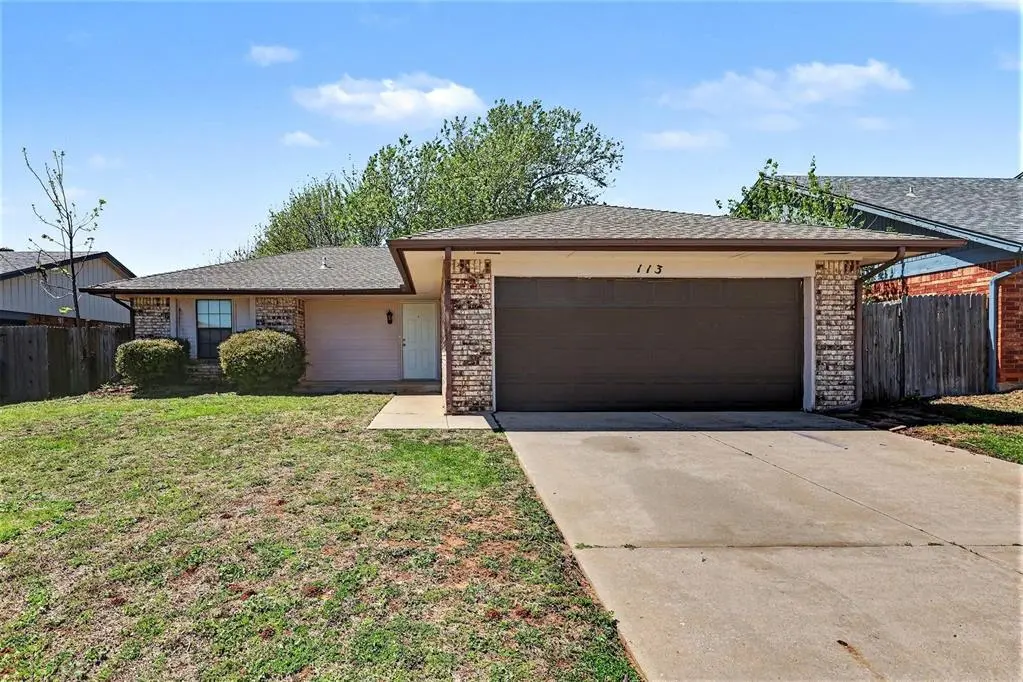
113 Oak Tree Dr · Midwest City, OK
Flood risk 1/10 · Minimal
- FEMA flood zone
- X (unshaded)
- Chance of flooding over 30 yrs
- 0.0%
- Est. flood insurance / yr
- $507 – $1,088
Fire risk 2/10 · Minimal
- Est. fire insurance / yr
- $2,463 – $4,575
Heat risk 6/10 · Moderate
- Hot days now (above 107°F)
- 7 days/yr
- Hot days in 30 yrs
- 19 days/yr
Wind risk 3/10 · Minor
- Chance of severe wind over 30 yrs
- 5.0%
Air-quality risk 2/10 · Minimal
- Unhealthy air days now
- 1 days/yr
- Unhealthy air days in 30 yrs
- 2 days/yr
Risk factors via First Street. Map © Google.
Why this score? — see what drove the D grade
The composite is a weighted blend of 9 inputs, each scored 0–100. Each bar is that input's sub-score; the figure is the points it added to the 100-point composite (weight × sub-score).
- Cash flow +14.3/30.0
- ARV discount +8.8/15.0
- DSCR +4.3/10.0
- Rent growth +3.9/5.0
- 1% rule +3.8/10.0
- Livability +3.6/5.0
- Condition / age +2.5/5.0
- Schools +1.2/10.0
- Appreciation +0.0/10.0
$164,900
🖨 Deal sheet (PDF) 📄 Offer letter ✓ Due diligence
Listing remarks MLS
Don't miss out! This well cared for 3 bed/2 bath home won’t last long. This 1,306 sq ft home features a spacious living room and a large master suite with the master bath recently updated with a walk-in shower. It also has two good-sized secondary bedrooms and a sizable utility room to meet all your storage needs. As a rental property, this home is just waiting for the new owner’s special touch to bring it back to life. Seller is listing the property AS-IS, with no repairs. Currently tenant occupied but will be out by the end of the month. Only CASH offers will be entertained. Please allow 24-hour notice for showings. Professional pictures coming soon.
Key facts
- Open floor plan
- Classic fireplace
- Granite countertops
Tags
Property features AI
Finance
- Other: Vacant and available; Homestead: No
- Financial info: Listing offered in as-is condition; cash, conventional, FHA, or VA financing accepted; Assumable loan: No
- HOA & community: No mandatory association dues
Exterior
- Parking: 2-car garage
- Utilities: Electricity available; Public utilities
- Home design: Single family residence; One story; Residential property; Existing property
- Construction: Brick and frame construction; Composition roof; Slab foundation
- Exterior features: Covered porch; Open patio; Lot features: Other
Interior
- Kitchen: Range
- Bedrooms: 3 bedrooms
- Flooring: Carpet; Tile
- Bathrooms: 2 full bathrooms
- Heating & cooling: Electric heating
- Interior features: Ceiling fans; Window treatments; 1 fireplace
Neighborhood map
What this means for you Summary
Snapshot
- This is a 3-bed/2.0-bath single-family listed at $165k.
Deal economics
- At list price, monthly cash flow is $30 ($357/yr) — positive.
- The deal already cash-flows at list — no discount required.
- To meet the 1% rule (rent ≥ 1% of price), the offer needs to be $146k (11.6% below list).
- Recommended offer: $146k (11.6% below list) — sets the bar for 1% rule.
Location & tenants
- Location reads 71/100 on livability (#30 in OK) — a middle-class / working-renter tenant base. Strengths: cost of living A+, housing A+, health & safety A; Watch: crime D+, employment D, amenities F.
- Midwest City-Del City (suburban): math 10% / reading 17% proficiency, ranked #231 of 270 in OK (top 86%) — low school quality limits family demand, transient renter base, plan for 1-2y turnover.
- Zoned schools: Cleveland Bailey Es (math 17% / reading 17%, grade F, #540 of 845 statewide, top 68%, 307 students, 0% FRL); Carl Albert Ms (math 14% / reading 26%, grade F, #158 of 345 statewide, top 47%, 834 students, 0% FRL); Midwest City Hs (math 7% / reading 17%, grade F, #359 of 447 statewide, top 80%, 1,368 students, 0% FRL) — zoned schools average 0% FRL vs 57% district-wide (57 pts lower); this property's tenant base skews higher-income than the district average.
- Market conditions: Rents rising fast (+5.7%/yr); 167 active listings in the ZIP; 34 comparable units currently listed for rent nearby; rentals at typical pace (median 18d on market — plan ~3-4 weeks tenant-placement turnaround); 5,365 units permitted in Oklahoma County in 2024 (569 in 5+ unit buildings).
Forward outlook
- Local home prices are declining (-3.0%/yr); year-one equity from $1k of loan paydown is wiped out by about $5k of value loss. Plan a longer hold.
- Oklahoma County population projected at +41% by 2050 — long-run rental-demand tailwind backs the buy-and-hold thesis.
Negotiation context
- It's been on market 64 days — a 6% lower offer ($155k) is reasonable based on typical stale-listing flexibility.
- 3 sale attempts since 23y ago with the ask held roughly flat each time — persistent listings suggest the price (not the market) is what's stuck; bring a comps-based counter.
Risks & watch-outs
- Climate carrying-cost: extreme-heat days projected 7→19/yr by 2055 (HVAC capex compounding) — expect insurance premiums to compound above CPI over the hold.
Questions for the listing agent
- It's been on market 64 days. Have you received any prior offers? Is the seller open to a 12% concession, seller financing, or rate buy-down credit?
- Why hasn't it sold? Are there any deal-killer items the seller is aware of (foundation, flood, title, zoning, code violations)?
- Is there a deadline driving the sale (1031 exchange, divorce, estate, relocation)? That informs how much negotiation room exists.
- Schools are D-rated, which usually means shorter tenancies and higher turnover. Who's the typical renter profile here, and what's been the actual vacancy rate?
- Crime grade is D in this area — have there been break-ins, vandalism, or insurance claims at this property in the last 3 years? What carrier currently insures it and at what premium?
- The area grade is low — what's the realistic commute time and amenity access for the typical tenant pool here? Any planned neighborhood developments (good or bad) we should know about?
- What's the average days-on-market for RENTAL listings here right now (not sales)? A rising rental-DOM trend means longer vacancies and softer asking-rent achievability than the comps imply.
- What's the recent tenant-quality profile in this submarket — average credit score on applications, eviction rate, late-payment / NSF rate, and stable-employment percentage? A property-management company in the area should have these aggregated.
- How much new for-sale + rental construction is in the pipeline within 1–3 miles? Heavy new supply typically softens prices + rents 12–24 months out; constrained supply supports both.
Investment metrics
- 1% rule
- 0.88% ✗
- Cap rate
- 6.51%
- Cash-on-cash
- 0.77%
- DSCR
- 1.03
- GRM
- 9.4
CMA / ARV
- ARV (on-the-fly)
- $169,780
- Comps found
- 12
Show comp detail 12 sales within ~0.75 mi
| Address | Dist | Beds/Ba | Sqft | Sold | Price | $/sf | Match |
|---|---|---|---|---|---|---|---|
| 140 Oak Tree Ln | 0.08mi | 3/2.0 | 1,306 (0%) | 1mo | $175,000 | $134 | 95 |
| 129 Oak Tree Dr | 0.04mi | 3/2.0 | 1,309 (+0%) | 7mo | $190,000 | $145 | 91 |
| 10116 Oak Park Dr | 0.36mi | 3/2.0 | 1,280 (-2%) | 3mo | $190,000 | $148 | 77 |
| 203 Oak Tree Ln | 0.10mi | 3/2.0 | 1,440 (+10%) | 7mo | $218,000 | $151 | 72 |
| 10305 1/2 Saint Patrick Dr | 0.57mi | 3/2.0 | 1,304 (-0%) | 1mo | $245,000 | $188 | 72 |
| 617 S Saint Paul Ave | 0.42mi | 3/1.0 | 1,332 (+2%) | 2mo | $120,000 | $90 | 72 |
| 220 Oak Tree Ln | 0.14mi | 3/2.0 | 1,466 (+12%) | 2mo | $118,000 | $80 | 71 |
| 516 N Lotus Ave | 0.52mi | 3/2.0 | 1,274 (-2%) | 8mo | $165,000 | $130 | 65 |
| 640 Moraine Ave | 0.66mi | 3/2.0 | 1,250 (-4%) | 7mo | $155,000 | $124 | 56 |
| 637 Lotus Ave | 0.65mi | 3/2.0 | 1,439 (+10%) | 1mo | $164,000 | $114 | 52 |
| 645 Lloyd Ave | 0.66mi | 4/1.5 (+1) | 1,186 (-9%) | 3mo | $147,000 | $124 | 44 |
| 10344 Lejean Dr | 0.71mi | 3/1.0 | 1,113 (-15%) | 1mo | $62,000 | $56 | 37 |
Match score weights: distance 35% · size 25% · config 20% · recency 20%. Top-matched comps best support the ARV.
Projected returns pro-forma
-3.0% appreciation · 5.73% rent growth · sell at horizon
- IRR
- -12.1%
- Equity multiple
- 0.55×
- Total profit
- $-20,704
- Equity at exit
- $24,587
- IRR
- 0.6%
- Equity multiple
- 1.05×
- Total profit
- $2,299
- Equity at exit
- $14,258
Cash invested: $46,172 (down + closing). Projections, not guarantees.
Landlord ↔ Tenant lean methodology
- Overall (STATE)
- 83 Strongly Landlord-Friendly
- State Oklahoma
- 83 Strongly Landlord-Friendly · R+20
- County
- — inherits STATE
- City
- — inherits STATE
ZIP-level market 73130
- Home prices YoY
- -21.0%
- Rents YoY
- 5.7%
- Active inventory
- 167
- Price-to-rent
- 9.4×
Monthly cashflow live
- Estimated rent
- $1,457 high interval (Pro) →
- Mortgage (P&I)
- −$865
- Tax from tax record
- −$188 /mo · $2,256/yr
- Insurance
- −$69
- HOA
- −$0
- Vacancy / Maint / Mgmt
- −$306
- Net cashflow
- $30
Break-even live
Sensitivity live
| Price | -10% $123 | -5% $76 | +0% $30 | +5% $-17 | +10% $-64 |
|---|---|---|---|---|---|
| Rent | -10% $-85 | -5% $-28 | +0% $30 | +5% $87 | +10% $145 |
| Rate | -1.0pp $113 | -0.5pp $72 | base $30 | +0.5pp $-13 | +1.0pp $-56 |
UW: 25.0% down · 7.5% · 30yr · 1.5% tax · 5.0% vac · 8.0% maint · 8.0% mgmt
Financing live
Cash to close
- Down payment
- $41,225
- Closing costs
- $4,947
- Reserves months
- —
- Total cash needed
- —
Loan-product check · same deal, 3 products live
Conventional
25% down · 7.5% · 30yr
- Down + closing
- —
- Monthly P&I
- —
- Monthly cashflow
- —
- DSCR
- —
- Eligible?
- —
Personal DTI + credit; lowest rate.
DSCR
20% down · 8.5% · 30yr
- Down + closing
- —
- Monthly P&I
- —
- Monthly cashflow
- —
- DSCR
- —
- Eligible?
- —
No personal income docs; deal must DSCR.
Hard money
10% down · 12.0% · 12mo
- Down + closing
- —
- Monthly P&I
- —
- Monthly cashflow
- —
- DSCR
- —
- Eligible?
- —
Short-term bridge; refi at stabilization.
Rent comps 34 comps
| Address | Beds | Baths | Sqft | Rent | $/sqft | DOM | Units | Dist |
|---|---|---|---|---|---|---|---|---|
| 9705 Oak Tree Ter Oklahoma City, OK | 3.0 | 2.0 | 1100 | $1,410 | $1.28 | 12d | 1 | 0.18mi |
| 405 Lotus Ave Oklahoma City, OK | 3.0 | 2.0 | 1300 | $1,611 | $1.24 | 3d | 1 | 0.35mi |
| 217 Saint Charles Way Oklahoma City, OK | 4.0 | 2.0 | 1448 | $1,525 | $1.05 | 25d | 1 | 0.42mi |
| 604 Moraine Ave Oklahoma City, OK | 3.0 | 1.5 | 1181 | $1,395 | $1.18 | 3d | 1 | 0.54mi |
| 629 Lloyd Ave Oklahoma City, OK | 4.0 | 1.5 | 1213 | $1,095 | $0.90 | 5d | 1 | 0.60mi |
| 633 Lotus Ave Oklahoma City, OK | 3.0 | 1.0 | 1038 | $1,300 | $1.25 | 12d | 1 | 0.63mi |
| 201 Three Oaks Dr Oklahoma City, OK | 3.0 | 1.5 | 1818 | $1,625 | $0.89 | 25d | 1 | 0.65mi |
| 645 Lloyd Ave Oklahoma City, OK | 4.0 | 1.5 | 1186 | $1,650 | $1.39 | 3d | 1 | 0.65mi |
| 600 N Poplar Ln Oklahoma City, OK | 3.0 | 2.0 | 1592 | $1,749 | $1.10 | 3d | 1 | 0.66mi |
| 721 Lloyd Ave Oklahoma City, OK | 4.0 | 2.5 | 1552 | $1,500 | $0.97 | 3d | 1 | 0.72mi |
| 801 Royal Ave Oklahoma City, OK | 3.0 | 1.0 | 951 | $1,200 | $1.26 | 19d | 1 | 0.78mi |
| 8801 Saint George Way Oklahoma City, OK | 3.0 | 2.0 | 1122 | $1,175 | $1.05 | 12d | 1 | 1.01mi |
| 8801 Saint George Way Oklahoma City, OK | 3.0 | 2.0 | 1122 | $1,175 | $1.05 | 25d | 1 | 1.01mi |
| 9528 McIntosh Ave Oklahoma City, OK | 3.0 | 2.0 | 1164 | $1,195 | $1.03 | 45d | 1 | 1.04mi |
| 236 Spirit Dr Midwest City, OK | 3.0 | 2.0 | 1350 | $1,600 | $1.19 | 4d | 1 | 1.05mi |
| 9604 NE 11th St Oklahoma City, OK | 4.0 | 1.0 | 1280 | $1,795 | $1.40 | 3d | 1 | 1.05mi |
| 8910 Oak Valley Dr Oklahoma City, OK | 2.0 | 2.0 | 935 | $1,000 | $1.07 | 22d | 1 | 1.07mi |
| 1216 McGregor Dr Oklahoma City, OK | 4.0 | 1.5 | 1212 | $1,495 | $1.23 | 4d | 1 | 1.11mi |
| 8717 Saint George Way Oklahoma City, OK | 2.0 | 2.0 | 1075 | $1,150 | $1.07 | 25d | 1 | 1.12mi |
| 119 Woodman Dr Oklahoma City, OK | 3.0 | 2.0 | 1252 | $1,400 | $1.12 | 4d | 1 | 1.15mi |
| 1400 Alan Ln Oklahoma City, OK | 3.0 | 2.0 | 1288 | $1,495 | $1.16 | 45d | 1 | 1.21mi |
| 10831 NE 8th Ter Oklahoma City, OK | 3.0 | 2.0 | 1704 | $1,820 | $1.07 | 25d | 1 | 1.28mi |
| 1400 Marydale Ave Oklahoma City, OK | 3.0 | 1.0 | 1082 | $1,150 | $1.06 | 17d | 1 | 1.28mi |
| 8517 E Reno Ave Oklahoma City, OK | 1.0–2.0 | 1.0–2.0 | 837 | $859 | $1.03 | 6d | 1 | 1.30mi |
| 910 N Oakview Dr Oklahoma City, OK | 3.0 | 2.0 | 1512 | $1,239 | $0.82 | 3d | 1 | 1.33mi |
| 10220 Isaac Dr Oklahoma City, OK | 3.0 | 1.0 | 1106 | $1,250 | $1.13 | 45d | 1 | 1.35mi |
| 1525 N Christine Dr Oklahoma City, OK | 3.0 | 1.5 | 1264 | $1,035 | $0.82 | 4d | 1 | 1.38mi |
| 1525 McGregor Dr Oklahoma City, OK | 3.0 | 1.5 | 1012 | $1,275 | $1.26 | 3d | 1 | 1.38mi |
| 1109 Parkview Dr Oklahoma City, OK | 3.0 | 2.0 | 1290 | $1,300 | $1.01 | 25d | 1 | 1.40mi |
| 1617 N Christine Dr Oklahoma City, OK | 2.0 | 2.0 | 962 | $1,050 | $1.09 | 25d | 1 | 1.43mi |
| 10400 Caton Pl Oklahoma City, OK | 3.0 | 2.0 | 1164 | $1,280 | $1.10 | 25d | 1 | 1.43mi |
| 3513 Parkwoods Ln Oklahoma City, OK | 3.0 | 1.5 | 903 | $1,150 | $1.27 | 46d | 1 | 1.44mi |
| 9212 Jennifer Pl Oklahoma City, OK | 3.0 | 2.0 | 960 | $1,250 | $1.30 | 45d | 1 | 1.46mi |
| 1520 Patricia Dr Oklahoma City, OK | 3.0 | 1.0 | 1040 | $1,200 | $1.15 | 45d | 1 | 1.48mi |
Listing history 18 events
-
2026-06-13statusdays on market $164,900 Pending 64 DOM
-
2026-06-09days on market $164,900 Active 61 DOM
-
2026-06-08days on market $164,900 Active 60 DOM
-
2026-06-07days on market $164,900 Active 59 DOM
-
2026-06-05days on market $164,900 Active 56 DOM
-
2026-06-03days on market $164,900 Active 55 DOM
-
2026-06-02days on market $164,900 Active 54 DOM
-
2026-06-01days on market $164,900 Active 53 DOM
-
2026-05-31days on market $164,900 Active 52 DOM
-
2026-04-09$169,900 Active
-
2022-10-03soldstatus $2,641,000
-
2022-04-05soldstatus $155,500
-
2022-04-04soldstatus $155,200 Sold 672-char remark
Show marketing remark (672 chars)
Don't miss out! This well cared for 3 bed/2 bath home won’t last long. This 1,306 sq ft home features a spacious living room and a large master suite with the master bath recently updated with a walk-in shower. It also has two good-sized secondary bedrooms and a sizable utility room to meet all your storage needs. As a rental property, this home is just waiting for the new owner’s special touch to bring it back to life. Seller is listing the property AS-IS, with no repairs. Currently tenant occupied but will be out by the end of the month. Only CASH offers will be entertained. Please allow 24-hour notice for showings. Professional pictures coming soon.
-
2022-03-07status Pending 672-char remark
Show marketing remark (672 chars)
Don't miss out! This well cared for 3 bed/2 bath home won’t last long. This 1,306 sq ft home features a spacious living room and a large master suite with the master bath recently updated with a walk-in shower. It also has two good-sized secondary bedrooms and a sizable utility room to meet all your storage needs. As a rental property, this home is just waiting for the new owner’s special touch to bring it back to life. Seller is listing the property AS-IS, with no repairs. Currently tenant occupied but will be out by the end of the month. Only CASH offers will be entertained. Please allow 24-hour notice for showings. Professional pictures coming soon.
-
2022-03-01$150,000 Active 672-char remark
Show marketing remark (672 chars)
Don't miss out! This well cared for 3 bed/2 bath home won’t last long. This 1,306 sq ft home features a spacious living room and a large master suite with the master bath recently updated with a walk-in shower. It also has two good-sized secondary bedrooms and a sizable utility room to meet all your storage needs. As a rental property, this home is just waiting for the new owner’s special touch to bring it back to life. Seller is listing the property AS-IS, with no repairs. Currently tenant occupied but will be out by the end of the month. Only CASH offers will be entertained. Please allow 24-hour notice for showings. Professional pictures coming soon.
-
2007-12-19historical
-
2003-03-10$84,000
-
1991-03-18soldstatus $50,350
ⓘ Source: listings_history table (triggers on properties + properties_extension) + one-shot
backfill from property_details.listing_events for pre-trigger history.
Tax reassessment forecast OK · Resets to sale price
- Current annual tax
- $2,256 · $188/mo
- Projected year-2 tax
- $2,256 · $188/mo
- Expected delta
- $0/yr ($0/mo · 0.0%)
ⓘ Screening estimate from a state-policy table — verify with the county assessor before closing.
Climate risk First Street
- Flood 1/10 Low FEMA zone X (unshaded) · 0% chance over 30 yrs
- Wildfire 2/10 Low
- Heat 6/10 Major 7 d/yr ≥107°F today · 19 d/yr by 30 yrs out
- Wind 3/10 Moderate 5% chance of damaging wind over 30 yrs
- Air quality 2/10 Low 1 unhealthy d/yr today · 2 by 30 yrs out
Nearby sold comps map
Loading sold comps map…
Walkable amenities ~0.75 mi
Loading nearby amenities…
Taxation est. · year 1
- Rental income
- $17,486
- − Mortgage interest
- −$9,237
- − Property taxes
- −$2,256
- − Insurance
- −$824
- − Repairs & maintenance
- −$1,399
- − Management
- −$1,399
- − Depreciation
- −$4,797
- Taxable loss
- −$2,426
- Est. tax savings @ 24.0%
- +$582
- After-tax cash flow
- $939/yr
For passive investors: Depreciation is non-cash, so a rental often shows a tax loss while cash-flowing — sheltering income. Rental losses are passive: they offset passive income freely, and up to $25,000/yr can offset ordinary (W-2) income if you actively participate and your MAGI is under $100k (phasing out to $0 by $150k); unused losses carry forward. On sale, claimed depreciation is recaptured at up to 25%, and gains may owe capital-gains tax (a 1031 exchange can defer both). Figures are a year-1 estimate at your 24.0% rate — not tax advice; consult a CPA.
Schools (NCES district)
- District
- Midwest City-Del City
- NCES district ID
- 4019950
- Math proficiency
- 10% ▼ -11.00%
- Reading proficiency
- 17% ▼ -8.00%
- Median HH income
- $45,724
- Composite
- 12.09/100
- National rank
- #9658
- State rank
- #231 of 270 in OK
Livability — Midwest City
- Score
- 71/100
- State rank
- #30
- US rank
- #6637
Category grades
Schools grade is shown separately in the Schools card above.
Census & demographics
- Census place
- Midwest City, OK
- County
- Oklahoma County · 771,644 people
- City population
- 57,386
- Metro
- Oklahoma City, OK
- Population (ZIP)
- 21,476
- Household income
- $71,189
- Rent vs Own
- Severe rent burden
- 378.0
Population outlook (Oklahoma County) Hauer SSP2
- Today (2025)
- 911,875 people
- By 2030
- 982,413 · +7.7%
- By 2040
- 1,130,468 · +24.0%
- By 2050
- 1,288,422 · +41.3%
- By 2075
- 1,711,482 · +87.7%
- By 2100
- 2,088,448 · +129.0%
Race, ethnicity, and origin ACS 2023
- Neighborhood character
- Diverse neighborhood (Simpson 0.60)
- Race & ethnicity
- White 60% Black 18% Two or more races 14% Hispanic / Latino 7% Asian 2% Native American 2%
- Hispanic origin (detail)
- Mexican 6%
- Common ancestry
- Lithuanian 2% Slovak 2% Italian 2%
- Foreign-born
- 3% · Canada
- Languages at home
- 95% English-only · Spanish 3% Tagalog/Filipino 1%
Political lean MEDSL · Oklahoma
- 2024 margin
- Toss-up / Even · D 48.0% · R 49.7% · Other 2.3%
- 2008→2024 swing
- +15.1pp toward D · 2008: -16.8pp · 2024: -1.7pp
- All cycles
- 2024: R+1.7 2020: R+1.1 2016: R+10.5 2012: R+16.7 2008: R+16.8
Not yet ingested
- Civics
- —
Market trends
- HPI YoY
- ▼ -65.22%
- Current HPI
- 245.8385
- Rent YoY
- ▲ 5.73%
- Metro
- Oklahoma City, OK
- State GDP YoY
- ▲ 1.55%
- F500 in state
- 6
Industry mix (Fortune 500 HQ in OK)
| Industry | F500 HQs | Revenue |
|---|---|---|
| Energy | 3 | $48B |
|
||
Price history
+237.4% since first listed9 events — show timeline
- 2026-04-09 Listed $169,900 MLSOK
- 2022-10-03 Sold (Public Records) $2,641,000 Public Records
- 2022-04-05 Sold (Public Records) $155,500 Public Records
- 2022-04-04 Sold (MLS) $155,200 MLSOK
- 2022-03-07 Pending — MLSOK
- 2022-03-01 Listed $150,000 MLSOK
- 2007-12-19 Listing Removed — MLSOK
- 2003-03-10 Listed $84,000 MLSOK
- 1991-03-18 Sold (Public Records) $50,350 Public Records
Property tax history
+6.0%/yrLatest (2025): $2,256 · -5.1% YoY. Source: county tax records.
Cash-flow waterfall
monthlySold comps — $/sqft
last 12 mo · ≤1 miLoading sold comps…