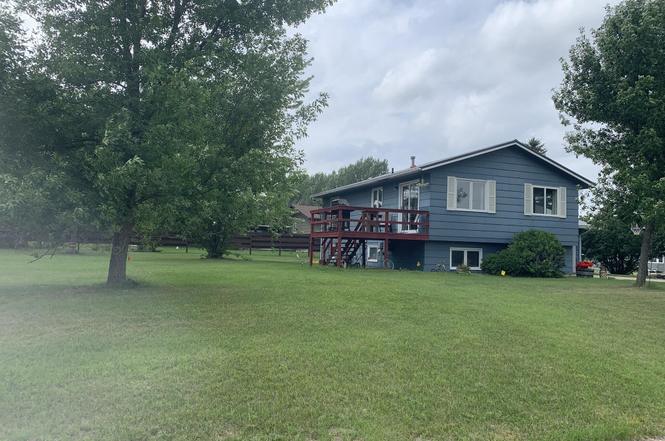
807 6th St · Walhalla, ND
Flood risk 1/10 · Minimal
- FEMA flood zone
- X (unshaded)
- Chance of flooding over 30 yrs
- 0.0%
- Est. flood insurance / yr
- $473 – $860
Fire risk 6/10 · Moderate
- Est. fire insurance / yr
- $1,289 – $2,393
Heat risk 1/10 · Minimal
- Hot days now (above 94°F)
- 7 days/yr
- Hot days in 30 yrs
- 12 days/yr
Wind risk 1/10 · Minimal
- Chance of severe wind over 30 yrs
- —
Air-quality risk 3/10 · Minor
- Unhealthy air days now
- 4 days/yr
- Unhealthy air days in 30 yrs
- 4 days/yr
Risk factors via First Street. Map © Google.
Why this score? — see what drove the C- grade
The composite is a weighted blend of 9 inputs, each scored 0–100. Each bar is that input's sub-score; the figure is the points it added to the 100-point composite (weight × sub-score).
- Cash flow +17.5/30.0
- ARV discount +7.5/15.0
- DSCR +5.5/10.0
- Schools +5.3/10.0
- Appreciation +5.0/10.0
- 1% rule +3.8/10.0
- Livability +3.2/5.0
- Rent growth +2.5/5.0
- Condition / age +2.5/5.0
$120,000
🖨 Deal sheet 📄 Offer letter ✓ Due diligence
Key facts
- Nearby trails
- Steps away from park
- Corner lot
Tags
Property features AI
Exterior
- Parking: Attached garage with garage door opener (1 garage space)
- Utilities: Public water; Natural gas available
- Home design: Single family residence; Residential property
- Construction: Brick construction; Block foundation; Built area includes 932 above-grade finished square footage
- Exterior features: Deck
Interior
- Bathrooms: 1 full bathroom
- Heating & cooling: Forced air heating; Natural gas heating; Central cooling
- Interior features: 10 total rooms
Neighborhood map
What this means for you Summary
Snapshot
- This is a 4-bed/1.0-bath other listed at $120k.
Deal economics
- At list price, monthly cash flow is $93 ($1k/yr) — positive.
- The deal already cash-flows at list — no discount required.
- To meet the 1% rule (rent ≥ 1% of price), the offer needs to be $106k (11.9% below list).
- Recommended offer: $106k (12.0% below list) — sets the bar for market timing.
Location & tenants
- Location reads 64/100 on livability (#206 in ND) — a middle-class / working-renter tenant base. Strengths: cost of living A+, housing A+; Watch: crime C-, schools D+, health & safety D+.
- North Border 100 (rural): math 60% / reading 60% proficiency, ranked #11 of 169 in ND (top 6%) — acceptable for families but not a draw, mixed tenant base, ~2y average lease.
- Market conditions: 5 active listings in the ZIP; 2 units permitted in Pembina County in 2024 (0 in 5+ unit buildings).
Forward outlook
- In year one you build about $4k of equity ($830 loan paydown + $4k appreciation (3.0% local appreciation)).
- Pembina County population projected at -23% by 2050 — secular population decline; favor cash flow + early exit over multi-decade hold.
- At projected returns (3.0% appreciation + 3.0% rent growth), your $34k cash investment doubles in ~6 years — after that, you're playing with house money.
- By year 8, paydown + projected appreciation supports a ~$33k cash-out refi (75% LTV) — recoverable capital for the next deal without selling this one.
Negotiation context
- It's been on market 315 days — a 12% lower offer ($106k) is reasonable based on typical stale-listing flexibility.
- 2 sale attempts; this cycle's ask has dropped $22k (16%) from the opening price — seller is motivated, your offer sets the floor, not the list.
Risks & watch-outs
- Climate carrying-cost: major wildfire risk — expect insurance premiums to compound above CPI over the hold.
Questions for the listing agent
- It's been on market 315 days. Have you received any prior offers? Is the seller open to a 12% concession, seller financing, or rate buy-down credit?
- Why hasn't it sold? Are there any deal-killer items the seller is aware of (foundation, flood, title, zoning, code violations)?
- Is there a deadline driving the sale (1031 exchange, divorce, estate, relocation)? That informs how much negotiation room exists.
- Schools are D-rated, which usually means shorter tenancies and higher turnover. Who's the typical renter profile here, and what's been the actual vacancy rate?
- What's the average days-on-market for RENTAL listings here right now (not sales)? A rising rental-DOM trend means longer vacancies and softer asking-rent achievability than the comps imply.
- What's the recent tenant-quality profile in this submarket — average credit score on applications, eviction rate, late-payment / NSF rate, and stable-employment percentage? A property-management company in the area should have these aggregated.
- How much new for-sale + rental construction is in the pipeline within 1–3 miles? Heavy new supply typically softens prices + rents 12–24 months out; constrained supply supports both.
Investment metrics
- 1% rule
- 0.88% ✗
- Cap rate
- 7.22%
- Cash-on-cash
- 3.32%
- DSCR
- 1.15
- GRM
- 9.5
CMA / ARV
No comps found within radius.
Projected returns pro-forma
3.0% appreciation · 3.0% rent growth · sell at horizon
- IRR
- 10.6%
- Equity multiple
- 1.61×
- Total profit
- $20,334
- Equity at exit
- $53,957
- IRR
- 12.8%
- Equity multiple
- 2.91×
- Total profit
- $64,065
- Equity at exit
- $83,154
Cash invested: $33,600 (down + closing). Projections, not guarantees.
Landlord ↔ Tenant lean methodology
- Overall (STATE)
- 82 Strongly Landlord-Friendly
- State North Dakota
- 82 Strongly Landlord-Friendly · R+20
- County
- — inherits STATE
- City
- — inherits STATE
ZIP-level market 58282
- Active inventory
- 5
- Price-to-rent
- 9.5×
Monthly cashflow live
- Estimated rent
- $1,058 medium interval (Pro) →
- Mortgage (P&I)
- −$629
- Tax from tax record
- −$63 /mo · $759/yr
- Insurance
- −$50
- HOA
- −$0
- Vacancy / Maint / Mgmt
- −$222
- Net cashflow
- $93
Break-even live
UW: 25.0% down · 7.5% · 30yr · 1.5% tax · 5.0% vac · 8.0% maint · 8.0% mgmt
Financing live
Cash to close
- Down payment
- $30,000
- Closing costs
- $3,600
- Reserves months
- —
- Total cash needed
- —
Loan-product check · same deal, 3 products live
Conventional
25% down · 7.5% · 30yr
- Down + closing
- —
- Monthly P&I
- —
- Monthly cashflow
- —
- DSCR
- —
- Eligible?
- —
Personal DTI + credit; lowest rate.
DSCR
20% down · 8.5% · 30yr
- Down + closing
- —
- Monthly P&I
- —
- Monthly cashflow
- —
- DSCR
- —
- Eligible?
- —
No personal income docs; deal must DSCR.
Hard money
10% down · 12.0% · 12mo
- Down + closing
- —
- Monthly P&I
- —
- Monthly cashflow
- —
- DSCR
- —
- Eligible?
- —
Short-term bridge; refi at stabilization.
Listing history 20 events
-
2026-06-17status $120,000 Pending 315 DOM
-
2026-06-17days on market $120,000 Active Under Contract 315 DOM
-
2026-06-16days on market $120,000 Active Under Contract 314 DOM
-
2026-06-15days on market $120,000 Active Under Contract 313 DOM
-
2026-06-13days on market $120,000 Active Under Contract 311 DOM
-
2026-06-12days on market $120,000 Active Under Contract 310 DOM
-
2026-06-09days on market $120,000 Active Under Contract 307 DOM
-
2026-06-09status $120,000 Active Under Contract 306 DOM
-
2026-06-08days on market $120,000 Active 306 DOM
-
2026-06-07days on market $120,000 Active 305 DOM
-
2026-06-05days on market $120,000 Active 303 DOM
-
2026-06-04days on market $120,000 Active 301 DOM
-
2026-06-02days on market $120,000 Active 300 DOM
-
2026-06-01days on market $120,000 Active 299 DOM
-
2026-05-31days on market $120,000 Active 298 DOM
-
2026-04-01status Active
-
2026-03-23historical Active Under Contract
-
2026-03-10price $120,000
-
2026-01-02price $125,000
-
2025-08-05$142,500 Active
ⓘ Source: listings_history table (triggers on properties + properties_extension) + one-shot
backfill from property_details.listing_events for pre-trigger history.
Tax reassessment forecast ND · Resets to sale price
- Current annual tax
- $759 · $63/mo
- Projected year-2 tax
- $1,176 · $98/mo
- Expected delta
- +$417/yr (+$35/mo · 54.9%)
ⓘ Screening estimate from a state-policy table — verify with the county assessor before closing.
Climate risk First Street
- Flood 1/10 Low FEMA zone X (unshaded) · 0% chance over 30 yrs
- Wildfire 6/10 Major
- Heat 1/10 Low 7 d/yr ≥94°F today · 12 d/yr by 30 yrs out
- Wind 1/10 Low
- Air quality 3/10 Moderate 4 unhealthy d/yr today · 4 by 30 yrs out
Nearby sold comps map
Loading sold comps map…
Walkable amenities ~0.75 mi
Loading nearby amenities…
Taxation est. · year 1
- Rental income
- $12,691
- − Mortgage interest
- −$6,722
- − Property taxes
- −$759
- − Insurance
- −$600
- − Repairs & maintenance
- −$1,015
- − Management
- −$1,015
- − Depreciation
- −$3,491
- Taxable loss
- −$912
- Est. tax savings @ 24.0%
- +$219
- After-tax cash flow
- $1,334/yr
For passive investors: Depreciation is non-cash, so a rental often shows a tax loss while cash-flowing — sheltering income. Rental losses are passive: they offset passive income freely, and up to $25,000/yr can offset ordinary (W-2) income if you actively participate and your MAGI is under $100k (phasing out to $0 by $150k); unused losses carry forward. On sale, claimed depreciation is recaptured at up to 25%, and gains may owe capital-gains tax (a 1031 exchange can defer both). Figures are a year-1 estimate at your 24.0% rate — not tax advice; consult a CPA.
Schools (NCES district)
- District
- North Border 100
- NCES district ID
- 3800054
- Math proficiency
- 60% ▲ 15.00%
- Reading proficiency
- 60% ▲ 10.00%
- Median HH income
- $52,082
- Composite
- 52.88/100
- National rank
- #3288
- State rank
- #11 of 169 in ND
Livability — Walhalla
- Score
- 64/100
- State rank
- #206
- US rank
- #14330
Category grades
Schools grade is shown separately in the Schools card above.
Census & demographics
- Census place
- Walhalla, ND
- Population (ZIP)
- 1,240
Population outlook (Pembina County) Hauer SSP2
- Today (2025)
- 6,414 people
- By 2030
- 6,060 · -5.5%
- By 2040
- 5,383 · -16.1%
- By 2050
- 4,925 · -23.2%
- By 2075
- 5,025 · -21.7%
- By 2100
- 6,293 · -1.9%
Race, ethnicity, and origin ACS 2023
- Neighborhood character
- Predominantly White (84%)
- Race & ethnicity
- White 84% Two or more races 7% Native American 6% Hispanic / Latino 5% Pacific Islander 2%
- Hispanic origin (detail)
- Mexican 4%
- Common ancestry
- Portuguese 16% Lithuanian 11% Slovak 2%
- Foreign-born
- 5% · Canada
- Languages at home
- 98% English-only · Other Asian/Pacific 1% German/W. Germanic 1%
Political lean MEDSL · Pembina
- 2024 margin
- Solid R (+53.3) · D 22.8% · R 76.1% · Other 1.1%
- 2008→2024 swing
- -46.4pp toward R · 2008: -6.9pp · 2024: -53.3pp
- All cycles
- 2024: R+53.3 2020: R+50.2 2016: R+49.2 2012: R+20.1 2008: R+6.9
Not yet ingested
- Civics
- —
Market trends
- HPI YoY
- —
- Current HPI
- —
- Rent YoY
- —
- Metro
- —
- State GDP YoY
- ▲ 2.09%
- F500 in state
- 2
Industry mix (Fortune 500 HQ in ND)
| Industry | F500 HQs | Revenue |
|---|---|---|
| Utilities / Construction | 1 | $6B |
|
||
Price history
-15.8% since first listed5 events — show timeline
- 2026-04-01 Relisted — GFAAR
- 2026-03-23 Contingent — GFAAR
- 2026-03-10 Price Changed $120,000 GFAAR
- 2026-01-02 Price Changed $125,000 GFAAR
- 2025-08-05 Listed $142,500 GFAAR
Property tax history
-4.3%/yrLatest (2024): $759 · -31.7% YoY. Source: county tax records.
Cash-flow waterfall
monthlySold comps — $/sqft
last 12 mo · ≤1 miLoading sold comps…