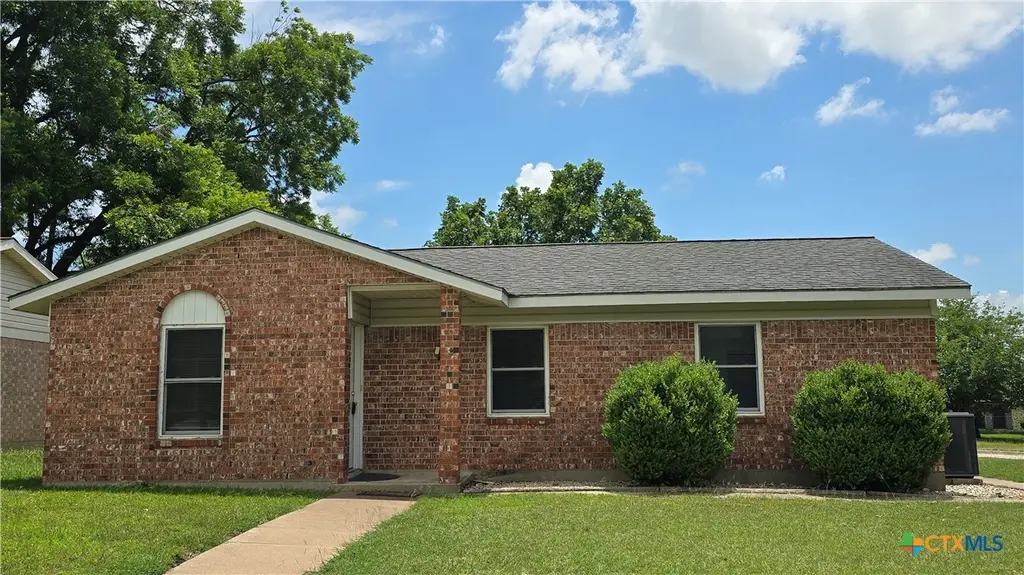
1301 Paseo Del Plata · Temple, TX
Flood risk 1/10 · Minimal
- FEMA flood zone
- X (unshaded)
- Chance of flooding over 30 yrs
- 0.0%
- Est. flood insurance / yr
- $507 – $1,088
Fire risk 4/10 · Minor
- Est. fire insurance / yr
- $1,222 – $2,270
Heat risk 8/10 · Major
- Hot days now (above 108°F)
- 7 days/yr
- Hot days in 30 yrs
- 24 days/yr
Wind risk 6/10 · Moderate
- Chance of severe wind over 30 yrs
- 70.0%
Air-quality risk 2/10 · Minimal
- Unhealthy air days now
- 0 days/yr
- Unhealthy air days in 30 yrs
- 1 days/yr
Risk factors via First Street. Map © Google.
Why this score? — see what drove the D+ grade
The composite is a weighted blend of 9 inputs, each scored 0–100. Each bar is that input's sub-score; the figure is the points it added to the 100-point composite (weight × sub-score).
- Cash flow +15.1/30.0
- ARV discount +12.8/15.0
- 1% rule +5.3/10.0
- DSCR +4.6/10.0
- Livability +3.8/5.0
- Schools +2.7/10.0
- Condition / age +2.5/5.0
- Rent growth +2.3/5.0
- Appreciation +0.0/10.0
$150,000
🖨 Deal sheet (PDF) 📄 Offer letter ✓ Due diligence
Listing remarks
Investment spectacular!! Great 3/2 with upgrades throughout the home located in convenient established area with Temple schools. Split floorplan with room for the whole family, plus two car garage on a corner cul-d-sac lot. Solid rental history and house is in great shape with numerous upgrades throughout. Foundation has settling with a repair estimate provided and work can be completed prior to sale. Take a look today.
Key facts
- 9,509 sq ft lot
- 2 garage spots
- Built 1972
Property features AI
Finance
- HOA & community: Curbs
Exterior
- Parking: 2-car garage
- Security: Smoke detector(s)
- Utilities: Public water; Public sewer; Cable available
- Home design: Single-story home; Faces northeast; Resale property; Located on a cul-de-sac with mature trees and level yard; City lot with asphalt city street frontage; Less than quarter acre
- Construction: Masonry construction; Composition/shingle roof; Slab foundation; Year built per assessor
- Exterior features: Storage; Workshop; Chain link fencing
Interior
- Kitchen: Dishwasher; Electric range; Range; Electric water heater
- Bedrooms: Family room (listed as a room type)
- Flooring: Carpet; Hardwood; Tile
- Bathrooms: 2 full bathrooms
- Heating & cooling: Central heating (electric); Central air conditioning (electric, one unit)
- Interior features: All bedrooms on main level; Eat-in kitchen; Multiple closets; Storage; Breakfast bar; Kitchen open to family room; Solid surface counters
- Laundry & utility: Washer hookup; Electric dryer hookup; Laundry in garage
Neighborhood map
What this means for you Summary
Snapshot
- This is a 3-bed/2.0-bath single-family listed at $150k.
Deal economics
- At list price, monthly cash flow is $50 ($595/yr) — positive.
- The deal already cash-flows at list — no discount required.
- Meets the 1% rule at list price ($2k rent vs $150k).
- Recommended offer: $148k (1.5% below list) — sets the bar for market timing.
- Cap rate 6.7% vs local median 3.6% in Temple — top-decile yield for the area; either an underpriced asset or a hidden risk that comps aren't pricing in. Stress-test before assuming the spread holds.
Location & tenants
- Location reads 75/100 on livability (#122 in TX, #3,814 nationally) — a middle-class / working-renter tenant base. Strengths: cost of living A+, housing A+, health & safety A+; Watch: schools C-, commute C-, crime D+.
- Temple ISD (urban): math 32% / reading 31% proficiency, ranked #590 of 826 in TX (top 71%) — families likely to look elsewhere, expect single-tenant / working-renter base with shorter leases; 66% free/reduced lunch — lower-income household profile, screen leases tightly.
- Market conditions: Rents soft (-0.8%/yr); 1126 active listings in the ZIP; 40 comparable units currently listed for rent nearby; rentals lingering (median 46d on market — plan ~5-8 weeks vacancy on turnover, expect pricing pressure); 50% of comp listings sitting > 30 days — soft ceiling on asking rent; solid renter incomes; 3,222 units permitted in Bell County in 2024 (246 in 5+ unit buildings).
Forward outlook
- Local home prices are declining (-3.0%/yr); year-one equity from $1k of loan paydown is wiped out by about $4k of value loss. Plan a longer hold.
- Bell County population projected at +21% by 2050 — long-run rental-demand tailwind backs the buy-and-hold thesis.
Negotiation context
- It's been on market 18 days — a 2% lower offer ($148k) is reasonable based on typical stale-listing flexibility.
Risks & watch-outs
- Watch-outs: property tax is 2.5% of price.
- Climate carrying-cost: major wind risk, 70% chance of damaging wind over 30y; extreme-heat days projected 7→24/yr by 2055 (HVAC capex compounding) — expect insurance premiums to compound above CPI over the hold.
Questions for the listing agent
- Built in 1972 — when were the roof, HVAC, electrical panel, plumbing, and water heater last replaced?
- Property tax is high relative to price — has the assessment been appealed recently, and will the sale trigger a re-assessment?
- Is there a deadline driving the sale (1031 exchange, divorce, estate, relocation)? That informs how much negotiation room exists.
- Crime grade is D in this area — have there been break-ins, vandalism, or insurance claims at this property in the last 3 years? What carrier currently insures it and at what premium?
- The area grade is low — what's the realistic commute time and amenity access for the typical tenant pool here? Any planned neighborhood developments (good or bad) we should know about?
- What's the average days-on-market for RENTAL listings here right now (not sales)? A rising rental-DOM trend means longer vacancies and softer asking-rent achievability than the comps imply.
- What's the recent tenant-quality profile in this submarket — average credit score on applications, eviction rate, late-payment / NSF rate, and stable-employment percentage? A property-management company in the area should have these aggregated.
- How much new for-sale + rental construction is in the pipeline within 1–3 miles? Heavy new supply typically softens prices + rents 12–24 months out; constrained supply supports both.
Investment metrics
- 1% rule
- 1.03% ✓
- Cap rate
- 6.69%
- Cash-on-cash
- 1.42%
- DSCR
- 1.06
- GRM
- 8.1
CMA / ARV
- ARV (on-the-fly)
- $169,944
- Comps found
- 9
Show comp detail 9 sales within ~0.75 mi
| Address | Dist | Beds/Ba | Sqft | Sold | Price | $/sf | Match |
|---|---|---|---|---|---|---|---|
| 4706 Stone Ridge Dr | 0.12mi | 3/2.0 | 1,221 (+5%) | 13mo | $175,000 | $143 | 76 |
| 4612 Canyon Rdg | 0.12mi | 3/2.0 | 1,317 (+13%) | 1mo | $200,000 | $152 | 72 |
| 1318 Paseo Del Cobre | 0.08mi | 3/2.0 | 1,274 (+10%) | 13mo | $165,000 | $130 | 70 |
| 1825 Linwood Rd | 0.62mi | 3/1.0 | 1,186 (+2%) | 7mo | $167,500 | $141 | 58 |
| 1709 Avalon Rd | 0.54mi | 3/2.0 | 1,263 (+8%) | 6mo | $104,000 | $82 | 56 |
| 2007 Stratford Dr | 0.55mi | 3/2.0 | 1,279 (+10%) | 6mo | $215,000 | $168 | 53 |
| 407 Sterling Manor Ct | 0.55mi | 3/2.0 | 1,323 (+14%) | 1mo | $199,900 | $151 | 50 |
| 3906 Lancelot Ln | 0.71mi | 3/2.0 | 1,258 (+8%) | 8mo | $205,000 | $163 | 47 |
| 3901 Rosemary Ln | 0.73mi | 4/2.0 (+1) | 1,334 (+15%) | 2mo | $195,000 | $146 | 35 |
Match score weights: distance 35% · size 25% · config 20% · recency 20%. Top-matched comps best support the ARV.
Projected returns pro-forma
-3.0% appreciation · 0.0% rent growth · sell at horizon
- IRR
- -17.8%
- Equity multiple
- 0.39×
- Total profit
- $-25,555
- Equity at exit
- $22,365
- IRR
- -18.2%
- Equity multiple
- 0.16×
- Total profit
- $-35,198
- Equity at exit
- $12,969
Cash invested: $42,000 (down + closing). Projections, not guarantees.
Landlord ↔ Tenant lean methodology
- Overall (STATE)
- 87 Strongly Landlord-Friendly
- State Texas
- 87 Strongly Landlord-Friendly · R+5
- County
- — inherits STATE
- City
- — inherits STATE
ZIP-level market 76502
- Rents YoY
- -0.8%
- Active inventory
- 1126
- Price-to-rent
- 8.1×
Monthly cashflow live
- Estimated rent
- $1,539 high interval (Pro) →
- Mortgage (P&I)
- −$787
- Tax from tax record
- −$317 /mo · $3,806/yr
- Insurance
- −$62
- HOA
- −$0
- Vacancy / Maint / Mgmt
- −$323
- Net cashflow
- $50
Break-even live
Sensitivity live
| Price | -10% $135 | -5% $92 | +0% $50 | +5% $7 | +10% $-35 |
|---|---|---|---|---|---|
| Rent | -10% $-72 | -5% $-11 | +0% $50 | +5% $110 | +10% $171 |
| Rate | -1.0pp $125 | -0.5pp $88 | base $50 | +0.5pp $11 | +1.0pp $-29 |
UW: 25.0% down · 7.5% · 30yr · 1.5% tax · 5.0% vac · 8.0% maint · 8.0% mgmt
Financing live
Cash to close
- Down payment
- $37,500
- Closing costs
- $4,500
- Reserves months
- —
- Total cash needed
- —
Loan-product check · same deal, 3 products live
Conventional
25% down · 7.5% · 30yr
- Down + closing
- —
- Monthly P&I
- —
- Monthly cashflow
- —
- DSCR
- —
- Eligible?
- —
Personal DTI + credit; lowest rate.
DSCR
20% down · 8.5% · 30yr
- Down + closing
- —
- Monthly P&I
- —
- Monthly cashflow
- —
- DSCR
- —
- Eligible?
- —
No personal income docs; deal must DSCR.
Hard money
10% down · 12.0% · 12mo
- Down + closing
- —
- Monthly P&I
- —
- Monthly cashflow
- —
- DSCR
- —
- Eligible?
- —
Short-term bridge; refi at stabilization.
Rent comps 40 comps
| Address | Beds | Baths | Sqft | Rent | $/sqft | DOM | Units | Dist |
|---|---|---|---|---|---|---|---|---|
| 1409 Calle Nogal St Temple, TX | 2.0 | 1.0 | 780 | $895 | $1.15 | 15d | 1 | 0.08mi |
| 1416 Paseo Del Oro Temple, TX | 1.0–2.0 | 1.0 | 602 | $995 | $1.65 | 15d | 2 | 0.17mi |
| 1319 Calle de Bronce Unit B Temple, TX | 3.0 | 2.0 | 1400 | $1,600 | $1.14 | 15d | 1 | 0.22mi |
| 1213 Waters Dairy Rd Temple, TX | 1.0–2.0 | 1.0–2.0 | 902 | $1,322 | $1.46 | 15d | 21 | 0.23mi |
| 4609 High Pointe Dr Temple, TX | 3.0 | 2.0 | 1152 | $1,545 | $1.34 | 45d | 1 | 0.28mi |
| 802 Hartrick Cir Temple, TX | 3.0 | 2.0 | 1400 | $1,645 | $1.18 | 45d | 1 | 0.37mi |
| 4706 Hartrick Bluff Rd Temple, TX | 3.0 | 2.0 | 1257 | $1,550 | $1.23 | 45d | 1 | 0.38mi |
| 615B Kacie Dr Unit B Temple, TX | 3.0 | 2.0 | 1300 | $1,295 | $1.00 | 25d | 1 | 0.46mi |
| 614 Paseo del Plata Unit A Temple, TX | 3.0 | 2.0 | 1316 | $1,350 | $1.03 | 45d | 1 | 0.46mi |
| 615 Kacie Dr Temple, TX | 3.0 | 2.0 | 1300 | $1,295 | $1.00 | 25d | 1 | 0.47mi |
| 4802 Silver Wood Ct Temple, TX | 3.0 | 2.0 | 1255 | $1,550 | $1.24 | 25d | 1 | 0.47mi |
| 5005 Warwicke Dr Temple, TX | 3.0 | 2.0 | 1468 | $1,850 | $1.26 | 45d | 1 | 0.48mi |
| 602 Kacie Dr Unit A Temple, TX | 3.0 | 2.0 | 1340 | $1,395 | $1.04 | 15d | 1 | 0.49mi |
| Karey Dr Unit B Temple, TX | 3.0 | 2.0 | 1450 | $1,395 | $0.96 | 25d | 1 | 0.50mi |
| 1613 Avalon Rd Temple, TX | 3.0 | 2.0 | 1388 | $1,650 | $1.19 | 25d | 1 | 0.50mi |
| 1914 Buckskin Trl Temple, TX | 3.0 | 2.0 | 1406 | $1,675 | $1.19 | 45d | 1 | 0.53mi |
| 516 Karey Dr Unit A Temple, TX | 3.0 | 2.0 | 988 | $2,100 | $2.13 | 45d | 1 | 0.53mi |
| 3914 S 31st St Temple, TX | 3.0 | 2.0 | 1262 | $1,250 | $0.99 | 15d | 1 | 0.54mi |
| 505 Kacie Dr Temple, TX | 3.0 | 2.0 | 1316 | $1,425 | $1.08 | 45d | 1 | 0.55mi |
| 504 Karey Dr Unit A Temple, TX | 3.0 | 2.0 | 1316 | $1,275 | $0.97 | 45d | 1 | 0.56mi |
| 4615 Brutus Ln Temple, TX | 3.0 | 2.0 | 1350 | $1,295 | $0.96 | 15d | 1 | 0.57mi |
| 4521 Brutus Ln Unit B Temple, TX | 3.0 | 2.0 | 1350 | $1,395 | $1.03 | 45d | 1 | 0.58mi |
| 4403 Brutus Ln Unit B Temple, TX | 3.0 | 2.0 | 1316 | $1,400 | $1.06 | 25d | 1 | 0.60mi |
| 3906 Mariam Rd Temple, TX | 3.0 | 2.0 | 1301 | $1,400 | $1.08 | 25d | 1 | 0.60mi |
| 3809 Lancelot Ln Temple, TX | 3.0 | 2.0 | 1397 | $1,645 | $1.18 | 45d | 1 | 0.71mi |
| 212A Andy Ln Temple, TX | 3.0 | 2.0 | 1300 | $1,395 | $1.07 | 45d | 1 | 0.75mi |
| 507 Marlandwood Rd Temple, TX | 2.0 | 2.0 | 1267 | $1,699 | $1.34 | 45d | 1 | 0.75mi |
| 208A Andy Ln Temple, TX | 3.0 | 2.0 | 1300 | $1,395 | $1.07 | 45d | 1 | 0.76mi |
| 2705 San Jacinto Rd Temple, TX | 3.0 | 2.0 | 1313 | $1,495 | $1.14 | 45d | 1 | 0.77mi |
| 3608 S 31st St Temple, TX | 1.0–3.0 | 1.0–2.0 | 1000 | $1,135 | $1.14 | 15d | 2 | 0.78mi |
| 764 Marlandwood Rd Temple, TX | 1.0–3.0 | 1.0–2.0 | 975 | $1,655 | $1.70 | 15d | 33 | 0.78mi |
| 2709 San Jacinto Rd Temple, TX | 3.0 | 2.0 | 1221 | $1,550 | $1.27 | 25d | 1 | 0.78mi |
| 5707 Blackstone Dr Temple, TX | 3.0 | 2.0 | 1470 | $1,795 | $1.22 | 45d | 1 | 0.82mi |
| 2810 Daniel Boone Trl Temple, TX | 4.0 | 2.0 | 1228 | $1,372 | $1.12 | 45d | 1 | 0.89mi |
| 911 Ferrara Cir Unit A Temple, TX | 3.0 | 2.0 | 1215 | $1,350 | $1.11 | 15d | 1 | 0.91mi |
| 3506 S 5th St Temple, TX | 1.0–3.0 | 1.0–2.0 | 1054 | $1,885 | $1.79 | 15d | 23 | 0.95mi |
| 623 Azalea Dr Temple, TX | 1.0–3.0 | 1.0–2.0 | 1114 | $1,899 | $1.70 | 15d | 13 | 0.98mi |
| 1053 Cavendish Ave Temple, TX | 2.0 | 2.0 | 1007 | $1,295 | $1.29 | 45d | 1 | 1.01mi |
| 3323 Kickapoo Dr Temple, TX | 2.0 | 2.0 | 1007 | $1,400 | $1.39 | 45d | 1 | 1.03mi |
| 3306 S 13th St Temple, TX | 2.0 | 2.0 | 1007 | $1,350 | $1.34 | 45d | 1 | 1.06mi |
Listing history 12 events
-
2026-06-22days on market $150,000 Active 18 DOM
-
2026-06-18days on market $150,000 Active 15 DOM
-
2026-06-17days on market $150,000 Active 14 DOM
-
2026-06-16days on market $150,000 Active 13 DOM
-
2026-06-15days on market $150,000 Active 12 DOM
-
2026-06-14days on market $150,000 Active 10 DOM
-
2026-06-10days on market $150,000 Active 7 DOM
-
2026-06-09days on market $150,000 Active 6 DOM
-
2026-06-08days on market $150,000 Active 5 DOM
-
2026-06-07days on market $150,000 Active 4 DOM
-
2026-06-03remarks 423-char remark
-
2026-06-03$150,000 Active 1 DOM
ⓘ Source: listings_history table (triggers on properties + properties_extension) + one-shot
backfill from property_details.listing_events for pre-trigger history.
Tax reassessment forecast TX · Resets to sale price
- Current annual tax
- $3,806 · $317/mo
- Projected year-2 tax
- $3,806 · $317/mo
- Expected delta
- $0/yr ($0/mo · 0.0%)
ⓘ Screening estimate from a state-policy table — verify with the county assessor before closing.
Climate risk First Street
- Flood 1/10 Low FEMA zone X (unshaded) · 0% chance over 30 yrs
- Wildfire 4/10 Moderate
- Heat 8/10 Severe 7 d/yr ≥108°F today · 24 d/yr by 30 yrs out
- Wind 6/10 Major 70% chance of damaging wind over 30 yrs
- Air quality 2/10 Low 0 unhealthy d/yr today · 1 by 30 yrs out
Nearby sold comps map
Loading sold comps map…
Walkable amenities ~0.75 mi
Loading nearby amenities…
Taxation est. · year 1
- Rental income
- $18,469
- − Mortgage interest
- −$8,402
- − Property taxes
- −$3,806
- − Insurance
- −$750
- − Repairs & maintenance
- −$1,477
- − Management
- −$1,477
- − Depreciation
- −$4,364
- Taxable loss
- −$1,808
- Est. tax savings @ 24.0%
- +$434
- After-tax cash flow
- $1,029/yr
For passive investors: Depreciation is non-cash, so a rental often shows a tax loss while cash-flowing — sheltering income. Rental losses are passive: they offset passive income freely, and up to $25,000/yr can offset ordinary (W-2) income if you actively participate and your MAGI is under $100k (phasing out to $0 by $150k); unused losses carry forward. On sale, claimed depreciation is recaptured at up to 25%, and gains may owe capital-gains tax (a 1031 exchange can defer both). Figures are a year-1 estimate at your 24.0% rate — not tax advice; consult a CPA.
Schools (NCES district)
- District
- Temple ISD
- NCES district ID
- 4842330
- Math proficiency
- 32% ▼ -8.00%
- Reading proficiency
- 31% ▼ -4.00%
- Median HH income
- $43,120
- Composite
- 26.8/100
- National rank
- #7123
- State rank
- #590 of 826 in TX
Livability — Temple
- Score
- 75/100
- State rank
- #122
- US rank
- #3814
Category grades
Schools grade is shown separately in the Schools card above.
Census & demographics
- Census place
- Temple, TX
- County
- Bell County · 345,090 people
- City population
- 96,587
- Metro
- Killeen-Temple, TX
- Population (ZIP)
- 52,669
- Household income
- $82,088
- Rent vs Own
- Severe rent burden
- 1890.0
Population outlook (Bell County) Hauer SSP2
- Today (2025)
- 371,114 people
- By 2030
- 389,104 · +4.8%
- By 2040
- 420,592 · +13.3%
- By 2050
- 447,779 · +20.7%
- By 2075
- 499,130 · +34.5%
- By 2100
- 505,680 · +36.3%
Race, ethnicity, and origin ACS 2023
- Neighborhood character
- Diverse neighborhood (Simpson 0.59)
- Race & ethnicity
- White 58% Hispanic / Latino 26% Two or more races 15% Black 9% Asian 3%
- Hispanic origin (detail)
- Mexican 21% Puerto Rican 2%
- Common ancestry
- Italian 2% Slovak 2% Serbian 1%
- Foreign-born
- 7% · Canada, South Korea, China
- Languages at home
- 86% English-only · Spanish 10% Other Indo-European 1% Korean 1%
Political lean MEDSL · Bell
- 2024 margin
- R (+16.2) · D 41.3% · R 57.6% · Other 1.1%
- 2008→2024 swing
- -6.5pp toward R · 2008: -9.8pp · 2024: -16.2pp
- All cycles
- 2024: R+16.2 2020: R+8.5 2016: R+15.1 2012: R+16.4 2008: R+9.8
Not yet ingested
- Civics
- —
Market trends
- HPI YoY
- ▼ -216.80%
- Current HPI
- 166.927
- Rent YoY
- ▼ -0.79%
- Metro
- Killeen-Temple, TX
- State GDP YoY
- ▲ 3.95%
- F500 in state
- 110
Industry mix (Fortune 500 HQ in TX)
| Industry | F500 HQs | Revenue |
|---|---|---|
| Energy | 16 | $1,198B |
|
||
| Technology | 5 | $198B |
|
||
| Engineering / Construction | 4 | $72B |
|
||
| Energy Services | 3 | $60B |
|
||
| Utilities | 3 | $41B |
|
||
| Healthcare | 2 | $330B |
|
||
Price history
3 events — show timeline
- 2026-06-03 Listed $150,000 CTXMLS
- 1996-12-13 Sold (Public Records) — Public Records
- 1986-09-05 Sold (Public Records) — Public Records
Property tax history
+6.0%/yrLatest (2025): $3,806 · +2.1% YoY. Source: county tax records.
Cash-flow waterfall
monthlySold comps — $/sqft
last 12 mo · ≤1 miLoading sold comps…